Institutional Change in Old Industrial Areas – Lessons for ... - UMAR
Institutional Change in Old Industrial Areas – Lessons for ... - UMAR
Institutional Change in Old Industrial Areas – Lessons for ... - UMAR

Create successful ePaper yourself
Turn your PDF publications into a flip-book with our unique Google optimized e-Paper software.
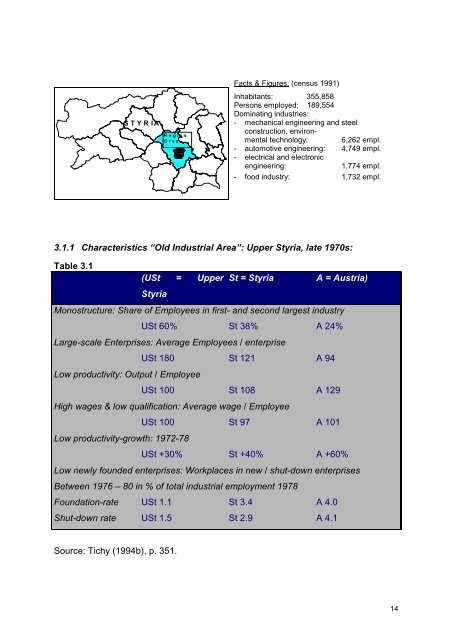
STYRIA<br />
Region<br />
Graz<br />
Facts & Figures: (census 1991)<br />
Inhabitants: 355,858<br />
Persons employed: 189,554<br />
Dom<strong>in</strong>at<strong>in</strong>g <strong>in</strong>dustries:<br />
- mechanical eng<strong>in</strong>eer<strong>in</strong>g and steel<br />
construction, environmental<br />
technology: 6,262 empl.<br />
- automotive eng<strong>in</strong>eer<strong>in</strong>g: 4,749 empl.<br />
- electrical and electronic<br />
eng<strong>in</strong>eer<strong>in</strong>g:<br />
1,774 empl.<br />
- food <strong>in</strong>dustry: 1,732 empl.<br />
3.1.1 Characteristics “<strong>Old</strong> <strong>Industrial</strong> Area”: Upper Styria, late 1970s:<br />
Table 3.1<br />
(USt = Upper St = Styria A = Austria)<br />
Styria<br />
Monostructure: Share of Employees <strong>in</strong> first- and second largest <strong>in</strong>dustry<br />
USt 60% St 38% A 24%<br />
Large-scale Enterprises: Average Employees / enterprise<br />
USt 180 St 121 A 94<br />
Low productivity: Output / Employee<br />
USt 100 St 108 A 129<br />
High wages & low qualification: Average wage / Employee<br />
USt 100 St 97 A 101<br />
Low productivity-growth: 1972-78<br />
USt +30% St +40% A +60%<br />
Low newly founded enterprises: Workplaces <strong>in</strong> new / shut-down enterprises<br />
Between 1976 <strong>–</strong> 80 <strong>in</strong> % of total <strong>in</strong>dustrial employment 1978<br />
Foundation-rate USt 1.1 St 3.4 A 4.0<br />
Shut-down rate USt 1.5 St 2.9 A 4.1<br />
Source: Tichy (1994b), p. 351.<br />
14