Institutional Change in Old Industrial Areas – Lessons for ... - UMAR
Institutional Change in Old Industrial Areas – Lessons for ... - UMAR
Institutional Change in Old Industrial Areas – Lessons for ... - UMAR

You also want an ePaper? Increase the reach of your titles
YUMPU automatically turns print PDFs into web optimized ePapers that Google loves.
3.2.2.3 Unemployment<br />
Unemployment analysis of Upper Styria will <strong>in</strong>clude three ma<strong>in</strong> parts: the overall<br />
unemployment development dur<strong>in</strong>g the 1980s and 1990s, unemployment of young<br />
people (15-25 years of age) and elderly unemployed (> 50 years of age).<br />
To beg<strong>in</strong>, Table 3.7 summarises the development of the overall unemployment rate<br />
<strong>in</strong> Austria, Styria and Upper Styria. The unemployment rate represents the share of<br />
unemployed <strong>in</strong> the total number of employees plus the no. of unemployed.<br />
The unemployment rate rose <strong>in</strong> Upper Styria from 2,8% <strong>in</strong> 1981 to 8,1% <strong>in</strong> 1991. In<br />
1998, the rate settled at 8,5% after an all year high of 10,2% <strong>in</strong> 1993. With<strong>in</strong> the<br />
same period, the unemployment rate at Styrian level was 2,9% (1981) and rose to<br />
7,1% (1991). After an all time high of 8,1 % <strong>in</strong> 1993 and repeatedly <strong>in</strong> 1996, the rate<br />
slightly improved to 8,1% <strong>in</strong> 1998.<br />
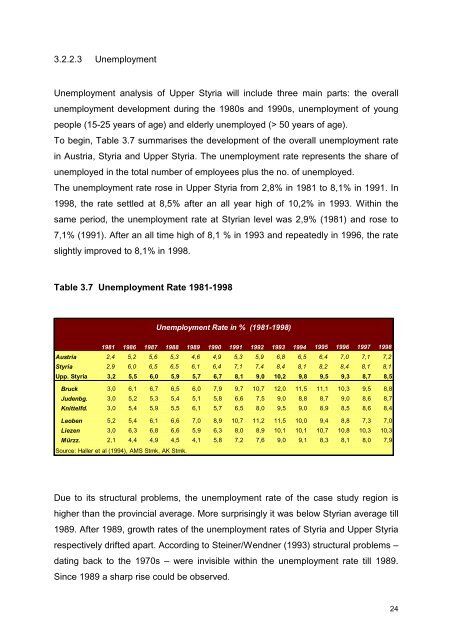
Table 3.7 Unemployment Rate 1981-1998<br />
Unemployment Rate <strong>in</strong> % (1981-1998)<br />
1981 1986 1987 1988 1989 1990 1991 1992 1993 1994 1995 1996 1997 1998<br />
Austria 2,4 5,2 5,6 5,3 4,6 4,9 5,3 5,9 6,8 6,5 6,4 7,0 7,1 7,2<br />
Styria 2,9 6,0 6,5 6,5 6,1 6,4 7,1 7,4 8,4 8,1 8,2 8,4 8,1 8,1<br />
Upp. Styria 3,2 5,5 6,0 5,9 5,7 6,7 8,1 9,0 10,2 9,8 9,5 9,3 8,7 8,5<br />
Bruck 3,0 6,1 6,7 6,5 6,0 7,9 9,7 10,7 12,0 11,5 11,1 10,3 9,5 8,8<br />
Judenbg. 3,0 5,2 5,3 5,4 5,1 5,8 6,6 7,5 9,0 8,8 8,7 9,0 8,6 8,7<br />
Knittelfd. 3,0 5,4 5,9 5,5 6,1 5,7 6,5 8,0 9,5 9,0 8,9 8,5 8,6 8,4<br />
Leoben 5,2 5,4 6,1 6,6 7,0 8,9 10,7 11,2 11,5 10,0 9,4 8,8 7,3 7,0<br />
Liezen 3,0 6,3 6,8 6,6 5,9 6,3 8,0 8,9 10,1 10,1 10,7 10,8 10,3 10,3<br />
Mürzz. 2,1 4,4 4,9 4,5 4,1 5,8 7,2 7,6 9,0 9,1 8,3 8,1 8,0 7,9<br />
Source: Haller et al (1994), AMS Stmk, AK Stmk.<br />
Due to its structural problems, the unemployment rate of the case study region is<br />
higher than the prov<strong>in</strong>cial average. More surpris<strong>in</strong>gly it was below Styrian average till<br />
1989. After 1989, growth rates of the unemployment rates of Styria and Upper Styria<br />
respectively drifted apart. Accord<strong>in</strong>g to Ste<strong>in</strong>er/Wendner (1993) structural problems <strong>–</strong><br />
dat<strong>in</strong>g back to the 1970s <strong>–</strong> were <strong>in</strong>visible with<strong>in</strong> the unemployment rate till 1989.<br />
S<strong>in</strong>ce 1989 a sharp rise could be observed.<br />
24