Institutional Change in Old Industrial Areas – Lessons for ... - UMAR
Institutional Change in Old Industrial Areas – Lessons for ... - UMAR
Institutional Change in Old Industrial Areas – Lessons for ... - UMAR

You also want an ePaper? Increase the reach of your titles
YUMPU automatically turns print PDFs into web optimized ePapers that Google loves.
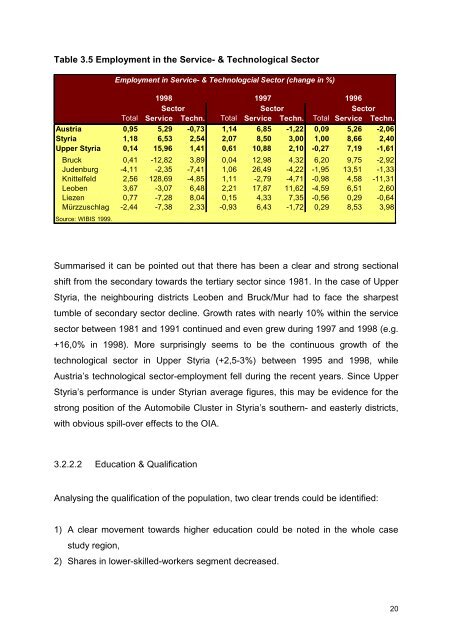
Table 3.5 Employment <strong>in</strong> the Service- & Technological Sector<br />
Employment <strong>in</strong> Service- & Technologcial Sector (change <strong>in</strong> %)<br />
1998 1997 1996<br />
Sector Sector Sector<br />
Total Service Techn. Total Service Techn. Total Service Techn.<br />
Austria 0,95 5,29 -0,73 1,14 6,85 -1,22 0,09 5,26 -2,06<br />
Styria 1,18 6,53 2,54 2,07 8,50 3,00 1,00 8,66 2,40<br />
Upper Styria 0,14 15,96 1,41 0,61 10,88 2,10 -0,27 7,19 -1,61<br />
Bruck 0,41 -12,82 3,89 0,04 12,98 4,32 6,20 9,75 -2,92<br />
Judenburg -4,11 -2,35 -7,41 1,06 26,49 -4,22 -1,95 13,51 -1,33<br />
Knittelfeld 2,56 128,69 -4,85 1,11 -2,79 -4,71 -0,98 4,58 -11,31<br />
Leoben 3,67 -3,07 6,48 2,21 17,87 11,62 -4,59 6,51 2,60<br />
Liezen 0,77 -7,28 8,04 0,15 4,33 7,35 -0,56 0,29 -0,64<br />
Mürzzuschlag -2,44 -7,38 2,33 -0,93 6,43 -1,72 0,29 8,53 3,98<br />
Source: WIBIS 1999.<br />
Summarised it can be po<strong>in</strong>ted out that there has been a clear and strong sectional<br />
shift from the secondary towards the tertiary sector s<strong>in</strong>ce 1981. In the case of Upper<br />
Styria, the neighbour<strong>in</strong>g districts Leoben and Bruck/Mur had to face the sharpest<br />
tumble of secondary sector decl<strong>in</strong>e. Growth rates with nearly 10% with<strong>in</strong> the service<br />
sector between 1981 and 1991 cont<strong>in</strong>ued and even grew dur<strong>in</strong>g 1997 and 1998 (e.g.<br />
+16,0% <strong>in</strong> 1998). More surpris<strong>in</strong>gly seems to be the cont<strong>in</strong>uous growth of the<br />
technological sector <strong>in</strong> Upper Styria (+2,5-3%) between 1995 and 1998, while<br />
Austria’s technological sector-employment fell dur<strong>in</strong>g the recent years. S<strong>in</strong>ce Upper<br />
Styria’s per<strong>for</strong>mance is under Styrian average figures, this may be evidence <strong>for</strong> the<br />
strong position of the Automobile Cluster <strong>in</strong> Styria’s southern- and easterly districts,<br />
with obvious spill-over effects to the OIA.<br />
3.2.2.2 Education & Qualification<br />
Analys<strong>in</strong>g the qualification of the population, two clear trends could be identified:<br />
1) A clear movement towards higher education could be noted <strong>in</strong> the whole case<br />
study region,<br />
2) Shares <strong>in</strong> lower-skilled-workers segment decreased.<br />
20