EQUI-VEST - AXA Equitable
EQUI-VEST - AXA Equitable
EQUI-VEST - AXA Equitable

Create successful ePaper yourself
Turn your PDF publications into a flip-book with our unique Google optimized e-Paper software.
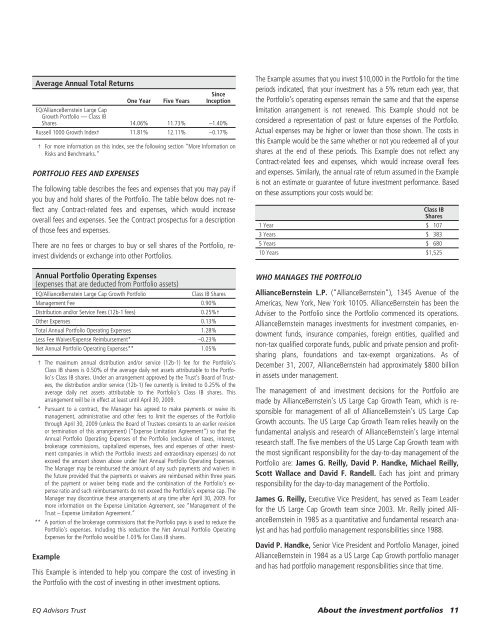
Average Annual Total Returns<br />
One Year Five Years<br />
Since<br />
Inception<br />
EQ/AllianceBernstein Large Cap<br />
Growth Portfolio — Class IB<br />
Shares 14.06% 11.73% –1.40%<br />
Russell 1000 Growth Index† 11.81% 12.11% –0.17%<br />
† For more information on this index, see the following section “More Information on<br />
Risks and Benchmarks.”<br />
PORTFOLIO FEES AND EXPENSES<br />
The following table describes the fees and expenses that you may pay if<br />
you buy and hold shares of the Portfolio. The table below does not reflect<br />
any Contract-related fees and expenses, which would increase<br />
overall fees and expenses. See the Contract prospectus for a description<br />
of those fees and expenses.<br />
There are no fees or charges to buy or sell shares of the Portfolio, reinvest<br />
dividends or exchange into other Portfolios.<br />
Annual Portfolio Operating Expenses<br />
(expenses that are deducted from Portfolio assets)<br />
EQ/AllianceBernstein Large Cap Growth Portfolio<br />
Class IB Shares<br />
Management Fee 0.90%<br />
Distribution and/or Service Fees (12b-1 fees) 0.25%†<br />
Other Expenses 0.13%<br />
Total Annual Portfolio Operating Expenses 1.28%<br />
Less Fee Waiver/Expense Reimbursement* –0.23%<br />
Net Annual Portfolio Operating Expenses** 1.05%<br />
† The maximum annual distribution and/or service (12b-1) fee for the Portfolio’s<br />
Class IB shares is 0.50% of the average daily net assets attributable to the Portfolio’s<br />
Class IB shares. Under an arrangement approved by the Trust’s Board of Trustees,<br />
the distribution and/or service (12b-1) fee currently is limited to 0.25% of the<br />
average daily net assets attributable to the Portfolio’s Class IB shares. This<br />
arrangement will be in effect at least until April 30, 2009.<br />
* Pursuant to a contract, the Manager has agreed to make payments or waive its<br />
management, administrative and other fees to limit the expenses of the Portfolio<br />
through April 30, 2009 (unless the Board of Trustees consents to an earlier revision<br />
or termination of this arrangement) (“Expense Limitation Agreement”) so that the<br />
Annual Portfolio Operating Expenses of the Portfolio (exclusive of taxes, interest,<br />
brokerage commissions, capitalized expenses, fees and expenses of other investment<br />
companies in which the Portfolio invests and extraordinary expenses) do not<br />
exceed the amount shown above under Net Annual Portfolio Operating Expenses.<br />
The Manager may be reimbursed the amount of any such payments and waivers in<br />
the future provided that the payments or waivers are reimbursed within three years<br />
of the payment or waiver being made and the combination of the Portfolio’s expense<br />
ratio and such reimbursements do not exceed the Portfolio’s expense cap. The<br />
Manager may discontinue these arrangements at any time after April 30, 2009. For<br />
more information on the Expense Limitation Agreement, see “Management of the<br />
Trust – Expense Limitation Agreement.”<br />
** A portion of the brokerage commissions that the Portfolio pays is used to reduce the<br />
Portfolio’s expenses. Including this reduction the Net Annual Portfolio Operating<br />
Expenses for the Portfolio would be 1.03% for Class IB shares.<br />
Example<br />
This Example is intended to help you compare the cost of investing in<br />
the Portfolio with the cost of investing in other investment options.<br />
The Example assumes that you invest $10,000 in the Portfolio for the time<br />
periods indicated, that your investment has a 5% return each year, that<br />
the Portfolio’s operating expenses remain the same and that the expense<br />
limitation arrangement is not renewed. This Example should not be<br />
considered a representation of past or future expenses of the Portfolio.<br />
Actual expenses may be higher or lower than those shown. The costs in<br />
this Example would be the same whether or not you redeemed all of your<br />
shares at the end of these periods. This Example does not reflect any<br />
Contract-related fees and expenses, which would increase overall fees<br />
and expenses. Similarly, the annual rate of return assumed in the Example<br />
is not an estimate or guarantee of future investment performance. Based<br />
on these assumptions your costs would be:<br />
Class IB<br />
Shares<br />
1 Year $ 107<br />
3 Years $ 383<br />
5 Years $ 680<br />
10 Years $1,525<br />
WHO MANAGES THE PORTFOLIO<br />
AllianceBernstein L.P. (“AllianceBernstein”), 1345 Avenue of the<br />
Americas, New York, New York 10105. AllianceBernstein has been the<br />
Adviser to the Portfolio since the Portfolio commenced its operations.<br />
AllianceBernstein manages investments for investment companies, endowment<br />
funds, insurance companies, foreign entities, qualified and<br />
non-tax qualified corporate funds, public and private pension and profitsharing<br />
plans, foundations and tax-exempt organizations. As of<br />
December 31, 2007, AllianceBernstein had approximately $800 billion<br />
in assets under management.<br />
The management of and investment decisions for the Portfolio are<br />
made by AllianceBernstein’s US Large Cap Growth Team, which is responsible<br />
for management of all of AllianceBernstein’s US Large Cap<br />
Growth accounts. The US Large Cap Growth Team relies heavily on the<br />
fundamental analysis and research of AllianceBernstein’s large internal<br />
research staff. The five members of the US Large Cap Growth team with<br />
the most significant responsibility for the day-to-day management of the<br />
Portfolio are: James G. Reilly, David P. Handke, Michael Reilly,<br />
Scott Wallace and David F. Randell. Each has joint and primary<br />
responsibility for the day-to-day management of the Portfolio.<br />
James G. Reilly, Executive Vice President, has served as Team Leader<br />
for the US Large Cap Growth team since 2003. Mr. Reilly joined AllianceBernstein<br />
in 1985 as a quantitative and fundamental research analyst<br />
and has had portfolio management responsibilities since 1988.<br />
David P. Handke, Senior Vice President and Portfolio Manager, joined<br />
AllianceBernstein in 1984 as a US Large Cap Growth portfolio manager<br />
and has had portfolio management responsibilities since that time.<br />
EQ Advisors Trust About the investment portfolios 11