- Page 1 and 2:
EQUI-VEST ® COMBINATION VARIABLE A
- Page 3 and 4:
EQUI-VEST SM A combination variable
- Page 5 and 6:
Contents of this prospectus EQUI-VE
- Page 7 and 8:
Index of key words and phrases This
- Page 9 and 10:
How to reach us Please communicate
- Page 11 and 12:
EQUI-VEST SM at a glance — key fe
- Page 13 and 14:
Other contracts We offer a variety
- Page 15 and 16:
This table shows the fees and expen
- Page 17 and 18:
Portfolio Name: EQ/AllianceBernstei
- Page 19 and 20:
EQ ADVISORS TRUST: If you surrender
- Page 21 and 22:
1. Contract features and benefits H
- Page 23 and 24:
Owner and annuitant requirements Un
- Page 25 and 26:
AXA Premier VIP Trust Portfolio Nam
- Page 27 and 28:
EQ Advisors Trust Portfolio Name EQ
- Page 29 and 30:
Guaranteed interest option The guar
- Page 31 and 32:
Allocating your contributions Once
- Page 33 and 34:
owner’s original IRA. You should
- Page 35 and 36:
3. Transferring your money among in
- Page 37 and 38:
• Under the interest sweep, when
- Page 39 and 40:
Currently, we do not impose a withd
- Page 41 and 42:
in general, the longer the period o
- Page 43 and 44:
owned EQUI-VEST SM contract/certifi
- Page 45 and 46:
The charge is deducted pro rata fro
- Page 47 and 48:
Single sum payments generally are p
- Page 49 and 50:
7. Tax information Overview In this
- Page 51 and 52:
The circumstances that would lead t
- Page 53 and 54:
which you make the contribution inc
- Page 55 and 56:
plan, 403(b) plan or governmental e
- Page 57 and 58:
Roth individual retirement annuitie
- Page 59 and 60:
SEP-IRA or SIMPLE IRA). You cannot
- Page 61 and 62:
Table I at the guaranteed minimum r
- Page 63 and 64:
8. More information About our Separ
- Page 65 and 66:
We have been advised that the staff
- Page 67 and 68:
on the basis of contributions alone
- Page 69 and 70:
Appendix I: QP IRA contracts The fo
- Page 71 and 72:
Unit values and number of units out
- Page 73 and 74:
Unit values and number of units out
- Page 75 and 76:
Appendix III: Market value adjustme
- Page 77 and 78:
Appendix V: State contract availabi
- Page 79 and 80:
State Features / benefits / charges
- Page 81:
AXA Equitable Life Insurance Compan
- Page 85 and 86:
INTRODUCTION AXA Premier VIP Trust
- Page 87 and 88:
THE AXA ALLOCATION PORTFOLIOS AT A
- Page 89 and 90:
AXA CONSERVATIVE ALLOCATION PORTFOL
- Page 91 and 92:
AXA CONSERVATIVE-PLUS ALLOCATION PO
- Page 93 and 94:
AXA MODERATE ALLOCATION PORTFOLIO M
- Page 95 and 96:
AXA MODERATE-PLUS ALLOCATION PORTFO
- Page 97 and 98:
AXA AGGRESSIVE ALLOCATION PORTFOLIO
- Page 99 and 100:
FEES AND EXPENSES OF THE AXA ALLOCA
- Page 101 and 102:
MORE ABOUT INVESTMENT STRATEGIES &
- Page 103 and 104:
MORE ABOUT INVESTMENT STRATEGIES &
- Page 105 and 106:
MORE ABOUT INVESTMENT STRATEGIES &
- Page 107 and 108:
MORE ABOUT INVESTMENT STRATEGIES &
- Page 109 and 110:
INFORMATION REGARDING THE UNDERLYIN
- Page 111 and 112:
INFORMATION REGARDING THE UNDERLYIN
- Page 113 and 114:
INFORMATION REGARDING THE UNDERLYIN
- Page 115 and 116:
INFORMATION REGARDING THE UNDERLYIN
- Page 117 and 118:
INFORMATION REGARDING THE UNDERLYIN
- Page 119 and 120:
INFORMATION REGARDING THE UNDERLYIN
- Page 121 and 122:
INFORMATION REGARDING THE UNDERLYIN
- Page 123 and 124:
INFORMATION REGARDING THE UNDERLYIN
- Page 125 and 126:
INFORMATION REGARDING THE UNDERLYIN
- Page 127 and 128:
INFORMATION REGARDING THE UNDERLYIN
- Page 129 and 130:
MANAGEMENT TEAM The Manager The Man
- Page 131 and 132:
PORTFOLIO SERVICES Buying and Selli
- Page 133 and 134:
PORTFOLIO SERVICES (cont’d) • T
- Page 135 and 136:
DESCRIPTION OF BENCHMARKS Broad-bas
- Page 137 and 138:
FINANCIAL HIGHLIGHTS The following
- Page 139 and 140:
FINANCIAL HIGHLIGHTS (cont’d) AXA
- Page 141 and 142:
FINANCIAL HIGHLIGHTS (cont’d) AXA
- Page 143 and 144:
FINANCIAL HIGHLIGHTS (cont’d) AXA
- Page 145 and 146:
FINANCIAL HIGHLIGHTS (cont’d) AXA
- Page 147 and 148:
FINANCIAL HIGHLIGHTS (cont’d) * C
- Page 149 and 150:
EQ Advisors Trust SM Prospectus dat
- Page 151 and 152:
Table of contents 1. About the Inve
- Page 153 and 154:
Equity Portfolios EQ/AllianceBernst
- Page 155 and 156:
EQ/AllianceBernstein International
- Page 157 and 158:
coordinating the portfolio’s inve
- Page 159 and 160:
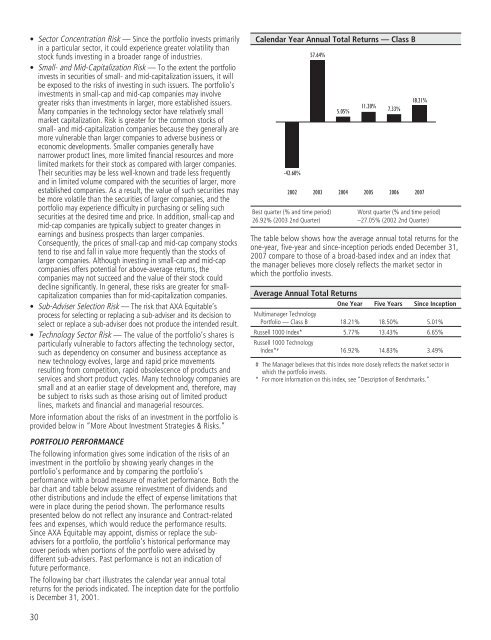
Average Annual Total Returns One Ye
- Page 161 and 162:
EQ/AllianceBernstein Small Cap Grow
- Page 163 and 164:
EQ/AllianceBernstein Value Portfoli
- Page 165 and 166:
John Phillips is a Senior Portfolio
- Page 167 and 168:
Annual Portfolio Operating Expenses
- Page 169 and 170:
Trust) advised by the same Adviser
- Page 171 and 172:
EQ/BlackRock Basic Value Equity Por
- Page 173 and 174:
and Portfolio Manager with BlackRoc
- Page 175 and 176:
Calendar Year Annual Total Returns
- Page 177 and 178:
EQ/Boston Advisors Equity Income Po
- Page 179 and 180:
EQ/Calvert Socially Responsible Por
- Page 181 and 182:
† The maximum annual distribution
- Page 183 and 184:
Annual Portfolio Operating Expenses
- Page 185 and 186:
EQ/Capital Guardian Research Portfo
- Page 187 and 188:
EQ/Davis New York Venture Portfolio
- Page 189 and 190:
EQ/Equity 500 Index Portfolio INVES
- Page 191 and 192:
EQ/Evergreen Omega Portfolio INVEST
- Page 193 and 194:
EQ/FI Mid Cap Portfolio INVESTMENT
- Page 195 and 196:
EQ/Franklin Income Portfolio INVEST
- Page 197 and 198:
assessment, and the management of d
- Page 199 and 200:
Average Annual Total Returns Since
- Page 201 and 202:
EQ/GAMCO Mergers and Acquisitions P
- Page 203 and 204:
WHO MANAGES THE PORTFOLIO GAMCO Ass
- Page 205 and 206:
There are no fees or charges to buy
- Page 207 and 208:
PORTFOLIO PERFORMANCE The bar chart
- Page 209 and 210:
EQ/International Growth Portfolio I
- Page 211 and 212:
EQ/JPMorgan Value Opportunities Por
- Page 213 and 214:
EQ/Large Cap Core PLUS Portfolio IN
- Page 215 and 216:
management fees, bear its pro rata
- Page 217 and 218:
EQ/Large Cap Growth PLUS Portfolio
- Page 219 and 220:
*** A portion of the brokerage comm
- Page 221 and 222:
† For more information on this in
- Page 223 and 224:
PORTFOLIO FEES AND EXPENSES The fol
- Page 225 and 226:
Average Annual Total Returns Since
- Page 227 and 228:
Average Annual Total Returns Since
- Page 229 and 230:
PORTFOLIO PERFORMANCE The bar chart
- Page 231 and 232:
EQ/Mid Cap Value PLUS Portfolio INV
- Page 233 and 234:
that the Portfolio’s operating ex
- Page 235 and 236:
PORTFOLIO FEES AND EXPENSES The fol
- Page 237 and 238:
for this Portfolio is September 15,
- Page 239 and 240:
EQ/Oppenheimer Global Portfolio INV
- Page 241 and 242:
EQ/Oppenheimer Main Street Opportun
- Page 243 and 244:
EQ/Oppenheimer Main Street Small Ca
- Page 245 and 246:
Class IB Shares 1 Year $ 133 3 Year
- Page 247 and 248:
PORTFOLIO FEES AND EXPENSES The fol
- Page 249 and 250:
† For more information on this in
- Page 251 and 252:
Annual Portfolio Operating Expenses
- Page 253 and 254:
PORTFOLIO FEES AND EXPENSES The fol
- Page 255 and 256:
Annual Portfolio Operating Expenses
- Page 257 and 258:
Average Annual Total Returns One Ye
- Page 259 and 260:
EQ/Van Kampen Mid Cap Growth Portfo
- Page 261 and 262:
EQ/Van Kampen Real Estate Portfolio
- Page 263 and 264:
Fixed Income Portfolios EQ/Alliance
- Page 265 and 266:
Annual Portfolio Operating Expenses
- Page 267 and 268:
esults of the Portfolio (to which t
- Page 269 and 270:
EQ/Bond Index Portfolio INVESTMENT
- Page 271 and 272:
EQ/Caywood-Scholl High Yield Bond P
- Page 273 and 274:
EQ/Evergreen International Bond Por
- Page 275 and 276:
EQ/JPMorgan Core Bond Portfolio INV
- Page 277 and 278:
EQ/Long Term Bond Portfolio INVESTM
- Page 279 and 280:
EQ/Money Market Portfolio INVESTMEN
- Page 281 and 282:
EQ/PIMCO Real Return Portfolio INVE
- Page 283 and 284:
EQ/Short Duration Bond Portfolio IN
- Page 285 and 286:
The Statement of Additional Informa
- Page 287 and 288:
significant impact on a Portfolio
- Page 289 and 290:
ability to make payments of princip
- Page 291 and 292:
Portfolio may have to hold these se
- Page 293 and 294:
Benchmarks The performance of each
- Page 295 and 296:
3. More information on investing in
- Page 297 and 298:
Information Regarding the Underlyin
- Page 299 and 300:
Information Regarding the Underlyin
- Page 301 and 302:
Information Regarding the Underlyin
- Page 303 and 304:
Information Regarding the Underlyin
- Page 305 and 306:
Information Regarding the Underlyin
- Page 307 and 308:
Information Regarding the Underlyin
- Page 309 and 310:
Information Regarding the Underlyin
- Page 311 and 312:
4. Management of the Trust This sec
- Page 313 and 314:
Cap Core PLUS Portfolio and the inv
- Page 315 and 316:
eached an agreement in principle wi
- Page 317 and 318:
plan to be developed by an independ
- Page 319 and 320:
5. Fund distribution arrangements T
- Page 321 and 322:
net inflows and outflows exceed an
- Page 323 and 324:
8. Dividends and other distribution
- Page 325 and 326:
10. Financial Highlights The financ
- Page 327 and 328:
Financial Highlights (cont’d) EQ/
- Page 329 and 330:
Financial Highlights (cont’d) EQ/
- Page 331 and 332:
Financial Highlights (cont’d) EQ/
- Page 333 and 334:
Financial Highlights (cont’d) EQ/
- Page 335 and 336:
Financial Highlights (cont’d) EQ/
- Page 337 and 338:
Financial Highlights (cont’d) EQ/
- Page 339 and 340:
Financial Highlights (cont’d) EQ/
- Page 341 and 342:
Financial Highlights (cont’d) EQ/
- Page 343 and 344:
Financial Highlights (cont’d) EQ/
- Page 345 and 346:
Financial Highlights (cont’d) EQ/
- Page 347 and 348:
Financial Highlights (cont’d) EQ/
- Page 349 and 350:
Financial Highlights (cont’d) EQ/
- Page 351 and 352:
Financial Highlights (cont’d) EQ/
- Page 353 and 354:
Financial Highlights (cont’d) EQ/
- Page 355 and 356:
Financial Highlights (cont’d) EQ/
- Page 357 and 358:
Financial Highlights (cont’d) EQ/
- Page 359 and 360:
Financial Highlights (cont’d) EQ/
- Page 361 and 362:
Financial Highlights (cont’d) EQ/
- Page 363 and 364:
Financial Highlights (cont’d) EQ/
- Page 365 and 366:
Financial Highlights (cont’d) EQ/
- Page 367 and 368:
Financial Highlights (cont’d) EQ/
- Page 369 and 370:
Financial Highlights (cont’d) EQ/
- Page 371 and 372:
Financial Highlights (cont’d) EQ/
- Page 373 and 374:
Financial Highlights (cont’d) EQ/
- Page 375 and 376:
Financial Highlights (cont’d) EQ/
- Page 377 and 378:
Financial Highlights (cont’d) EQ/
- Page 379 and 380:
Financial Highlights (cont’d) EQ/
- Page 382 and 383:
If you would like more information
- Page 384 and 385:
Overview EQ ADVISORS TRUST EQ Advis
- Page 386 and 387:
1. About the investment portfolio T
- Page 388 and 389:
• Investment Grade Securities Ris
- Page 390 and 391: 2. More information on risks and th
- Page 392 and 393: grade securities. Lower rated bonds
- Page 394 and 395: Information Regarding the Franklin
- Page 396 and 397: 3. Management of the Trust The Trus
- Page 398 and 399: 4. Fund distribution arrangements T
- Page 400 and 401: tinues, AXA Equitable may take acti
- Page 402 and 403: 7. Dividends and other distribution
- Page 404: 9. Financial Highlights The financi
- Page 407: PROSPECTUS May 1, 2008 AXA PREMIER
- Page 410 and 411: Table of CONTENTS Goals, Strategies
- Page 412 and 413: • Derivatives Risk — Derivative
- Page 414 and 415: MULTIMANAGER CORE BOND PORTFOLIO Ma
- Page 416 and 417: More information about the risks of
- Page 418 and 419: small number of issuers, which may
- Page 420 and 421: sub-advisers and may dismiss, repla
- Page 422 and 423: MULTIMANAGER INTERNATIONAL EQUITY P
- Page 424 and 425: MULTIMANAGER LARGE CAP CORE EQUITY
- Page 426 and 427: MULTIMANAGER LARGE CAP GROWTH PORTF
- Page 428 and 429: MULTIMANAGER LARGE CAP VALUE PORTFO
- Page 430 and 431: MULTIMANAGER MID CAP GROWTH PORTFOL
- Page 432 and 433: MULTIMANAGER MID CAP VALUE PORTFOLI
- Page 434 and 435: MULTIMANAGER SMALL CAP GROWTH PORTF
- Page 436 and 437: The following bar chart illustrates
- Page 438 and 439: • Large Capitalization Risk — L
- Page 442 and 443: PORTFOLIO FEES & EXPENSES (cont’d
- Page 444 and 445: PORTFOLIO FEES & EXPENSES (cont’d
- Page 446 and 447: MORE ABOUT INVESTMENT STRATEGIES &
- Page 448 and 449: MORE ABOUT INVESTMENT STRATEGIES &
- Page 450 and 451: MANAGEMENT TEAM The Manager and the
- Page 452 and 453: MANAGEMENT TEAM The Manager and the
- Page 454 and 455: MANAGEMENT TEAM The Manager and the
- Page 456 and 457: MANAGEMENT TEAM The Manager and the
- Page 458 and 459: MANAGEMENT TEAM The Manager and the
- Page 460 and 461: MANAGEMENT TEAM The Manager and the
- Page 462 and 463: MANAGEMENT TEAM The Manager and the
- Page 464 and 465: MANAGEMENT TEAM The Manager and the
- Page 466 and 467: MANAGEMENT TEAM The Manager and the
- Page 468 and 469: MANAGEMENT TEAM The Manager and the
- Page 470 and 471: MANAGEMENT TEAM The Manager and the
- Page 472 and 473: MANAGEMENT TEAM The Manager and the
- Page 474 and 475: PORTFOLIO SERVICES (cont’d) telep
- Page 476 and 477: PORTFOLIO SERVICES (cont’d) Tax C
- Page 478 and 479: DESCRIPTION OF BENCHMARKS Each port
- Page 480 and 481: FINANCIAL HIGHLIGHTS The financial
- Page 482 and 483: FINANCIAL HIGHLIGHTS (cont’d) Mul
- Page 484 and 485: FINANCIAL HIGHLIGHTS (cont’d) Mul
- Page 486 and 487: FINANCIAL HIGHLIGHTS (cont’d) Mul
- Page 488 and 489: FINANCIAL HIGHLIGHTS (cont’d) Mul
- Page 490 and 491:
FINANCIAL HIGHLIGHTS (cont’d) Mul
- Page 492 and 493:
FINANCIAL HIGHLIGHTS (cont’d) Mul
- Page 494 and 495:
FINANCIAL HIGHLIGHTS (cont’d) Mul
- Page 496 and 497:
FINANCIAL HIGHLIGHTS (cont’d) Mul
- Page 498 and 499:
FINANCIAL HIGHLIGHTS (cont’d) Mul
- Page 500 and 501:
FINANCIAL HIGHLIGHTS (cont’d) Mul
- Page 502:
FINANCIAL HIGHLIGHTS (cont’d) * P
- Page 505:
PROSPECTUS MAY 1, 2008 AXA PREMIER
- Page 508 and 509:
Table of CONTENTS Goals, Strategies
- Page 510 and 511:
Underlying Portfolios.” Each of t
- Page 512 and 513:
Target 2035 Allocation Portfolio Ca
- Page 514 and 515:
FEES AND EXPENSES OF THE TARGET ALL
- Page 516 and 517:
MORE ABOUT INVESTMENT STRATEGIES &
- Page 518 and 519:
MORE ABOUT INVESTMENT STRATEGIES &
- Page 520 and 521:
MORE ABOUT INVESTMENT STRATEGIES &
- Page 522 and 523:
INFORMATION REGARDING THE UNDERLYIN
- Page 524 and 525:
INFORMATION REGARDING THE UNDERLYIN
- Page 526 and 527:
INFORMATION REGARDING THE UNDERLYIN
- Page 528 and 529:
INFORMATION REGARDING THE UNDERLYIN
- Page 530 and 531:
INFORMATION REGARDING THE UNDERLYIN
- Page 532 and 533:
MANAGEMENT TEAM The Manager (cont
- Page 534 and 535:
PORTFOLIO SERVICES (cont’d) If AX
- Page 536 and 537:
PORTFOLIO SERVICES (cont’d) Tax C
- Page 538 and 539:
FINANCIAL HIGHLIGHTS The following
- Page 540 and 541:
FINANCIAL HIGHLIGHTS (cont’d) Tar
- Page 542 and 543:
FINANCIAL HIGHLIGHTS (cont’d) Tar
- Page 544:
FINANCIAL HIGHLIGHTS (cont’d) * C
- Page 547 and 548:
DEPARTMENT OF LABOR NOTICE AXA Equi


