- Page 1: World Oil Outlook 2010 Organization
- Page 4 and 5: 4 The data, analysis and any other
- Page 6 and 7: Acknowledgements Director, Research
- Page 8 and 9: Section One Oil supply and demand o
- Page 10 and 11: L i s t o f b oxe s Box 1.1 The eme
- Page 12 and 13: Figure 1.19 OECD and non-OECD oil d
- Page 14 and 15: Foreword
- Page 16 and 17: 2 Moreover, it is important not to
- Page 18 and 19: Executive summary
- Page 20 and 21: 6 expectations, with a pervasive re
- Page 22 and 23: 8 to exploit. However, the melding
- Page 24 and 25: 10 term implications for the offsho
- Page 26 and 27: 12 a combination of an ethanol supp
- Page 28 and 29: 14 production will be required, but
- Page 30 and 31: 16 addressed by OPEC Member Countri
- Page 32 and 33: Section One
- Page 35 and 36: Chapter 1 W o r l d e n e r g y t r
- Page 37 and 38: feasible, whether they are non-conv
- Page 39 and 40: Futures and options contracts outst
- Page 41 and 42: the publishing of aggregate positio
- Page 43 and 44: led to a profound debt burden for m
- Page 45 and 46: Meanwhile, domestic consumption in
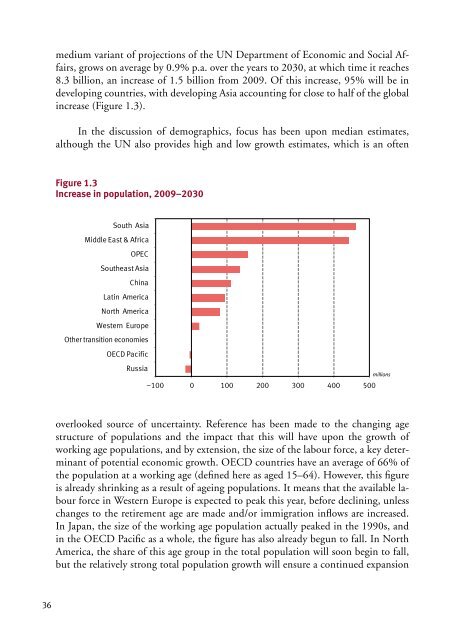
- Page 47 and 48: egions. Moreover, the evolving age
- Page 49: Compounding the effect of lower bir
- Page 53 and 54: ising protectionism implies real th
- Page 55 and 56: Figure Figure 1.6 1.6 Real Real GDP
- Page 57 and 58: and 2.1 mb/d by 2030. This was incl
- Page 59 and 60: In looking at the issue of energy s
- Page 61 and 62: Figure 1.7 Energy use per capita bo
- Page 63 and 64: Figure 1.8 Figure 1.7 World supply
- Page 65 and 66: Table 1.6 Coal and gas demand growt
- Page 67 and 68: America. Over the past year or so t
- Page 69 and 70: natural gas (LNG) was generally pro
- Page 71 and 72: construction in 13 countries, with
- Page 73 and 74: US New Figure 1.13 (29.9.10) In rec
- Page 75 and 76: Figure 1.16 Annual growth of oil de
- Page 77 and 78: modifications to the assumptions fo
- Page 79 and 80: Figure 70 1.20 Oil use per capita i
- Page 81 and 82: Figure 1.24 Annual growth in oil de
- Page 83 and 84: The initial focus is upon the prosp
- Page 85 and 86: linked to what is realistically fea
- Page 87 and 88: - e e EC 8 6 Figure 1.28 Figure 1.2
- Page 89 and 90: Figure 1.32 Non-OPEC oil supply, tr
- Page 91 and 92: 2009 2011 2013 2015 2017 2019 2021
- Page 93: Looking long-term there is a consid
- Page 96 and 97: 82 Figure 2.1 Oil demand by sector
- Page 98 and 99: 84 Table 2.1 (continued) Vehicle an
- Page 100 and 101:
lation (millions) 7,000 6,000 5,000
- Page 102 and 103:
88 Figure 2.6 Increase in number of
- Page 104 and 105:
90 Figure 2.7 Increase in volume of
- Page 106 and 107:
92 Second generation fuels and biom
- Page 108 and 109:
94 in developing Asia. By 2025, dev
- Page 110 and 111:
96 7.6 barrels of oil equivalent (b
- Page 112 and 113:
98 Table 2.6 Oil demand in domestic
- Page 114 and 115:
100 8 7 6 petrochemical sector grew
- Page 116 and 117:
102 Figure 2.12 Petroleum product f
- Page 118 and 119:
104 Other industry sectors Oil use
- Page 120 and 121:
106 Figure 2.14 Oil demand in other
- Page 122 and 123:
108 Figure 2.15 The evolution of oi
- Page 124 and 125:
15 110 Figure 2.16 Average annual p
- Page 126 and 127:
112 Demand by product The key findi
- Page 128 and 129:
114 Figure 2.17 Global product dema
- Page 130 and 131:
116 lubricants, waxes and solvents
- Page 132 and 133:
118 By 2014, non-OPEC crude plus NG
- Page 134 and 135:
120 Norwegian production fell to 2.
- Page 136 and 137:
122 Crude oil and NGLs in non-OPEC
- Page 138 and 139:
124 Box 3.1 Oil supply: lessons fro
- Page 140 and 141:
126 prices had remained that low, t
- Page 142 and 143:
128 In the coming years, advances i
- Page 144 and 145:
130 postponed until at least 2011,
- Page 146 and 147:
132 Nordaland and the Barents Sea,
- Page 148 and 149:
134 Table 3.4 Medium-term non-OPEC
- Page 150 and 151:
136 Biofuels With the recent oil pr
- Page 152 and 153:
138 OPEC upstream investment activi
- Page 154 and 155:
140 Figure 5.1 (6.10.10) Figure 4.1
- Page 156 and 157:
142 fundamentally affect the prospe
- Page 158 and 159:
144 Table 4.2 OPEC crude and non-OP
- Page 160 and 161:
146 oil as a financial asset traded
- Page 162 and 163:
148 over the past few years regardi
- Page 164 and 165:
150 It is critical that the UN MDGs
- Page 166 and 167:
Section Two
- Page 169 and 170:
Chapter 5 D i s t i l l a t i o n c
- Page 171 and 172:
With demand growing in the 1990s, t
- Page 173 and 174:
In respect to projects where no fir
- Page 175 and 176:
From other sources highlighted, onl
- Page 177 and 178:
on stream in September 2010. These
- Page 179 and 180:
the project. There is less certaint
- Page 181 and 182:
Figure 5.2 presents the yearly incr
- Page 183 and 184:
Table 5.1 Estimation of secondary p
- Page 185 and 186:
levels. In line with the expected d
- Page 187 and 188:
Figure 5.3 Figure 5.5 puts the same
- Page 189 and 190:
With utilization rates of at least
- Page 191 and 192:
upgrading capacity as a percentage
- Page 193 and 194:
Table 5.2 shows that cumulative ref
- Page 195 and 196:
Figure 5.6 Figure 5.6 Global gasoli
- Page 197 and 198:
elatively low in complexity and low
- Page 199 and 200:
Chapter 6 C o n v e r s i o n a n d
- Page 201 and 202:
Figure 6.2 Crude quality outlook in
- Page 203 and 204:
East, Latin America and Russia. Pro
- Page 205 and 206:
gallon cap and a 30 ppm annual aver
- Page 207 and 208:
It is diesel sulphur that presents
- Page 209 and 210:
y 20%, increase renewable energies
- Page 211 and 212:
for processing Mayan heavy crude, a
- Page 213 and 214:
that these processes can attain ove
- Page 215 and 216:
Long-term outlook Requirements for
- Page 217 and 218:
10 0 Figure 6.9 presents the region
- Page 219 and 220:
Figure 6.10 Desulphurization capaci
- Page 221 and 222:
There are several other factors tha
- Page 223 and 224:
Figure Figure 7.12 7.12 Figure 6.12
- Page 225 and 226:
Chapter 7 D o w n s t r e a m i n v
- Page 227 and 228:
Figure 8.1 than $10 billion will be
- Page 229 and 230:
Chapter 8 O i l m o v e m e n t s T
- Page 231 and 232:
growth in the global crude oil trad
- Page 233 and 234:
mb/d 50 decline in its crude export
- Page 235 and 236:
gasoline and diesel imbalance in th
- Page 237 and 238:
face the problem of a gasoline surp
- Page 239 and 240:
Figure 8.9 Net imports of liquid pr
- Page 241 and 242:
ica ada fic st Figure 8.10 Figure 9
- Page 243 and 244:
America pe a Canada -Pacific le Eas
- Page 245 and 246:
Chapter 9 D o w n s t r e a m c h a
- Page 247 and 248:
strongly in international markets,
- Page 249 and 250:
The overall conclusion is that the
- Page 251 and 252:
there is still the question about w
- Page 253 and 254:
equired GHG inventory and reporting
- Page 255 and 256:
Canada signalled a shift towards a
- Page 257 and 258:
• The impact will also be felt on
- Page 259 and 260:
245 Chapter 9
- Page 261 and 262:
1. http://www.ief.org/Events/Docume
- Page 263 and 264:
39. Gasoline desulphurization repor
- Page 265:
Abbreviations
- Page 268 and 269:
254 EUROPIA European Petroleum Indu
- Page 270 and 271:
256 UN MDGs United Nations Millenni
- Page 272 and 273:
Annex B
- Page 275 and 276:
OECD North America Canada Puerto Ri
- Page 277 and 278:
Equatorial Guinea Seychelles Eritre
- Page 279 and 280:
Tajikistan Uzbekistan The Former Yu
- Page 281:
World Oil Refining Logistics and De
- Page 284 and 285:
270 Brazil Uruguay Chile Africa Nor
- Page 286 and 287:
272 Croatia Slovakia Czech Republic
- Page 288 and 289:
Annex D
- Page 290 and 291:
276
- Page 292 and 293:
278 Global Subsidies Initiative (GS
- Page 294 and 295:
280 Society of Petroleum Engineers
- Page 296:
Organization of the Petroleum Expor