Auckland Transport Statement of Intent 2012 - 2015
Auckland Transport Statement of Intent 2012 - 2015
Auckland Transport Statement of Intent 2012 - 2015

You also want an ePaper? Increase the reach of your titles
YUMPU automatically turns print PDFs into web optimized ePapers that Google loves.
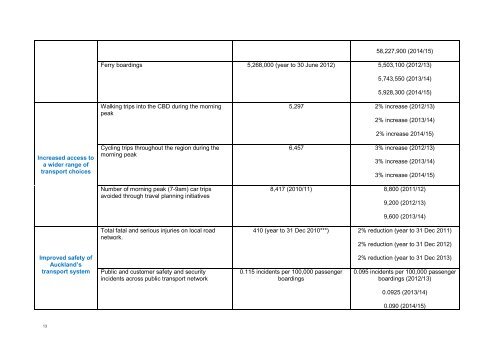
58,227,900 (2014/15)<br />
Ferry boardings 5,268,000 (year to 30 June <strong>2012</strong>) 5,503,100 (<strong>2012</strong>/13)<br />
5,743,550 (2013/14)<br />
5,928,300 (2014/15)<br />
Walking trips into the CBD during the morning<br />
peak<br />
5,297 2% increase (<strong>2012</strong>/13)<br />
2% increase (2013/14)<br />
Increased access to<br />
a wider range <strong>of</strong><br />
transport choices<br />
Cycling trips throughout the region during the<br />
morning peak<br />
Number <strong>of</strong> morning peak (7-9am) car trips<br />
avoided through travel planning initiatives<br />
Total fatal and serious injuries on local road<br />
network.<br />
2% increase 2014/15)<br />
6,457 3% increase (<strong>2012</strong>/13)<br />
3% increase (2013/14)<br />
3% increase (2014/15)<br />
8,417 (2010/11) 8,800 (2011/12)<br />
9,200 (<strong>2012</strong>/13)<br />
9,600 (2013/14)<br />
410 (year to 31 Dec 2010***) 2% reduction (year to 31 Dec 2011)<br />
2% reduction (year to 31 Dec <strong>2012</strong>)<br />
Improved safety <strong>of</strong><br />
<strong>Auckland</strong>’s<br />
transport system<br />
Public and customer safety and security<br />
incidents across public transport network<br />
0.115 incidents per 100,000 passenger<br />
boardings<br />
2% reduction (year to 31 Dec 2013)<br />
0.095 incidents per 100,000 passenger<br />
boardings (<strong>2012</strong>/13)<br />
0.0925 (2013/14)<br />
0.090 (2014/15)<br />
13