Auckland Transport Statement of Intent 2012 - 2015
Auckland Transport Statement of Intent 2012 - 2015
Auckland Transport Statement of Intent 2012 - 2015

You also want an ePaper? Increase the reach of your titles
YUMPU automatically turns print PDFs into web optimized ePapers that Google loves.
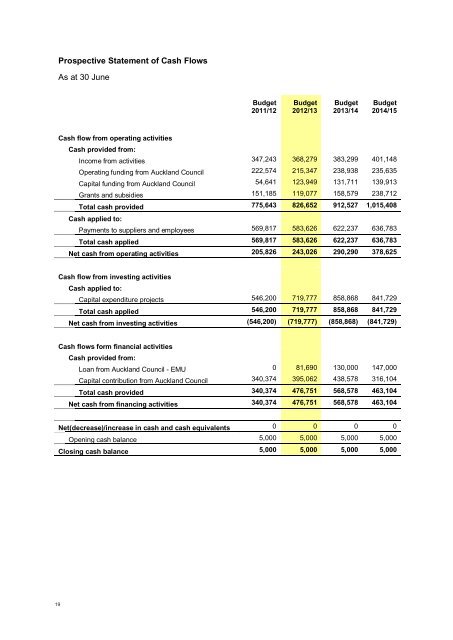
Prospective <strong>Statement</strong> <strong>of</strong> Cash Flows<br />
As at 30 June<br />
Budget<br />
2011/12<br />
Budget<br />
<strong>2012</strong>/13<br />
Budget<br />
2013/14<br />
Budget<br />
2014/15<br />
Cash flow from operating activities<br />
Cash provided from:<br />
Income from activities 347,243 368,279 383,299 401,148<br />
Operating funding from <strong>Auckland</strong> Council 222,574 215,347 238,938 235,635<br />
Capital funding from <strong>Auckland</strong> Council 54,641 123,949 131,711 139,913<br />
Grants and subsidies 151,185 119,077 158,579 238,712<br />
Total cash provided 775,643 826,652 912,527 1,015,408<br />
Cash applied to:<br />
Payments to suppliers and employees 569,817 583,626 622,237 636,783<br />
Total cash applied 569,817 583,626 622,237 636,783<br />
Net cash from operating activities 205,826 243,026 290,290 378,625<br />
Cash flow from investing activities<br />
Cash applied to:<br />
Capital expenditure projects 546,200 719,777 858,868 841,729<br />
Total cash applied 546,200 719,777 858,868 841,729<br />
Net cash from investing activities (546,200) (719,777) (858,868) (841,729)<br />
Cash flows form financial activities<br />
Cash provided from:<br />
Loan from <strong>Auckland</strong> Council - EMU 0 81,690 130,000 147,000<br />
Capital contribution from <strong>Auckland</strong> Council 340,374 395,062 438,578 316,104<br />
Total cash provided 340,374 476,751 568,578 463,104<br />
Net cash from financing activities 340,374 476,751 568,578 463,104<br />
Net(decrease)/increase in cash and cash equivalents 0 0 0 0<br />
Opening cash balance 5,000 5,000 5,000 5,000<br />
Closing cash balance 5,000 5,000 5,000 5,000<br />
19