2010-2011 AISD Parent Survey Gorzycki Middle School - Austin ISD
2010-2011 AISD Parent Survey Gorzycki Middle School - Austin ISD
2010-2011 AISD Parent Survey Gorzycki Middle School - Austin ISD

You also want an ePaper? Increase the reach of your titles
YUMPU automatically turns print PDFs into web optimized ePapers that Google loves.
<strong>2010</strong>-<strong>2011</strong> <strong>A<strong>ISD</strong></strong> <strong>Parent</strong> <strong>Survey</strong><br />
<strong>Gorzycki</strong> <strong>Middle</strong> <strong>School</strong><br />
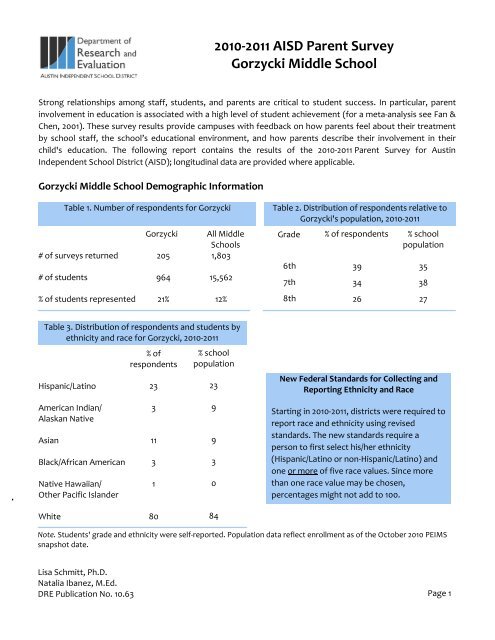
Strong relationships among staff, students, and parents are critical to student success. In particular, parent<br />
involvement in education is associated with a high level of student achievement (for a meta-analysis see Fan &<br />
Chen, 2001). These survey results provide campuses with feedback on how parents feel about their treatment<br />
by school staff, the school’s educational environment, and how parents describe their involvement in their<br />
child's education. The following report contains the results of the <strong>2010</strong>-<strong>2011</strong> <strong>Parent</strong> <strong>Survey</strong> for <strong>Austin</strong><br />
Independent <strong>School</strong> District (<strong>A<strong>ISD</strong></strong>); longitudinal data are provided where applicable.<br />
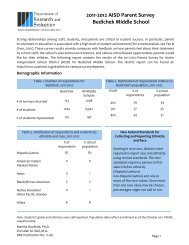
<strong>Gorzycki</strong> <strong>Middle</strong> <strong>School</strong> Demographic Information<br />
Table 1. Number of respondents for <strong>Gorzycki</strong><br />
# of surveys returned<br />
# of students<br />
% of students represented<br />
<strong>Gorzycki</strong><br />
205<br />
964<br />
21%<br />
All <strong>Middle</strong><br />
<strong>School</strong>s<br />
1,803<br />
15,562<br />
12%<br />
Table 2. Distribution of respondents relative to<br />
<strong>Gorzycki</strong>'s population, <strong>2010</strong>-<strong>2011</strong><br />
Grade<br />
6th<br />
7th<br />
8th<br />
% of respondents<br />
39<br />
34<br />
26<br />
% school<br />
population<br />
35<br />
38<br />
27<br />
Table 3. Distribution of respondents and students by<br />
ethnicity and race for <strong>Gorzycki</strong>, <strong>2010</strong>-<strong>2011</strong><br />
Hispanic/Latino<br />
% of<br />
respondents<br />
23<br />
% school<br />
population<br />
23<br />
New Federal Standards for Collecting and<br />
Reporting Ethnicity and Race<br />
American Indian/<br />
Alaskan Native<br />
Asian<br />
Black/African American<br />
Native Hawaiian/<br />
Other Pacific Islander<br />
3<br />
11<br />
3<br />
1<br />
9<br />
9<br />
3<br />
0<br />
Starting in <strong>2010</strong>-<strong>2011</strong>, districts were required to<br />
report race and ethnicity using revised<br />
standards. The new standards require a<br />
person to first select his/her ethnicity<br />
(Hispanic/Latino or non-Hispanic/Latino) and<br />
one or more of five race values. Since more<br />
than one race value may be chosen,<br />
percentages might not add to 100.<br />
White<br />
80<br />
84<br />
Note. Students' grade and ethnicity were self-reported. Population data reflect enrollment as of the October <strong>2010</strong> PEIMS<br />
snapshot date.<br />
Lisa Schmitt, Ph.D.<br />
Natalia Ibanez, M.Ed.<br />
DRE Publication No. 10.63 Page 1
A summary of <strong>Gorzycki</strong> <strong>Middle</strong> <strong>School</strong> survey results for the <strong>2010</strong>-<strong>2011</strong> school year is presented in figure 1.<br />
Scores over 3.0 are desirable, as indicated by the green line. Also, please note the green and red boxes that<br />
highlight the specific area in which <strong>Gorzycki</strong> most excels, as well as the area in which <strong>Gorzycki</strong> can improve<br />
most.<br />
Figure 1. <strong>Parent</strong> <strong>Survey</strong> subscales for <strong>Gorzycki</strong> <strong>Middle</strong> <strong>School</strong> and all <strong>A<strong>ISD</strong></strong> <strong>Middle</strong> <strong>School</strong>s, <strong>2010</strong>-<strong>2011</strong><br />
4.0<br />
3.5<br />
3.0<br />
3.3<br />
3.2<br />
3.2 3.2<br />
3.0<br />
3.1<br />
3.3 3.3<br />
3.1 3.1<br />
3.3<br />
3.1<br />
2.5<br />
2.0<br />
1.5<br />
1.0<br />
0.0<br />
0.0<br />
0.0<br />
<strong>Gorzycki</strong><br />
0.0<br />
0.0<br />
0.0<br />
Respectful<br />
<strong>School</strong><br />
Community<br />
Student<br />
Expectations<br />
and Progress<br />
Academic<br />
Planning<br />
Information<br />
Teacher<br />
Expectations<br />
Support for<br />
<strong>Parent</strong>al<br />
Involvement<br />
<strong>Parent</strong>al<br />
Assistance in<br />
Education<br />
<strong>Gorzycki</strong> <strong>Middle</strong> <strong>School</strong><br />
All <strong>Middle</strong> <strong>School</strong>s<br />
<strong>Gorzycki</strong>'s highest score on the<br />
<strong>2010</strong>-<strong>2011</strong> <strong>Parent</strong> <strong>Survey</strong> was<br />
Respectful <strong>School</strong> Community,<br />
which refers to the extent to<br />
which parents perceive that<br />
staff provide a welcoming,<br />
respectful environment for<br />
students and their families. We<br />
encourage you to continue<br />
fostering this kind of<br />
environment on your campus<br />
and to share the best practices<br />
that lead to a respectful school<br />
community.<br />
<strong>Gorzycki</strong>'s lowest score on the<br />
<strong>2010</strong>-<strong>2011</strong> <strong>Parent</strong> <strong>Survey</strong> was<br />
Academic Planning Information,<br />
which measures the adequacy of<br />
information and assistance that<br />
parents receive from school staff<br />
regarding their child's academic<br />
future. We encourage your<br />
campus staff to consider ways to<br />
involve parents in academic<br />
planning for their child.<br />
Note. In addition to the subscales reflected in Figure 1, parents responded to items regarding the Superintendent<br />
and Central Office Staff. For more information go to page 8.<br />
Page 2
Item Results<br />
Figure 2. Average rating for the item: "I believe that my child likes to go to school."<br />
205.00<br />
3.3<br />
3.3<br />
3.4<br />
2009-10<br />
<strong>Gorzycki</strong><br />
<strong>2010</strong>-11<br />
<strong>Gorzycki</strong><br />
All <strong>Middle</strong><br />
<strong>School</strong>s, <strong>2010</strong>-11<br />
1.0 1.5 2.0 2.5 3.0 3.5 4.0<br />
Respectful <strong>School</strong> Community<br />
2008-09<br />
<strong>Gorzycki</strong><br />
2009-10<br />
<strong>2010</strong>-11<br />
All<br />
<strong>Middle</strong> <strong>School</strong>s<br />
<strong>2010</strong>-11<br />
4. <strong>School</strong> staff provide me with positive feedback about<br />
n/a<br />
3.2<br />
3.1â<br />
3.1<br />
my child.<br />
5. <strong>School</strong> staff treat my child with courtesy and respect.<br />
6. I feel welcome in my child's classroom.<br />
16. My child's school is a safe learning environment.<br />
22a. My child's school principal treats me with courtesy<br />
n/a<br />
n/a<br />
n/a<br />
n/a<br />
3.4<br />
3.2<br />
3.5<br />
3.5á<br />
3.2â<br />
3.0â<br />
3.5<br />
3.4<br />
3.2<br />
3.1<br />
3.2<br />
3.3<br />
and respect.<br />
23a. My child's school assistant principal(s) treat me with<br />
n/a<br />
3.4á<br />
3.3â<br />
3.3<br />
courtesy and respect.<br />
24a. My child's teacher(s) treat me with courtesy and<br />
n/a<br />
3.4á<br />
3.4<br />
3.4<br />
respect.<br />
25a. My child's counselor(s) treat me with courtesy and<br />
n/a<br />
3.4<br />
3.4<br />
3.4<br />
respect.<br />
26. Office staff treat me with courtesy and respect.<br />
28h. <strong>School</strong> staff provide me with enough information<br />
n/a<br />
n/a<br />
3.4<br />
3.0á<br />
3.4<br />
2.9<br />
3.4<br />
3.0<br />
about handling complaints and concerns.<br />
Respectful <strong>School</strong> Community Average<br />
n/a<br />
3.3<br />
3.3<br />
3.2<br />
Note. Response options for the above items range from 1 (strongly disagree) to 4 (strongly agree). It is desirable to have<br />
a response of at least 3.0. Meaningful change from year to year is indicated by a á or â, and is defined as a Cohen's D<br />
effect size of ≥ .18.<br />
Page 3
Information About Expectations and Progress<br />
2008-09<br />
<strong>Gorzycki</strong><br />
2009-10<br />
<strong>2010</strong>-11<br />
All<br />
<strong>Middle</strong> <strong>School</strong>s<br />
<strong>2010</strong>-11<br />
My child's school staff clearly communicate their<br />
expectations for...<br />
8. My child's learning<br />
9. My child's behavior<br />
<strong>School</strong> staff provide me with enough information<br />
about my child's...<br />
27a. Academic progress<br />
27b. Preparedness for TAKS and other assessments<br />
27c. Risk of failing a grade<br />
27d. Availability of tutoring<br />
28a. Behavior<br />
28b. Attendance<br />
Expectations and Progress Average<br />
Note. Response options for the above items range from 1 (strongly disagree) to 4 (strongly agree). It is desirable to have<br />
a response of at least 3.0. Meaningful change from year to year is indicated by a á or â, and is defined as a Cohen's D<br />
effect size of ≥ .18.<br />
n/a<br />
n/a<br />
n/a<br />
n/a<br />
n/a<br />
n/a<br />
n/a<br />
n/a<br />
n/a<br />
3.3<br />
3.4<br />
3.4<br />
3.1<br />
3.2<br />
3.3<br />
3.3<br />
3.4<br />
3.3<br />
3.1â<br />
3.2â<br />
3.3<br />
3.1<br />
3.1<br />
3.1â<br />
3.2<br />
3.4<br />
3.2<br />
3.2<br />
3.3<br />
3.3<br />
3.1<br />
3.1<br />
3.2<br />
3.3<br />
3.4<br />
3.2<br />
Page 4
Academic Planning Information<br />
<strong>School</strong> staff provide me with enough<br />
information about...<br />
<strong>Gorzycki</strong><br />
2008-09 2009-10 <strong>2010</strong>-11<br />
All<br />
<strong>Middle</strong> <strong>School</strong>s<br />
<strong>2010</strong>-11<br />
27e. High school graduation requirements.<br />
n/a<br />
2.9<br />
2.9<br />
3.1<br />
28c. After school programs.<br />
n/a<br />
3.1<br />
3.0<br />
3.2<br />
28d. Transitions to and from elementary, middle, and high<br />
n/a<br />
3.2<br />
3.1<br />
3.1<br />
school.<br />
28e. Career opportunities for my child.<br />
n/a<br />
3.0 á<br />
2.9<br />
3.0<br />
28f. College admission requirements for financing options.<br />
n/a<br />
2.9<br />
2.7 â<br />
3.0<br />
Academic Planning Information Average<br />
n/a<br />
3.1<br />
3.0<br />
3.1<br />
Note. Response options for the above items range from 1 (strongly disagree) to 4 (strongly agree). It is desirable to have<br />
a response of at least 3.0. Meaningful change from year to year is indicated by a á or â, and is defined as a Cohen's D<br />
effect size of ≥ .18.<br />
Teacher Expectations<br />
2009-10<br />
<strong>Gorzycki</strong><br />
<strong>2010</strong>-11<br />
All<br />
<strong>Middle</strong> <strong>School</strong>s<br />
<strong>2010</strong>-11<br />
11. My child's teachers believe my child can do well in school.<br />
3.5<br />
3.4<br />
3.4<br />
12. My child's teachers believe my child can learn new things.<br />
3.5<br />
3.4<br />
3.4<br />
13. My child's teachers encourage my child to stick with problems<br />
3.4<br />
3.2<br />
3.3â<br />
until he/she can solve them.<br />
Teacher Expectations Average<br />
3.4<br />
3.3â<br />
3.3<br />
Note. Response options for the above items range from 1 (strongly disagree) to 4 (strongly agree). It is desirable to have<br />
a response of at least 3.0. Meaningful change from year to year is indicated by a á or â, and is defined as a Cohen's D<br />
effect size of ≥ .18.<br />
Page 5
Support for <strong>Parent</strong>al Involvement<br />
2008-09<br />
<strong>Gorzycki</strong><br />
2009-10<br />
<strong>2010</strong>-11<br />
All<br />
<strong>Middle</strong> <strong>School</strong>s<br />
<strong>2010</strong>-11<br />
7. My child's school staff use the suggestions that I make<br />
n/a<br />
3.2<br />
2.9 â<br />
3.1<br />
about my child's education.<br />
14. My child's teachers make it easy to be involved with<br />
n/a<br />
3.1<br />
3.0<br />
3.1<br />
my child's education.<br />
15. <strong>A<strong>ISD</strong></strong>'s online <strong>Parent</strong> Connection/Gradespeed system<br />
n/a<br />
3.6<br />
3.6<br />
3.4<br />
has helped me monitor my child's progress.*<br />
22b. My child's principal provides me with opportunities<br />
n/a<br />
3.3<br />
3.2 â<br />
3.2<br />
for 2-way communication (phone calls, meetings,<br />
email, etc.).<br />
23b. My child's assistant principal(s) provide me with<br />
n/a<br />
3.4<br />
3.2 â<br />
3.3<br />
opportunities for 2-way communication (phone calls,<br />
meetings, email, etc.).<br />
24b. My child's teacher(s) have helped me become more<br />
n/a<br />
3.2<br />
3.1<br />
3.2<br />
involved in my child's education.<br />
24c. My child's teacher(s) value my input in academic<br />
n/a<br />
3.3<br />
3.1 â<br />
3.2<br />
decisions about my child.<br />
24d. My child's teacher(s) provide me with opportunities<br />
n/a<br />
3.4<br />
3.3<br />
3.3<br />
for 2-way communication (phone calls, meetings,<br />
email, etc.).<br />
25b. My child's counselor(s) have helped me become<br />
n/a<br />
3.3<br />
3.1<br />
3.2<br />
more involved in my child's education.<br />
25c. My child's counselor(s) value my input in decisions<br />
n/a<br />
3.3<br />
3.1 â<br />
3.2<br />
about my child.<br />
25d. My child's counselor(s) provide me with<br />
n/a<br />
3.3<br />
3.3<br />
3.3<br />
opportunities for 2-way communication (phone calls,<br />
meetings, email, etc.).<br />
28g. <strong>School</strong> staff provide me with opportunities to be<br />
n/a<br />
3.3<br />
3.1<br />
3.1<br />
involved.<br />
Support for <strong>Parent</strong>al Involvement Average<br />
n/a<br />
3.2<br />
3.1<br />
3.2<br />
Note. Response options for the above items range from 1 (strongly disagree) to 4 (strongly agree). It is desirable to have<br />
a response of at least 3.0. Meaningful change from year to year is indicated by a á or â, and is defined as a Cohen's D<br />
effect size of ≥ .18.<br />
*Item 15 was not used in the subscale calculation.<br />
Page 6
<strong>Parent</strong>al Assistance, Communication, and <strong>School</strong> Involvement<br />
17. My child has a place at home for books and school materials.<br />
Please tell us how often you engage in the following activities with<br />
your child:<br />
<strong>Gorzycki</strong><br />
2009-10 <strong>2010</strong>-11<br />
n/a 3.6<br />
All<br />
<strong>Middle</strong> <strong>School</strong>s<br />
<strong>2010</strong>-11<br />
3.5<br />
29. Talk with my child about his/her school day.<br />
4<br />
4<br />
3.7<br />
30. Supervise my child's homework.<br />
3.5<br />
3.5<br />
3.4<br />
31. Help my child study for tests.<br />
3.3<br />
3.4<br />
3.2<br />
32. Talk with other parents about my child's school.<br />
3.1<br />
3.3<br />
2.9<br />
33. Communicate with my child's teachers (e.g., telephone, email,<br />
2.9<br />
2.9<br />
2.9<br />
notes, in person).<br />
34. Volunteer at my child's school.<br />
2.5<br />
2.6<br />
2.3<br />
35. Attend PTSA/PTA/CAC meetings.<br />
2.1<br />
2.1<br />
2.2<br />
36. Attend regularly scheduled parent-teacher conferences.<br />
3.4<br />
3.4<br />
3.1<br />
37. Attend annual meetings about my child's academic plans.<br />
3.2<br />
3.3<br />
3.0<br />
38. Visit my child's school (e.g., for lunch, walk him/her to class, to<br />
2.5<br />
2.5<br />
2.5<br />
observe).<br />
39. Attend performance events and/or sports events at my child's<br />
3.4<br />
3.5<br />
3.1<br />
school.<br />
40. Take my child places to learn (e.g., library, museum, zoo,<br />
n/a<br />
3.4<br />
3.2<br />
historical site, live performance, art gallery).<br />
41. Play board games/puzzles or sports together with my child.<br />
n/a<br />
3.5<br />
3.2<br />
42. Work on projects with my child (i.e., building, making, or fixing<br />
n/a<br />
3.5<br />
3.2<br />
something).<br />
43. Discuss with my child how to manage his/her time.<br />
n/a<br />
3.7<br />
3.5<br />
<strong>Parent</strong>al Assistance, Communication, and <strong>School</strong> Involvement<br />
Average<br />
n/a<br />
3.3<br />
3.1<br />
Note. Response options for the above subscales range from 1 (never) to 4 (often), except for item # 17 which was rated<br />
on a scale from 1 (strongly disagree) to 4 (strongly agree). It is desirable to have a response of at least 3.0. Meaningful<br />
change from year to year is indicated by a á or â, and is defined as a Cohen's D effect size of ≥ .18.<br />
Page 7
Superintendent Ratings<br />
21a. The superintendent has made a positive impact on the district's academic<br />
programs.<br />
21b. The superintendent does a good job of asking for input from parents.<br />
21c. The superintendent does a good job of communicating with parents.<br />
Superintendent Ratings Average<br />
<strong>Gorzycki</strong><br />
<strong>2010</strong>-11<br />
Note. Response options for the above items range from 1 (strongly disagree) to 4 (strongly agree). It is desirable to have<br />
a response of at least 3.0.<br />
These items were new to the <strong>2010</strong>-<strong>2011</strong> parent survey.<br />
2.6<br />
2.9<br />
2.9<br />
2.8<br />
All<br />
<strong>Middle</strong> <strong>School</strong>s<br />
<strong>2010</strong>-11<br />
2.9<br />
3.0<br />
3.0<br />
3.0<br />
Central Office Accessibility<br />
18. District staff are responsive to parents.<br />
19. I know who to contact if I have a question or concern about my child's<br />
education.<br />
20. Central Office staff treat me with courtesy and respect.<br />
<strong>Gorzycki</strong><br />
<strong>2010</strong>-11<br />
3.1<br />
3.2<br />
3.2<br />
All<br />
<strong>Middle</strong> <strong>School</strong>s<br />
<strong>2010</strong>-11<br />
3.1<br />
3.3<br />
3.2<br />
Note. Response options for the above items range from 1 (strongly disagree) to 4 (strongly agree). It is desirable to have<br />
a response of at least 3.0.<br />
These items were new to the <strong>2010</strong>-<strong>2011</strong> parent survey.<br />
References<br />
Fan, X. & Chen, M. (2001). <strong>Parent</strong>al involvement and students' academic achievement: A meta-analysis.<br />
Educational Psychology Review, 13(1), 1-22.<br />
Page 8
![Pageflex Server [document: PR1986512_00001] - Austin ISD](https://img.yumpu.com/27239252/1/190x245/pageflex-server-document-pr1986512-00001-austin-isd.jpg?quality=85)