Saving Patterns and Probability of Success in Individual ...
Saving Patterns and Probability of Success in Individual ...
Saving Patterns and Probability of Success in Individual ...
You also want an ePaper? Increase the reach of your titles
YUMPU automatically turns print PDFs into web optimized ePapers that Google loves.
<strong>Sav<strong>in</strong>g</strong> <strong>Patterns</strong> <strong>and</strong> <strong>Probability</strong> <strong>of</strong> … 7<br />
3. <strong>Sav<strong>in</strong>g</strong> <strong>Patterns</strong><br />
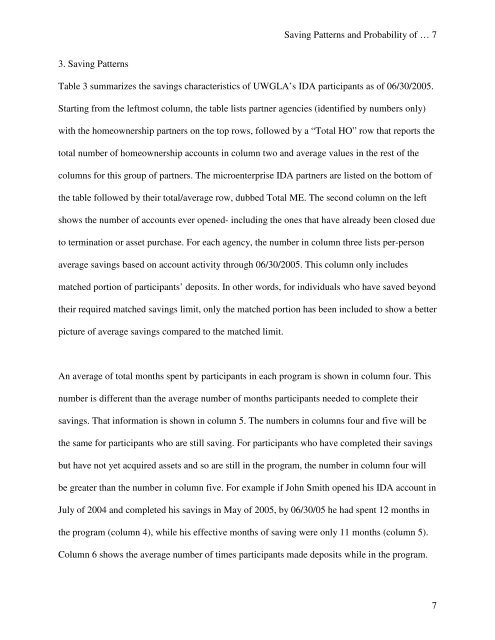
Table 3 summarizes the sav<strong>in</strong>gs characteristics <strong>of</strong> UWGLA’s IDA participants as <strong>of</strong> 06/30/2005.<br />
Start<strong>in</strong>g from the leftmost column, the table lists partner agencies (identified by numbers only)<br />
with the homeownership partners on the top rows, followed by a “Total HO” row that reports the<br />
total number <strong>of</strong> homeownership accounts <strong>in</strong> column two <strong>and</strong> average values <strong>in</strong> the rest <strong>of</strong> the<br />
columns for this group <strong>of</strong> partners. The microenterprise IDA partners are listed on the bottom <strong>of</strong><br />
the table followed by their total/average row, dubbed Total ME. The second column on the left<br />
shows the number <strong>of</strong> accounts ever opened- <strong>in</strong>clud<strong>in</strong>g the ones that have already been closed due<br />
to term<strong>in</strong>ation or asset purchase. For each agency, the number <strong>in</strong> column three lists per-person<br />
average sav<strong>in</strong>gs based on account activity through 06/30/2005. This column only <strong>in</strong>cludes<br />
matched portion <strong>of</strong> participants’ deposits. In other words, for <strong>in</strong>dividuals who have saved beyond<br />
their required matched sav<strong>in</strong>gs limit, only the matched portion has been <strong>in</strong>cluded to show a better<br />
picture <strong>of</strong> average sav<strong>in</strong>gs compared to the matched limit.<br />
An average <strong>of</strong> total months spent by participants <strong>in</strong> each program is shown <strong>in</strong> column four. This<br />
number is different than the average number <strong>of</strong> months participants needed to complete their<br />
sav<strong>in</strong>gs. That <strong>in</strong>formation is shown <strong>in</strong> column 5. The numbers <strong>in</strong> columns four <strong>and</strong> five will be<br />
the same for participants who are still sav<strong>in</strong>g. For participants who have completed their sav<strong>in</strong>gs<br />
but have not yet acquired assets <strong>and</strong> so are still <strong>in</strong> the program, the number <strong>in</strong> column four will<br />
be greater than the number <strong>in</strong> column five. For example if John Smith opened his IDA account <strong>in</strong><br />
July <strong>of</strong> 2004 <strong>and</strong> completed his sav<strong>in</strong>gs <strong>in</strong> May <strong>of</strong> 2005, by 06/30/05 he had spent 12 months <strong>in</strong><br />
the program (column 4), while his effective months <strong>of</strong> sav<strong>in</strong>g were only 11 months (column 5).<br />
Column 6 shows the average number <strong>of</strong> times participants made deposits while <strong>in</strong> the program.<br />
7


