280 Mar Ecol Prog Ser 459: 275–292, 2012 ulated systems, the low productivity of the elasmobranch species (skates and dogfish) with their characteristically delayed maturation, low fecundity, and relatively slow growth rates leads to a low F MSY around 0.1 (Table 1). Similarly, both Georges Bank redfish and Gulf of Alaska Pacific ocean perch (POP) (both long-lived, slow grow<strong>in</strong>g Scorpaenids) have generally low F MSY and resilience to exploitation. Conversely, cod and herr<strong>in</strong>g had the highest production rates <strong>in</strong> both systems, along with haddock <strong>in</strong> Georges Bank and walleye pollock <strong>in</strong> the Gulf of Alaska, result<strong>in</strong>g <strong>in</strong> relatively high F MSY at 0.3 or above. However, production of flatfish differed be - tween systems; Georges Bank species (yellowtail, w<strong>in</strong>ter, and w<strong>in</strong>dowpane flounder) had productivity similar to cod and herr<strong>in</strong>g, while Gulf of Alaska species (arrowtooth flounder, halibut, and flathead sole) had productivity more similar to elasmobranchs and scorpaenids. The relatively low production to biomass ratios for both Georges Bank Atlantic mackerel and Gulf of Alaska sablefish result <strong>in</strong> low to <strong>in</strong>termediate F MSY . With these contrasts as a basis, we next compare aggregate properties of the simulated systems. Our simulated systems are ‘cartoons’ of the actual systems, but parameters were based on data from each ecosystem such that broad productivity comparisons are possible. Overall, the simulated Georges Bank system has higher MSYs than the simulated Gulf of Alaska system on a per unit area basis, with a full system MSY of 3.40 t km −2 compared with 1.96 t km −2 , respectively (Table 1). Results from both systems support previous f<strong>in</strong>d<strong>in</strong>gs that the sum of s<strong>in</strong>gle species yield exceeds total system yield (with s<strong>in</strong>gle species sums of 4.174 and 2.586 t km −2 , respectively). Table 1. ‘True’ F MSY (F, fish<strong>in</strong>g mortality rate; MSY, maximum susta<strong>in</strong>able yield) and MSY with species <strong>in</strong>teractions, for each species and aggregation of the various 10-species simulation models. fl.: flounder; zoopivore: consumes shrimp and other small crustacean prey; P.: Pacific Aggregation Species F MSY MSY ID no(s). (t km –2 ) Georges Bank Species group<strong>in</strong>g Cod 1 0.325 1.069 Haddock 2 0.25 0.877 Yellowtail fl. 3 0.35 0.306 W<strong>in</strong>ter fl. 4 0.375 0.129 W<strong>in</strong>dowpane fl. 5 0.3 0.036 Redfish 6 0.1 0.129 Herr<strong>in</strong>g 7 0.325 0.973 Mackerel 8 0.15 0.124 Skates 9 0.1 0.487 Dogfish 10 0.1 0.044 Full system 1–10 0.275 3.398 Taxonomic aff<strong>in</strong>ity Groundfish 1, 2, 6 0.275 1.924 Flatfish 3–5 0.35 0.470 Forage a 7, 8 0.275 1.015 Elasmobranchs 9, 10 0.1 0.532 Habitat Pelagics a 7, 8 0.275 1.015 Demersals 1–6, 9, 10 0.275 2.383 Feed<strong>in</strong>g functional group Piscivores 1 0.325 1.069 Benthivores 2–5, 9 0.15 1.395 Zoopivores 6, 10 0.1 0.174 Planktivores 7, 8 0.275 1.015 Average adult body length Large 1, 2, 9, 10 0.275 1.925 Medium 3–5 0.35 0.470 Small 6–8 0.25 1.028 Aggregation Species F MSY MSY ID no(s). (t km –2 ) Gulf of Alaska Species group<strong>in</strong>g P. cod 11 0.3 0.234 Sablefish 12 0.1 0.085 Arrowtooth fl. 13 0.125 0.633 P. halibut 14 0.075 0.019 Flathead sole 15 0.15 0.059 P. ocean perch 16 0.05 0.052 Herr<strong>in</strong>g 17 0.35 0.565 Walleye pollock 18 0.325 0.879 Skates 19 0.1 0.045 Dogfish 20 0.05 0.015 Full system 11–20 0.2 1.955 Taxonomic aff<strong>in</strong>ity Groundfish 11, 12, 16 0.15 0.254 Flatfish 13–15 0.125 0.705 Forage a 17, 18 0.325 1.440 Elasmobranchs 19, 20 0.075 0.056 Habitat Pelagics a 17, 18 0.325 1.440 Demersals 11–16, 19, 20 0.125 1.006 Feed<strong>in</strong>g functional group Piscivores 11, 13, 14 0.15 0.809 Benthivores 15, 19 0.125 0.101 Zoopivores 12, 20 0.1 0.093 Planktivores 16–18 0.325 1.440 Average adult body length Large 11, 12, 14, 19, 20 0.125 0.291 Medium 13, 15, 16, 18 0.175 1.299 Small 17 0.35 0.565 a These categories (Forage and Pelagics) conta<strong>in</strong>ed the same species aggregations for their respective locations
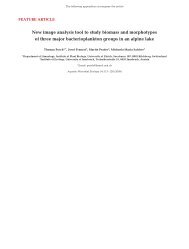
Gaichas et al.: Simulat<strong>in</strong>g aggregate species production 281 Yield (t km –2 ) 3.5 3.0 2.5 2.0 1.5 1.0 0.5 0.0 2.0 1.5 1.0 0.5 0.0 a b Yield Proportion not collapsed 0.0 0.2 0.4 0.6 0.8 1.0 Fish<strong>in</strong>g mortality rate Fig. 2. Full 10-species system aggregate yield and collapse curves (where collapse is def<strong>in</strong>ed as biomass
- Page 1:
THEME SECTION Comparative analysis
- Page 4 and 5:
160 Mar Ecol Prog Ser 459: 159-163,
- Page 6 and 7:
162 Mar Ecol Prog Ser 459: 159-163,
- Page 9 and 10:
Vol. 459: 165-167, 2012 doi: 10.335
- Page 11:
Moksness et al.: Tribute to Bern Me
- Page 14 and 15:
170 Mar Ecol Prog Ser n n incorpora
- Page 16 and 17:
172 Mar Ecol Prog Ser n n Table 1.
- Page 18 and 19:
174 Mar Ecol Prog Ser n n called X-
- Page 20 and 21:
176 Mar Ecol Prog Ser n n BSNS EBS
- Page 22 and 23:
178 Mar Ecol Prog Ser n n Table 2.
- Page 24 and 25:
180 Mar Ecol Prog Ser n n omnivores
- Page 26 and 27:
182 Mar Ecol Prog Ser n n expansion
- Page 28 and 29:
184 Mar Ecol Prog Ser n n Friedland
- Page 30 and 31:
186 Mar Ecol Prog Ser 459: 185-201,
- Page 32 and 33:
188 Mar Ecol Prog Ser 459: 185-201,
- Page 34 and 35:
190 Mar Ecol Prog Ser 459: 185-201,
- Page 36 and 37:
192 Mar Ecol Prog Ser 459: 185-201,
- Page 38 and 39:
194 Mar Ecol Prog Ser 459: 185-201,
- Page 40 and 41:
196 Mar Ecol Prog Ser 459: 185-201,
- Page 42 and 43:
198 Mar Ecol Prog Ser 459: 185-201,
- Page 44 and 45:
200 Mar Ecol Prog Ser 459: 185-201,
- Page 47 and 48:
Vol. 459: 203-218, 2012 doi: 10.335
- Page 49 and 50:
Bundy et al.: Comparative analysis
- Page 51 and 52:
Bundy et al.: Comparative analysis
- Page 53 and 54:
Bundy et al.: Comparative analysis
- Page 55 and 56:
Bundy et al.: Comparative analysis
- Page 57 and 58:
Bundy et al.: Comparative analysis
- Page 59 and 60:
Bundy et al.: Comparative analysis
- Page 61 and 62:
Bundy et al.: Comparative analysis
- Page 63 and 64:
Vol. 459: 219-229, 2012 doi: 10.335
- Page 65 and 66:
Lucey et al.: Aggregate surplus pro
- Page 67 and 68:
Lucey et al.: Aggregate surplus pro
- Page 69 and 70:
Lucey et al.: Aggregate surplus pro
- Page 71 and 72:
Lucey et al.: Aggregate surplus pro
- Page 73: Lucey et al.: Aggregate surplus pro
- Page 76 and 77: 232 Mar Ecol Prog Ser 459: 231-246,
- Page 78 and 79: 234 Mar Ecol Prog Ser 459: 231-246,
- Page 80 and 81: 236 Mar Ecol Prog Ser 459: 231-246,
- Page 82 and 83: 238 Mar Ecol Prog Ser 459: 231-246,
- Page 84 and 85: 240 Mar Ecol Prog Ser 459: 231-246,
- Page 86 and 87: 242 Mar Ecol Prog Ser 459: 231-246,
- Page 88 and 89: 244 Mar Ecol Prog Ser 459: 231-246,
- Page 90 and 91: 246 Mar Ecol Prog Ser 459: 231-246,
- Page 92 and 93: 248 Mar Ecol Prog Ser 459: 247-258,
- Page 94 and 95: 250 Mar Ecol Prog Ser 459: 247-258,
- Page 96 and 97: 252 Mar Ecol Prog Ser 459: 247-258,
- Page 98 and 99: 254 Mar Ecol Prog Ser 459: 247-258,
- Page 100 and 101: 256 Mar Ecol Prog Ser 459: 247-258,
- Page 102 and 103: 258 Mar Ecol Prog Ser 459: 247-258,
- Page 104 and 105: 260 Mar Ecol Prog Ser 459: 259-274,
- Page 106 and 107: 262 Mar Ecol Prog Ser 459: 259-274,
- Page 108 and 109: 264 Mar Ecol Prog Ser 459: 259-274,
- Page 110 and 111: 266 Mar Ecol Prog Ser 459: 259-274,
- Page 112 and 113: 268 Mar Ecol Prog Ser 459: 259-274,
- Page 114 and 115: 270 Mar Ecol Prog Ser 459: 259-274,
- Page 116 and 117: 272 Mar Ecol Prog Ser 459: 259-274,
- Page 118 and 119: 274 Mar Ecol Prog Ser 459: 259-274,
- Page 120 and 121: 276 Mar Ecol Prog Ser 459: 275-292,
- Page 122 and 123: 278 Mar Ecol Prog Ser 459: 275-292,
- Page 126 and 127: 282 Mar Ecol Prog Ser 459: 275-292,
- Page 128 and 129: 284 Mar Ecol Prog Ser 459: 275-292,
- Page 130 and 131: 286 Mar Ecol Prog Ser 459: 275-292,
- Page 132 and 133: 288 Mar Ecol Prog Ser 459: 275-292,
- Page 134 and 135: 290 Mar Ecol Prog Ser 459: 275-292,
- Page 136 and 137: 292 Mar Ecol Prog Ser 459: 275-292,
- Page 138 and 139: 294 Mar Ecol Prog Ser 459: 293-302,
- Page 140 and 141: 296 Mar Ecol Prog Ser 459: 293-302,
- Page 142 and 143: 298 Mar Ecol Prog Ser 459: 293-302,
- Page 144 and 145: 300 Mar Ecol Prog Ser 459: 293-302,
- Page 146: 302 Mar Ecol Prog Ser 459: 293-302,