Complete Theme Section in pdf format - Inter Research
Complete Theme Section in pdf format - Inter Research
Complete Theme Section in pdf format - Inter Research

You also want an ePaper? Increase the reach of your titles
YUMPU automatically turns print PDFs into web optimized ePapers that Google loves.
Fu et al.: Relat<strong>in</strong>g ecosystem <strong>in</strong>dicators to drivers<br />
177<br />
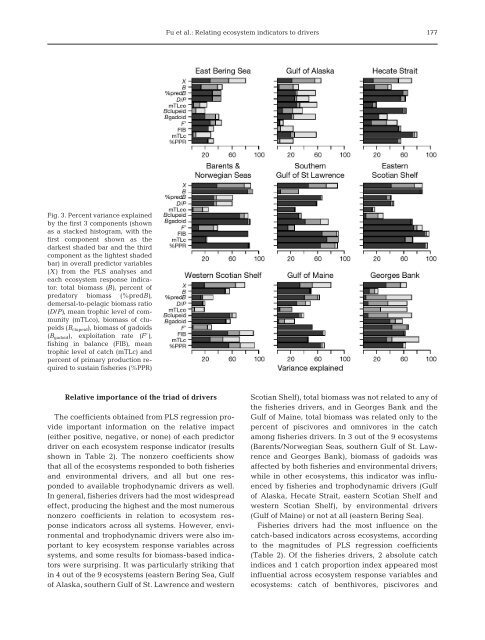
Fig. 3. Percent variance expla<strong>in</strong>ed<br />
by the first 3 components (shown<br />
as a stacked histogram, with the<br />
first component shown as the<br />
darkest shaded bar and the third<br />
component as the lightest shaded<br />
bar) <strong>in</strong> overall predictor variables<br />
(X) from the PLS analyses and<br />
each ecosystem response <strong>in</strong>dicator:<br />
total biomass (B), percent of<br />
predatory biomass (%predB),<br />
demersal-to-pelagic bio mass ratio<br />
(D/P), mean trophic level of community<br />
(mTLco), biomass of clupeids<br />
(B clupeid ), biomass of gadoids<br />
(B gadoid ), exploitation rate (F’),<br />
fish<strong>in</strong>g <strong>in</strong> balance (FIB), mean<br />
trophic level of catch (mTLc) and<br />
percent of primary production required<br />
to susta<strong>in</strong> fisheries (%PPR)<br />
Relative importance of the triad of drivers<br />
The coefficients obta<strong>in</strong>ed from PLS regression provide<br />
important <strong>in</strong><strong>format</strong>ion on the relative impact<br />
(either positive, negative, or none) of each predictor<br />
driver on each ecosystem response <strong>in</strong>dicator (results<br />
shown <strong>in</strong> Table 2). The nonzero coefficients show<br />
that all of the ecosystems responded to both fisheries<br />
and environmental drivers, and all but one res -<br />
ponded to available trophodynamic drivers as well.<br />
In general, fisheries drivers had the most widespread<br />
effect, produc<strong>in</strong>g the highest and the most numerous<br />
nonzero coefficients <strong>in</strong> relation to ecosystem res -<br />
ponse <strong>in</strong>dicators across all systems. However, environmental<br />
and trophodynamic drivers were also im -<br />
portant to key ecosystem response variables across<br />
systems, and some results for biomass-based <strong>in</strong>dicators<br />
were surpris<strong>in</strong>g. It was particularly strik<strong>in</strong>g that<br />
<strong>in</strong> 4 out of the 9 ecosystems (eastern Ber<strong>in</strong>g Sea, Gulf<br />
of Alaska, southern Gulf of St. Lawrence and western<br />
Scotian Shelf), total biomass was not related to any of<br />
the fisheries drivers, and <strong>in</strong> Georges Bank and the<br />
Gulf of Ma<strong>in</strong>e, total biomass was related only to the<br />
percent of piscivores and omnivores <strong>in</strong> the catch<br />
among fisheries drivers. In 3 out of the 9 ecosystems<br />
(Barents/ Norwegian Seas, southern Gulf of St. Law -<br />
rence and Georges Bank), biomass of gadoids was<br />
affected by both fisheries and environmental drivers;<br />
while <strong>in</strong> other ecosystems, this <strong>in</strong>dicator was <strong>in</strong>fluenced<br />
by fisheries and trophodynamic drivers (Gulf<br />
of Alaska, Hecate Strait, eastern Scotian Shelf and<br />
western Scotian Shelf), by environmental drivers<br />
(Gulf of Ma<strong>in</strong>e) or not at all (eastern Ber<strong>in</strong>g Sea).<br />
Fisheries drivers had the most <strong>in</strong>fluence on the<br />
catch-based <strong>in</strong>dicators across ecosystems, accord<strong>in</strong>g<br />
to the magnitudes of PLS regression coefficients<br />
(Table 2). Of the fisheries drivers, 2 absolute catch<br />
<strong>in</strong>dices and 1 catch proportion <strong>in</strong>dex appeared most<br />
<strong>in</strong>fluential across ecosystem response variables and<br />
ecosystems: catch of benthivores, piscivores and