Complete Theme Section in pdf format - Inter Research
Complete Theme Section in pdf format - Inter Research
Complete Theme Section in pdf format - Inter Research

You also want an ePaper? Increase the reach of your titles
YUMPU automatically turns print PDFs into web optimized ePapers that Google loves.
250<br />
Mar Ecol Prog Ser 459: 247–258, 2012<br />
ta<strong>in</strong><strong>in</strong>g target levels of spawn<strong>in</strong>g stock biomass and<br />
specify<strong>in</strong>g correspond<strong>in</strong>g fish<strong>in</strong>g mortality rates<br />
us<strong>in</strong>g spawn<strong>in</strong>g-biomass-per-recruit analyses. For<br />
<strong>in</strong>dex-based assessments, we expanded survey<br />
catch-per-tow estimates to total biomass us<strong>in</strong>g the<br />
area-swept and survey catchability approach de -<br />
scribed above. Once placed on an absolute scale,<br />
these reference po<strong>in</strong>ts could then be compared with<br />
the production model results. Aga<strong>in</strong>, because the<br />
basis for select<strong>in</strong>g and estimat<strong>in</strong>g reference levels<br />
differed markedly from the production model ap -<br />
proach, the GARM results are <strong>in</strong>tended only to provide<br />
a general po<strong>in</strong>t of comparison and to test for<br />
concordance and directionality of overall results.<br />
Environmental effects<br />
We exam<strong>in</strong>ed the potential effect of environmental<br />
or climate-related factors on surplus production <strong>in</strong> this<br />
system. The covariates used were the Atlantic Multidecadal<br />
Oscillation (AMO) <strong>in</strong>dex, the w<strong>in</strong>ter (December<br />
to February) North Atlantic Oscillation (NAO)<br />
<strong>in</strong>dex, and the Extended Reconstructed Sea Surface<br />
Temperature (ERSST) <strong>in</strong>dex for the Northeastern US.<br />
Both the NAO and AMO are bas<strong>in</strong>-wide <strong>in</strong>dicators.<br />
The AMO <strong>in</strong>dex is based on spatial patterns <strong>in</strong> SST<br />
variability after remov<strong>in</strong>g the effects of anthropogenic<br />
forc<strong>in</strong>g on temperature (Enfield et al. 2001). The NAO<br />
is the dom<strong>in</strong>ant mode of climate variability over the<br />
North Atlantic Bas<strong>in</strong> (Hurrell 1995) and is known to<br />
exert important ecosystem effects (Stenseth et al.<br />
2002). The broad-scale ERSST series is based on a<br />
comprehensive analysis of long-term temperature<br />
records obta<strong>in</strong>ed from ships-of-opportunity (Smith &<br />
Reynolds 2003, 2004). In each case, we converted the<br />
observations to standard normal deviates with 0 mean<br />
and unit standard deviation.<br />
To exam<strong>in</strong>e candidate lags to be <strong>in</strong>cluded <strong>in</strong> the<br />
analysis, we first exam<strong>in</strong>ed the cross-correlation<br />
structure (Box & Jenk<strong>in</strong>s 1976) for ASP and each of<br />
the environmental covariates. Follow<strong>in</strong>g identification<br />
of candidate environmental variables and lags,<br />
we <strong>in</strong>corporated these metrics <strong>in</strong> an extended production<br />
model:<br />
∑ δ jX<br />
jt , −τ<br />
j=<br />
1<br />
ASP = ( α−βB<br />
) B e + e<br />
t t t<br />
where δ j is a coefficient for the effect of the jth covariate,<br />
X j,t-τ is the value of covariate j at lag τ , and all<br />
other terms are def<strong>in</strong>ed as before. All candidate models<br />
were compared us<strong>in</strong>g the Akaike In<strong>format</strong>ion Criterion<br />
(AIC; Akaike 1992) to test whether the fit with<br />
environmental covariates performed better than the<br />
base case (Eq. 2). We used the corrected AIC c to<br />
adjust for sample size effects:<br />
2KK<br />
( + 1)<br />
AIC c =− 2log e ( L)<br />
+<br />
(7)<br />
n−K<br />
−1<br />
where L is the likelihood estimate, K is the number of<br />
parameters estimated, and n is the number of observations<br />
(Burnham & Anderson 1998).<br />
m<br />
t<br />
(6)<br />
RESULTS<br />
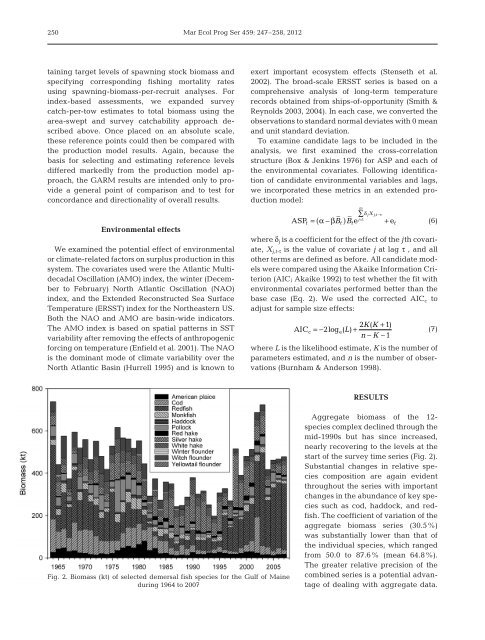
Fig. 2. Biomass (kt) of selected demersal fish species for the Gulf of Ma<strong>in</strong>e<br />
dur<strong>in</strong>g 1964 to 2007<br />
Aggregate biomass of the 12-<br />
species complex de cl<strong>in</strong>ed through the<br />
mid-1990s but has s<strong>in</strong>ce <strong>in</strong> creased,<br />
nearly recover<strong>in</strong>g to the levels at the<br />
start of the survey time series (Fig. 2).<br />
Substantial changes <strong>in</strong> relative species<br />
composition are aga<strong>in</strong> evident<br />
throughout the series with important<br />
changes <strong>in</strong> the abundance of key species<br />
such as cod, haddock, and redfish.<br />
The coefficient of variation of the<br />
aggregate biomass series (30.5%)<br />
was substantially lower than that of<br />
the <strong>in</strong>dividual species, which ranged<br />
from 50.0 to 87.6% (mean 64.8%).<br />
The greater relative precision of the<br />
comb<strong>in</strong>ed series is a potential advantage<br />
of deal<strong>in</strong>g with aggregate data.