
Create successful ePaper yourself
Turn your PDF publications into a flip-book with our unique Google optimized e-Paper software.
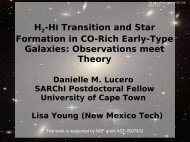
<strong>Molecular</strong> <strong>Gas</strong> <strong>at</strong><br />
<strong>High</strong> <strong>Redshift</strong><br />
Fabian Walter (MPIA)<br />
w/<br />
Bertoldi, Carilli, Daddi, Da Cunha, Decarli,<br />
Hodge, Maiolino, Riechers, Sargent,<br />
Venemans, Wagg, Wang,Weiss
history of the universe<br />
theoretical framework<br />
big bang<br />
recombin<strong>at</strong>ion<br />
z~1000<br />
0.0003 Gyr<br />
Hydrodynamical simul<strong>at</strong>ions of cosmological structure form<strong>at</strong>ion<br />
‘dark ages’<br />
reioniz<strong>at</strong>ion<br />
quasar/galaxy<br />
build-up<br />
z~15-1000<br />
0.0003-0.3 Gyr<br />
z~8-15<br />
0.3-1 Gyr<br />
z1 Gyr<br />
z=100<br />
time<br />
z=10<br />
z=1<br />
e.g. GADGET, AREPO, Springel et al.<br />
today’s<br />
universe<br />
z~0<br />
14.3 Gyr<br />
Galaxy growth through gas accretion...<br />
...but this gas supply is currently largely unconstrained<br />
observ<strong>at</strong>ionally
Ω(SFR) [Msun yr -1 Mpc -3 ]<br />
Research in last decade - Cosmic Evolution of the cosmic star form<strong>at</strong>ion r<strong>at</strong>e density<br />
t(Gyr)<br />
Deep fields: 100s hours,
Ω(SFR) [Msun yr -1 Mpc -3 ]<br />
Research in last decade - Cosmic Evolution of the cosmic star form<strong>at</strong>ion r<strong>at</strong>e density<br />
t(Gyr)<br />
Deep fields: 100s hours,
A typical dusty high-redshift SED<br />
JWST<br />
SPICA<br />
ALMA+CCAT<br />
EVLA<br />
CNO fine structure lines<br />
CO ‘ladder’<br />
PAHs + SiO<br />
Thermal<br />
dust(young stars)!
frequency [GHz]<br />
practical issues<br />
CO transitions as function of redshift, f(T, ρ)<br />
redshift
frequency [GHz]<br />
practical issues<br />
CO transitions as function of redshift, f(T, ρ)<br />
PdBI/ALMA<br />
submm band<br />
PdBI/ALMA<br />
1mm band<br />
significant coverage in frequency space<br />
PdBI 2mm band<br />
PdBI/ALMA 3mm band<br />
frequency [GHz]<br />
practical issues<br />
CO transitions as function of redshift, f(T, ρ)<br />
PdBI/ALMA<br />
submm band<br />
PdBI/ALMA<br />
1mm band<br />
significant coverage in frequency space<br />
PdBI 2mm band<br />
PdBI/ALMA 3mm band<br />
<strong>at</strong> high redshift: can only detect high-J CO<br />
transitions<br />
Mgas (fuel for SF, evol. st<strong>at</strong>e, tdep)<br />
Excit<strong>at</strong>ion => ngas , Tkin (phys. conditions for SF)<br />
Imaging => Σgas ,Mdyn (sys. potential => Mtot)
high redshift gas supply<br />
- CO is best (but by no means perfect) tracer<br />
for molecular gas, H2<br />
so far: individual studies, mostly<br />
QSO: host galaxies of accreting Black Holes<br />
SMGs: highly SF galaxies } SFR ≥1000 Msun yr -1
Carilli & Walter, in prep.<br />
high redshift gas supply<br />
- CO is best (but by no means perfect) tracer<br />
for molecular gas, H2<br />
so far: individual studies, mostly<br />
QSO: host galaxies of accreting Black Holes<br />
SMGs: highly SF galaxies<br />
detection limit:<br />
~10 10-11 Msun
CO now ‘routinely’ detected in z=6 QSOs<br />
z=6: age of universe less than 1 Gyr.<br />
presence of CO(6-5) implies major enrichment in quasar host galaxies<br />
Wang et al 2010
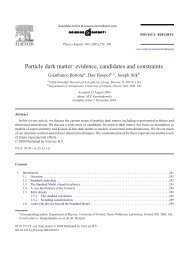
integr<strong>at</strong>ed CO emission<br />
CO velocity field<br />
Fig. 6.— CO(2–1) 0th (top) and 1st (bottom) moment maps for<br />
GN20 <strong>at</strong> intermedi<strong>at</strong>e resolution (0.19 ′′ ). The 0th moment map<br />
(i.e. integr<strong>at</strong>ed intensity) shows contours starting <strong>at</strong> (and in steps<br />
of) 594 µJy km s −1 .The1stmomentmap(i.e.,intensity–weighted<br />
CO emission can be sp<strong>at</strong>ially resolved<br />
<strong>Molecular</strong> <strong>Gas</strong> in GN20 7<br />
ity, bottom), which shows a zoomed–in region of the 0th<br />
moment map. Although some noise is still present in the<br />
outskirts, a clear velocity gradient is apparent across the<br />
disk.<br />
Bright z=4 submillimeter galaxy GN20<br />
4.2.2. Dynamical Modeling<br />
1kpc resolution <strong>at</strong> z=4!<br />
For the dynamical modeling of GN20, we used the<br />
GALMOD task (part of the GIPSY package). We used<br />
an input d<strong>at</strong>a cube with a spectral resolution of 26 km<br />
s −1 ,andwetaperedthed<strong>at</strong><strong>at</strong>oanangularresolutionof<br />
0.77 ′′ as it was found th<strong>at</strong> higher resolutions resolved out<br />
too much flux to be usable for modeling. The GALMOD<br />
task requires a radial profile as input, which (guided by<br />
the 0th moment map) we set as an exponential radial<br />
profile with a slope of –0.4. We used a thin disk model<br />
and we found th<strong>at</strong> changes in the thickness of the disk<br />
(within a reasonable range, < few kpc) did not result in<br />
major changes to the model.<br />
While the 8 resolution of the d<strong>at</strong>a make it difficult to<br />
constrain the exact shape of the rot<strong>at</strong>ion curve, we find<br />
th<strong>at</strong> the velocity field is fully consistent with a rot<strong>at</strong>ing<br />
disk with a steeply–rising rot<strong>at</strong>ion curve th<strong>at</strong> quickly<br />
fl<strong>at</strong>tens. By comparing different models to the d<strong>at</strong>a, we<br />
found th<strong>at</strong> the best–fit model (Figure 7) was a rot<strong>at</strong>ing<br />
disk with an inclin<strong>at</strong>ion of i =30 ◦ ± 15 ◦ ,amaximum<br />
rot<strong>at</strong>ional velocity of v max =575± 100 km s −1 ,anda<br />
dispersion of δ =100± 30 km s −1 . Note th<strong>at</strong> deriving<br />
the dispersion from a sp<strong>at</strong>ially and spectrally convolved<br />
disk model, unlike other mean–weighted dispersion estim<strong>at</strong>ors,<br />
is unbiased by beam smearing(Daviesetal.<br />
2011).<br />
The rel<strong>at</strong>ively large value of v max is due to the fairly<br />
low value found for the inclin<strong>at</strong>ion; while v max ×sin(i)<br />
is well constrained, the two are difficult to disentangle<br />
<strong>at</strong> our angular resolution. The final inclin<strong>at</strong>ion value of<br />
30 ◦ was chosen to reproduce the resulting ellipticity in<br />
the 0th moment map, but we cannot definitively rule<br />
Fig. 7.— Major axis position–velocity diagram for CO(2–1) in<br />
out largerGN20, values taken of the <strong>at</strong> a inclin<strong>at</strong>ion position angle(within of 25 ◦ . The the velocities quoted on the<br />
error), andvertical therefore axis are lower rel<strong>at</strong>ive. values Greyscale of v max and thin . The countours uncertainty<br />
quoted for v max folds in the uncertainty in the<br />
show the<br />
observed d<strong>at</strong>a, and thick contours show the best fit model (see text<br />
for details).<br />
inclin<strong>at</strong>ion.<br />
The blanking on higher–J process transition allows us lines; to recover Daddi et more al. 2009b; of theCarilli<br />
diffuse emission et al. 2010). from GN20, We will and usethis, thisin estim<strong>at</strong>e turn, leads to setto limits a on<br />
larger disk. From the 0th moment map, we estim<strong>at</strong>e a ra-<br />
Reveals clumpy rot<strong>at</strong>ing molecular gas<br />
disk: evidence for cold mode accretion?<br />
but: expensive.... ~100 hours with JVLA<br />
ignored the contribution from d<br />
make up only a tiny fraction of<br />
M ⊙ ;Magdisetal.2011).Weha<br />
tribution from dark m<strong>at</strong>ter, wh<br />
even further. Including 15% da<br />
observ<strong>at</strong>ion th<strong>at</strong> the dark m<strong>at</strong>ter<br />
ies is 10–20% (Genzel et al. 2008<br />
upper limit on the conversion f<br />
M ⊙ (K km s −1 pc 2 ) −1 . A conv<br />
M ⊙ (K km s −1 pc 2 ) −1 as seen<br />
(Daddi et al. 2010; Tacconi et a<br />
likely as well. Our constraints o<br />
the limit α < 1.0 derived using t<br />
metallicity rel<strong>at</strong>ion (Magdis et a<br />
Note th<strong>at</strong> the l<strong>at</strong>ter case resul<br />
m<strong>at</strong>e of 2.3 × 10 11 M ⊙ .Thisalso<br />
derived by Daddi et al. (2009b)<br />
the ACS through IRAC photome<br />
ing a Chabrier (2003) IMF. Thi<br />
uncertainties associ<strong>at</strong>ed with st<br />
SMGs, but the agreement is inte<br />
look <strong>at</strong> this multiwavelength da<br />
for GN20, in the next section.<br />
Hodge et al. 2012<br />
4.3. Multiwavelength
Other tracers: Atomic Carbon (CI)<br />
CI(2-1)[809GHz] and CI(1-0)[492GHz]<br />
independent constraints on Tex needed for LVG<br />
modeling<br />
SMG<br />
QSO<br />
SMG<br />
QSO<br />
Walter et al. 2012<br />
L CI(1-0) /L CO(3-2)<br />
L CI(2-1) /L CI(1-0)<br />
L CI(1-0) /L FIR<br />
L FIR
Other tracers <strong>at</strong> high density<br />
HCN 1-0<br />
HCO + 1-0<br />
CN 3-2 CS 3-2<br />
z=2.6<br />
VLA<br />
• n cr > 1e5 cm -3 - 100x denser than CO, ~ GMC cores<br />
• Dense gas lines 10-30x less luminous than CO<br />
• line r<strong>at</strong>ios similar to local ULIRGs, e.g., Arp 220<br />
⇒ No significant ‘chemical evolution’ of mol. ISM?<br />
z=4<br />
HCN&HCO + 6-5 HNC 6-5<br />
Solomon ea. 2003<br />
Riechers ea., 2007a, 2009<br />
Garcia-Burillo ea 2008
CO ladder -- tedious observ<strong>at</strong>ions...<br />
IRAM 30m CO SED survey<br />
(1, 2, 3mm bands)<br />
Weiss et al. 2013
Lensing helps<br />
The Eyelash<br />
CO(1-0) CO(3-2) CO(4-3) CO(5-4)<br />
CO(6-5) CO(7-6) CO(8-7) CO(9-8) CO(10-9)<br />
CI(1-0) CI(2-1) HCN(3-2)<br />
Swinbank et al. 2011, Danielson et al. 2011
Low-J observ<strong>at</strong>ions in the cm regime: need large collecting are<br />
APM08279 (z=3.9)<br />
PSS J2322 (z=4.1)<br />
GBT<br />
Effelsberg<br />
+<br />
Riechers et al. 2006
Low-J observ<strong>at</strong>ions: JVLA -- merger sequence in SMGs?<br />
Submillimeter Galaxies<br />
Early stage<br />
~30kpc & 750km/s<br />
separ<strong>at</strong>ion<br />
Intermedi<strong>at</strong>e stage<br />
~20kpc & 2-4 SMGs show complex, extended, low-excit<strong>at</strong>ion gas reservoirs<br />
typically 10kpc, with FIR continuum sizes of 2-4kpc (starburst regions)<br />
Riechers et al. 2011, Ivison et al. 2011
CO excit<strong>at</strong>ion: putting it all together:<br />
Cloverleaf F10214 APM0827<br />
J11148<br />
BR1202<br />
PSS1409 MG0751 RXJ0911<br />
SMM14011<br />
SMM16359B<br />
HR10<br />
SMM04431<br />
SMM123549 SMM163650 SMM163658<br />
Weiss et al. 2013
CO excit<strong>at</strong>ion: <strong>High</strong> <strong>Redshift</strong><br />
T kin ~ 200 K (T dust ~ 200 K)<br />
n(H 2 ) ~ 10 4.2 cm -3<br />
Strongly lensed (m=80-100) central ~200pc<br />
surrounding the QSO. AGN he<strong>at</strong>ing!<br />
T kin ~40 – 60 K (T dust ~ 50 K)<br />
n(H 2 ) ~ 10 3.6-4.3 cm -3<br />
T kin ~ 30-50 K (T dust ~ 30-50 K)<br />
n(H 2 ) ~ 10 2.7-3.5 cm -3<br />
Weiss et al. 2013
CO excit<strong>at</strong>ion: Low <strong>Redshift</strong><br />
T kin ~ 200 K (T dust ~ 200 K)<br />
n(H 2 ) ~ 10 4.2 cm -3<br />
Strongly lensed (m=80-100) central ~200pc<br />
surrounding the QSO. AGN he<strong>at</strong>ing!<br />
T kin ~40 – 60 K (T dust ~ 50 K)<br />
n(H 2 ) ~ 10 3.6-4.3 cm -3<br />
T kin ~ 30-50 K (T dust ~ 30-50 K)<br />
n(H 2 ) ~ 10 2.7-3.5 cm -3<br />
Weiss et al. 2013
Evolutionary Sequence?<br />
L FIR , SFR, n(H 2 )<br />
M51 Antennae Arp220 Mrk 231<br />
r CO ~ 4kpc r CO ~ 1.5kpc r CO ~ 500 pc r CO ~200 pc
FIR vs. CO luminosity<br />
N=1.4<br />
FIR luminosity (~SFR)<br />
CO Luminosity (~gas mass)<br />
Riechers et al.
FIR vs. CO luminosity<br />
N=1.4<br />
Kennicutt’s<br />
98 d<strong>at</strong>a<br />
FIR luminosity (~SFR)<br />
high-z Quasars/<br />
submillimeter galaxies<br />
CO Luminosity (~gas mass)<br />
Riechers et al.
2008-2010: Detection of ‘normal’ star forming galaxies<br />
optical/NIR selected galaxies (BzK), SFR few 100<br />
Msun yr -1 are very rich in molecular gas<br />
<strong>Molecular</strong> conversion factor: Galactic<br />
gas fractions: f gas =0.5-0.7<br />
BzK-21000<br />
Milky Way<br />
Daddi et al 2008/2010, Tacconi 2010<br />
Dannerbauer et al. 2009
Loc<strong>at</strong>ion of BzK galxies in ‘SF law’ plot<br />
note: this plot: observables only<br />
- BzKs have significantly less L IR for given L CO<br />
Daddi et al. 2010
Loc<strong>at</strong>ion of BzK galxies in ‘SF law’ plot<br />
note: this plot: observables only<br />
- BzKs have significantly less L IR for given L CO<br />
Daddi et al. 2010
Going from luminosities to masses<br />
FIR luminosity (~SFR)<br />
two sequences:<br />
disks & starbursts<br />
N=1.3<br />
gas mass<br />
Daddi et al. 2010<br />
Genzel et al. 2010
Star Form<strong>at</strong>ion Efficiencies a.k.a. Depletion Times<br />
gas good<br />
<strong>at</strong> forming<br />
stars<br />
immedi<strong>at</strong>e<br />
implic<strong>at</strong>ion:<br />
gas depletion times<br />
long for BzKs<br />
(sim. to spirals)<br />
gas bad<br />
<strong>at</strong> forming<br />
stars<br />
Daddi et al. 2010
log (SFR surface density)<br />
high redshift gas supply<br />
rel<strong>at</strong>ion between gas and star form<strong>at</strong>ion is complex<br />
high-z galaxies<br />
local galaxies<br />
Daddi, et al., 2010, Genzel et al. 2010<br />
log (molecular gas surface density)
log (SFR surface density)<br />
high redshift gas supply<br />
rel<strong>at</strong>ion between gas and star form<strong>at</strong>ion is complex<br />
Ω(SFR) [Msun yr -1 Mpc -3 ]<br />
?<br />
high-z galaxies<br />
+ =<br />
local galaxies ?<br />
Ω(Mmol) [Msun Mpc -3 ]<br />
10 8<br />
10 7<br />
Ω(mol) [Msun Mpc -3 ]<br />
0 1 2 3<br />
redshift<br />
log (molecular gas surface density)<br />
→ not trivial to predict Ω(Mmol) from Ω(SFR)<br />
[talk by Mark Sargent]<br />
solution: unbiased census of molecular gas, the fuel for star form<strong>at</strong>ion<br />
i.e. a molecular deep field (<strong>at</strong> the same time: continuum deep field)
frequency [GHz]<br />
molecular deep field: approach<br />
CO transitions as function of redshift, f(T, ρ)<br />
PdBI/ALMA<br />
submm band<br />
PdBI/ALMA<br />
1mm band<br />
PdBI 2mm band<br />
PdBI/ALMA 3mm band<br />
this is now possible given wide bandwidths<br />
of current and upcoming facilities<br />
BzK selection<br />
ALMA deep field: predicted properties of UDF galaxies<br />
continuum: observed UV/optical SEDs → SED models (Da Cunha) → dust<br />
luminosity (from <strong>at</strong>tenu<strong>at</strong>ion in UV) → FIR luminosity → ALMA flux densities<br />
lines: LFIR → LCO (Daddi et al., Genzel et al.), assuming range of CO excit<strong>at</strong>ions MW⟷M82)<br />
Band 6<br />
Band 7<br />
Band 3<br />
Whole sample (13,099 galaxies)<br />
0.0 ≤ z < 1.5 (5,660 galaxies)<br />
1.5 ≤ z < 2.5 (4,286 galaxies)<br />
2.5 ≤ z < 5.0 (3,153 galaxies)
Full ALMA<br />
total ~300 hours<br />
FOV = 26 arcsec<br />
6.2 hours/pointing<br />
rms = 5.1 microJy<br />
>600 detections<br />
predicted properties of UDF galaxies: example: band 6 continuum<br />
actual observ<strong>at</strong>ions can be<br />
immedi<strong>at</strong>ely compared to<br />
these expect<strong>at</strong>ions!<br />
ALMA detected<br />
x 10
full ALMA, full UDF<br />
full ALMA, full UDF<br />
Full ALMA<br />
total ~300 hours<br />
FOV = 26 arcsec<br />
6.2 hours/pointing<br />
rms = 5.1 microJy<br />
>600 detections<br />
predicted properties of UDF galaxies: example: band 6 continuum<br />
actual observ<strong>at</strong>ions can be<br />
immedi<strong>at</strong>ely compared to<br />
these expect<strong>at</strong>ions!<br />
ALMA detected<br />
x 10<br />
e.g. comparison<br />
to Obreschkow et al.<br />
Lagos et al., Sargent<br />
et al.<br />
observed CO luminosities: comparisons to models<br />
talk by Mark Sargent<br />
z=0 z=1<br />
z=2<br />
Sargent et al. 2012
predictions by numerical simul<strong>at</strong>ions<br />
z~1<br />
AREPO (Springel et al., Vogelsberger et al.):<br />
distribution of molecular gas <strong>at</strong> z~1, 2 and 3<br />
z~2<br />
z~3<br />
size: 1’x1’ ~ ALMA band 3 primary beam size<br />
can immedi<strong>at</strong>ely compare observ<strong>at</strong>ions to<br />
simul<strong>at</strong>ions
frequency [GHz]<br />
first molecular deep field with PdBI: HDF<br />
covered full 3mm band in 10 frequency settings (2011-2012)<br />
3mm band: low-J coverage, highest fractional BW, largest PB<br />
CO redshift coverage<br />
PdBI 3mm band<br />
PdBI<br />
primary<br />
beam<br />
redshift<br />
almost complete redshift coverage
frequency [GHz]<br />
first molecular deep field with PdBI: HDF<br />
covered full 3mm band in 10 frequency settings (2011-2012)<br />
3mm band: low-J coverage, highest fractional BW, largest PB<br />
CO redshift coverage<br />
PdBI 3mm band<br />
PdBI<br />
primary<br />
beam<br />
redshift<br />
almost complete redshift coverage<br />
this field included HDF850.1<br />
Hughes et al. 1998
spectrum <strong>at</strong> position of HDF850.1<br />
The Case of HDF850.1
spectrum <strong>at</strong> position of HDF850.1<br />
The Case of HDF850.1
The Case of HDF850.1<br />
spectrum <strong>at</strong> position of HDF850.1<br />
This nails the redshift to z=5.183!<br />
Walter et al. 2012
The Case of HDF850.1<br />
spectrum <strong>at</strong> position of HDF850.1<br />
This nails the redshift to z=5.183!<br />
Walter et al. 2012
The Case of HDF850.1<br />
spectrum <strong>at</strong> position of HDF850.1<br />
precise loc<strong>at</strong>ion and redshift: no counterpart<br />
identifiable in deepest HST observ<strong>at</strong>ions<br />
HDF850.1<br />
[CII] contours on I−band<br />
red/blue−shifted [CII]<br />
on J−band<br />
however source is loc<strong>at</strong>ed in galaxy overdensity<br />
<strong>at</strong> z=5.2, including one quasar!<br />
This nails the redshift to z=5.183!<br />
Walter et al. 2012
lind detection of other sources:<br />
example:<br />
2nd CO line confirms z=1.76
lind detection of other sources:<br />
example:<br />
2nd CO line confirms z=1.76<br />
volume probed for CO(2-1)<br />
line from z=1.0-1.8 (=1.4)<br />
first blind constraints on Ω(Mmol)<br />
Sargent et al. (2012)<br />
Obreschkow et al. (2009a,b)<br />
=1.4<br />
Ω(Mmol) [Msun Mpc -3 ]<br />
10 8<br />
Sargent et al. (2012)<br />
Obreschkow et al. (2009a,b)<br />
α = 4.4<br />
PdBI deep field<br />
α = 0.8<br />
10 7 redshift<br />
0<br />
1 2<br />
3
going to the highest redshifts, z>>5<br />
will we loose CO as our main tracer?<br />
problem I: conversion factor <strong>at</strong> low metallicities?<br />
problem II: the CMB is not our friend<br />
Tex = 18 K<br />
LOBSERVED / LINTRINSIC<br />
0 2 4 6 8 10<br />
redshift<br />
da Cunha et al. 2012
going to the highest redshifts, z>>5<br />
will we loose CO as our main tracer?<br />
problem I: conversion factor <strong>at</strong> low metallicities?<br />
problem II: the CMB is not our friend<br />
Tex = 18 K<br />
Tex = 40 K<br />
LOBSERVED / LINTRINSIC<br />
LOBSERVED / LINTRINSIC<br />
0 2 4 6 8 10<br />
redshift<br />
0 2 4 6 8 10<br />
redshift<br />
da Cunha et al. 2012
CO line redshift coverage for ALMA and JVLA
CO line redshift coverage for ALMA and JVLA<br />
QSO
CO line redshift coverage for ALMA and JVLA<br />
SMG QSO
CO line redshift coverage for ALMA and JVLA<br />
BzK SMG QSO<br />
CO NOT EXCITED
going to the highest redshifts<br />
BzK SMG QSO<br />
CO NOT EXCITED<br />
[CII]
[CII] to the rescue?<br />
LMC<br />
may be easier to detect<br />
fainter, low metallicity<br />
sources?<br />
1+ order of mag<br />
z>4<br />
• [CII] is bright<br />
• [CII] is not easily interpretable,<br />
traces ionized and neutral gas<br />
Maiolino et al. 2009 [upd<strong>at</strong>ed]
Local [CII] calibr<strong>at</strong>ions ongoing...<br />
[CII] [NII] [OI] [OIII]<br />
e.g., KINGFISH project<br />
(Smith et al., Bol<strong>at</strong>to et al.)
Maximum Starburst <strong>at</strong> z=6.4 - resolved [CII] emission<br />
Walter ea. 2009<br />
1”<br />
PdBI – 0.25” res<br />
FIR continuum<br />
[CII]<br />
• [CII] size ~ 1.5 kpc => SFR/area ~ 1000 M o yr -1 kpc -2<br />
• Maximal starburst: (Thompson et al. 2005)<br />
Ø Self-gravit<strong>at</strong>ing gas disk, Vertical support: radi<strong>at</strong>ion pressure
quick poll!<br />
SFRSD=1000 M sun yr -1 kpc -2 !!??<br />
Comparison to star form<strong>at</strong>ion r<strong>at</strong>e<br />
surface density in Orion?!<br />
SFRSD J1148 =1000 M sun yr -1 kpc -2<br />
A) SFRSD Orion = 10 -6 x SFRSD J1148<br />
B) = 10 -3 x SFRSD J1148<br />
C) = 1 x SFRSD J1148
quick poll!<br />
SFRSD=1000 M sun yr -1 kpc -2 !!??<br />
Comparison to star form<strong>at</strong>ion r<strong>at</strong>e<br />
surface density in Orion??<br />
SFRSD J1148 =1000 M sun yr -1 kpc -2<br />
✖<br />
✖<br />
✔<br />
A) SFRSD Orion = 10 -6 x SFRSD J1148<br />
B) = 10 -3 x SFRSD J1148<br />
C) = 1 x SFRSD J1148
Walter et al. 2012<br />
Search for [CII] in z>6.5 Lyman Alpha Emitters (and one z~8 GRB host)<br />
Small survey <strong>at</strong> PdBI to detect [CII] <strong>at</strong> z>6.5: unsuccessful
[CII] now detected out to z=7.1(!)<br />
Only one quasar known <strong>at</strong> z>7 (Mortlock et al. 2011)<br />
Bright detection in [CII] -- source visible from ALMA<br />
Venemans et al. 2012
ALMA: An SMG-Quasar pair <strong>at</strong> z=4.7<br />
BRI 1202: [CII]<br />
dram<strong>at</strong>ic S/N in 0.5 hours w/ 16<br />
antennae Wagg et al. 2012<br />
Carilli et al. 2012
First serendipitous ALMA [CII] detections<br />
ALMA always covers 8GHz of bandwidth -- we looked <strong>at</strong> ~100 SMGs in ECDFS<br />
Two show evidence for line<br />
emission - most likely [CII]<br />
<strong>at</strong> z~4.4<br />
Swinbank et al. 2013
[NII] as a tracer of ionized medium <strong>at</strong> high redshift<br />
[NII] in strongly lensed source <strong>at</strong> z=4 (MM18423) (Lestrade et al. 2010)<br />
FIR continuum<br />
[NII] line<br />
resolved star form<strong>at</strong>ion law<br />
<strong>at</strong> high redshift!<br />
[NII] red/blue-shifted<br />
Jansky Array CO<br />
Decarli, FW et al. 2012
Summary / Conclusions<br />
- the future is now<br />
- CO remains best direct tracer of<br />
molecular gas mass <strong>at</strong> intermedi<strong>at</strong>e z<br />
Hubble UDF<br />
ALMA simul<strong>at</strong>ions<br />
- excit<strong>at</strong>ion critical to derive masses etc.<br />
- may loose CO <strong>at</strong> highest redshifts (CMB)...<br />
→ fine structure lines<br />
ALMA<br />
ALMA<br />
- so far: all detections in systems w/ SFR > 100 Msun yr -1<br />
- soon: unbiased blind deep fields with ALMA<br />
- ultim<strong>at</strong>e goal: constraints on ΩCO(z) and thus ~Ωmol(z)
THE END