Annual Report 2011
Annual Report 2011
Annual Report 2011

You also want an ePaper? Increase the reach of your titles
YUMPU automatically turns print PDFs into web optimized ePapers that Google loves.
14<br />
<strong>Report</strong> of the Executive Board<br />
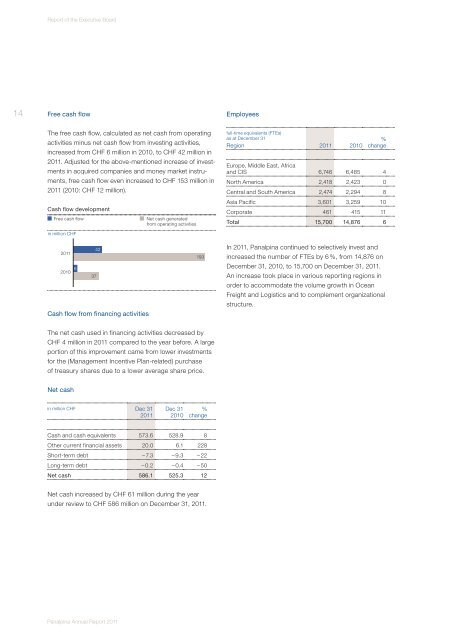
Free cash flow<br />
The free cash flow, calculated as net cash from operating<br />
activities minus net cash flow from investing activities,<br />
increased from CHF 6 million in 2010, to CHF 42 million in<br />
<strong>2011</strong>. Adjusted for the above-mentioned increase of investments<br />
in acquired companies and money market instruments,<br />
free cash flow even increased to CHF 153 million in<br />
<strong>2011</strong> (2010: CHF 12 million).<br />
Cash flow development<br />
Free cash flow Net cash generated<br />
from operating activities<br />
in million CHF<br />
<strong>2011</strong><br />
6<br />
2010<br />
37<br />
42<br />
Cash flow from financing activities<br />
The net cash used in financing activities decreased by<br />
CHF 4 million in <strong>2011</strong> compared to the year before. A large<br />
portion of this improvement came from lower investments<br />
for the (Management Incentive Plan-related) purchase<br />
of treasury shares due to a lower average share price.<br />
Net cash<br />
in million CHF Dec 31<br />
<strong>2011</strong><br />
Panalpina <strong>Annual</strong> <strong>Report</strong> <strong>2011</strong><br />
Dec 31<br />
2010<br />
193<br />
%<br />
change<br />
Cash and cash equivalents 573.6 528.9 8<br />
Other current financial assets 20.0 6.1 228<br />
Short-term debt – 7.3 – 9.3 – 22<br />
Long-term debt – 0.2 – 0.4 – 50<br />
Net cash 586.1 525.3 12<br />
Net cash increased by CHF 61 million during the year<br />
under review to CHF 586 million on December 31, <strong>2011</strong>.<br />
Employees<br />
full-time equivalents (FTEs)<br />
as at December 31<br />
Region <strong>2011</strong> 2010<br />
%<br />
change<br />
Europe, Middle East, Africa<br />
and CIS 6,746 6,485 4<br />
North America 2,418 2,423 0<br />
Central and South America 2,474 2,294 8<br />
Asia Pacific 3,601 3,259 10<br />
Corporate 461 415 11<br />
Total 15,700 14,876 6<br />
In <strong>2011</strong>, Panalpina continued to selectively invest and<br />
increased the number of FTEs by 6 %, from 14,876 on<br />
December 31, 2010, to 15,700 on December 31, <strong>2011</strong>.<br />
An increase took place in various reporting regions in<br />
order to accommodate the volume growth in Ocean<br />
Freight and Logistics and to complement organizational<br />
structure.
![Eigenes Luftfrachtnetzwerk [pdf | 244 KB] - Panalpina](https://img.yumpu.com/23347328/1/184x260/eigenes-luftfrachtnetzwerk-pdf-244-kb-panalpina.jpg?quality=85)
![Übersicht Panalpina [pdf | 240 KB]](https://img.yumpu.com/22547731/1/184x260/ubersicht-panalpina-pdf-240-kb.jpg?quality=85)
![Seefracht [pdf | 181 KB] - Panalpina](https://img.yumpu.com/22234724/1/184x260/seefracht-pdf-181-kb-panalpina.jpg?quality=85)


![Annual Report 2012 [pdf | 1 MB] - Panalpina](https://img.yumpu.com/15342099/1/184x260/annual-report-2012-pdf-1-mb-panalpina.jpg?quality=85)