Central London Market Report Q4 2012 - Jones Lang LaSalle
Central London Market Report Q4 2012 - Jones Lang LaSalle
Central London Market Report Q4 2012 - Jones Lang LaSalle

You also want an ePaper? Increase the reach of your titles
YUMPU automatically turns print PDFs into web optimized ePapers that Google loves.
10 On Point • <strong>Central</strong> <strong>London</strong> <strong>Market</strong> • Fourth Quarter <strong>2012</strong><br />
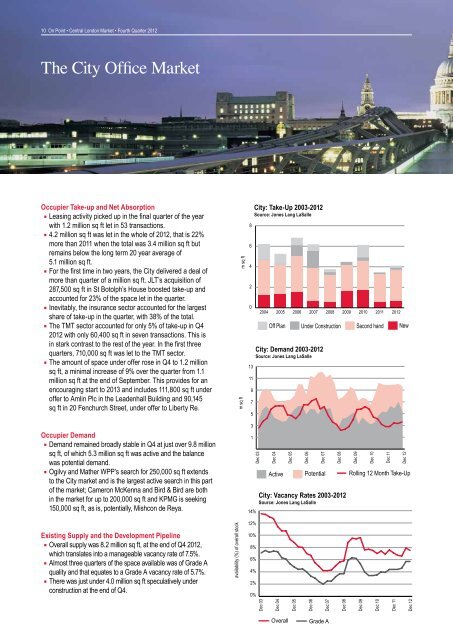
The City Office <strong>Market</strong><br />
Occupier Take-up and Net Absorption<br />
Leasing activity picked up in the final quarter of the year<br />
with 1.2 million sq ft let in 53 transactions.<br />
4.2 million sq ft was let in the whole of <strong>2012</strong>, that is 22%<br />
more than 2011 when the total was 3.4 million sq ft but<br />
remains below the long term 20 year average of<br />
5.1 million sq ft. West End: Take-Up 5 2001-2011 Q1<br />
For the first time in two years, Source: the <strong>Jones</strong> City <strong>Lang</strong> delivered <strong>LaSalle</strong> a deal of<br />
more than quarter West of End: a million 5 Take-Up sq ft. 2001-2011 JLT’s acquisition 4Q1<br />
of<br />
287,500 sq ft Source: in St Botolph’s <strong>Jones</strong> <strong>Lang</strong> House <strong>LaSalle</strong> boosted take-up and<br />
accounted for 5<br />
4<br />
3<br />
23% of the space let in the quarter.<br />
Inevitably, the insurance sector accounted for the largest<br />
4<br />
3<br />
2<br />
share of take-up in the quarter, with 38% of the total.<br />
The TMT sector accounted for only 5% of take-up in <strong>Q4</strong><br />
3<br />
2<br />
1<br />
<strong>2012</strong> with only 60,400 sq ft in seven transactions. This is<br />
in stark contrast<br />
2<br />
to the rest 1 of the year. In the 0 first three<br />
2002 2003<br />
quarters, 710,000 sq ft was let to the TMT sector.<br />
The amount 1of space under 0 offer rose in <strong>Q4</strong> to 1.2 million<br />
2002 2003 2004 2005 2006 2007<br />
sq ft, a minimal increase of 9% over the quarter from 1.1<br />
million sq ft 0at the end of September. This provides for an<br />
2002 2003 2004 2005 2006 2007 2008 2009<br />
encouraging start to 2013 City: and includes Demand 18<br />
111,800 2002-2011 sq ft Q2 under<br />
Source: <strong>Jones</strong> <strong>Lang</strong><br />
offer to Amlin Plc in the Leadenhall Building 16<strong>LaSalle</strong><br />
and 90,145<br />
sq ft in 20 Fenchurch City: Demand 18<br />
Street, 2002-2011 under offer Q2 14to Liberty Re.<br />
m sq ft<br />
m sq ft<br />
Occupier Demand 12<br />
8<br />
14<br />
Demand remained broadly 10 stable in <strong>Q4</strong> at 6just over 9.8 million<br />
12<br />
sq ft, of which 5.3 million 8sq ft was active and 4 the balance<br />
10<br />
was potential demand. 6<br />
2<br />
Ogilvy and Mather<br />
8<br />
WPP’s 4 search for 250,0000<br />
sq ft extends<br />
to the City market 6 and is the 2 largest active search in this part<br />
of the market; 4 Cameron McKenna 0 and Bird & Bird are both<br />
in the market 2 for up to 200,000 sq ft and KPMG is seeking<br />
150,000 sq 0ft, as is, potentially, Mishcon de Reya.<br />
West End: Take-Up 5 2001-2011 6 Q1<br />
Source: <strong>Jones</strong> <strong>Lang</strong> <strong>LaSalle</strong><br />
Source: <strong>Jones</strong> <strong>Lang</strong> <strong>LaSalle</strong><br />
2010<br />
West End: Vacancy Rates 2002-2011 Q1<br />
Existing Supply and the Development Source: <strong>Jones</strong> <strong>Lang</strong> Pipeline <strong>LaSalle</strong><br />
West End: Vacancy Rates 2002-2011 Q1<br />
Overall supply was 8.2 million 9%<br />
Source: <strong>Jones</strong> <strong>Lang</strong> <strong>LaSalle</strong><br />
sq ft, at the end of <strong>Q4</strong> <strong>2012</strong>,<br />
which translates into a manageable 8%<br />
9%<br />
vacancy rate of 7.5%.<br />
Almost three quarters of<br />
7%<br />
8%<br />
the space available was of Grade A<br />
6%<br />
quality and 7% that equates to a Grade A vacancy rate of 5.7%.<br />
5%<br />
There was 6% just under 4.0 million sq ft speculatively under<br />
4%<br />
construction 5% at the end of <strong>Q4</strong>.<br />
availability (%) of overall stock<br />
m sq ft<br />
Source: <strong>Jones</strong> 16 <strong>Lang</strong> <strong>LaSalle</strong><br />
18<br />
14<br />
16<br />
4%<br />
3%<br />
2%<br />
1%<br />
0%<br />
June 02<br />
02<br />
m sq ft<br />
June 03<br />
availability (%) of overall stock<br />
03<br />
June 04<br />
3%<br />
2%<br />
1%<br />
0%<br />
04<br />
June 02<br />
Mar 02<br />
June 05<br />
05<br />
June 03<br />
Mar 03<br />
m sq ft<br />
June 06<br />
06<br />
June 04<br />
Mar 04<br />
m sq ft<br />
12<br />
10<br />
June 05<br />
June 07<br />
June 06<br />
June 08<br />
m sq ft<br />
June 07<br />
June 09<br />
4<br />
3<br />
2<br />
1<br />
0<br />
2004<br />
2008<br />
2005<br />
2009<br />
2011<br />
m sq ft<br />
2006<br />
8<br />
4<br />
2<br />
0<br />
2010 13<br />
City: Take-Up 2003-<strong>2012</strong><br />
Source: <strong>Jones</strong> <strong>Lang</strong> <strong>LaSalle</strong><br />
West End: Take-Up 2001-2011 Q1<br />
Source: <strong>Jones</strong> <strong>Lang</strong> <strong>LaSalle</strong><br />
June 10<br />
2002<br />
June 08<br />
June 11<br />
2003<br />
City: Demand 2002-2011 Q2<br />
June 02<br />
07<br />
Mar 05<br />
June 03<br />
08<br />
Mar 06<br />
June 04<br />
09<br />
Man 07<br />
June 05<br />
10<br />
Man 08<br />
June 06<br />
m sq ft<br />
June 09<br />
availability (%) of overall stock<br />
11<br />
Mar 09<br />
11<br />
2004<br />
9<br />
7<br />
5<br />
3<br />
1<br />
June 07<br />
2004<br />
2005<br />
Off Plan<br />
2006<br />
2007<br />
Under Construction Second hand<br />
City: 2008 Demand 2009 2003-<strong>2012</strong><br />
2010 2011<br />
Source: <strong>Jones</strong> <strong>Lang</strong> <strong>LaSalle</strong><br />
Second hand New<br />
2007<br />
Dec 03<br />
2011<br />
2005<br />
New<br />
Dec 04<br />
Active<br />
2006<br />
Dec 05<br />
2007<br />
Off Plan<br />
2008<br />
Under Construction<br />
Dec 06<br />
2008<br />
Dec 07<br />
2009<br />
Dec 08<br />
2009<br />
2010<br />
Dec 09<br />
Off Plan<br />
Off Plan<br />
Under C<br />
Off Plan<br />
Under Construction Second<br />
New<br />
Under Construction Second hand<br />
2010<br />
2011<br />
Second hand<br />
2011<br />
New<br />
Potential Rolling 12 Month Take-Up<br />
City: Vacancy Rates 2003-<strong>2012</strong><br />
Source: <strong>Jones</strong> <strong>Lang</strong> <strong>LaSalle</strong><br />
Rolling 12 Month Take-Up<br />
14%<br />
June 10<br />
12%<br />
10%<br />
8%<br />
6%<br />
4%<br />
2%<br />
0%<br />
Mar 10<br />
Dec 03<br />
June 08<br />
June 11<br />
Dec 04<br />
June 09<br />
Overall<br />
Grade A<br />
Mar 11<br />
Dec 05<br />
June 10<br />
Active<br />
Potential<br />
Dec 06<br />
June 11<br />
Dec 07<br />
Overall<br />
Grade A<br />
Dec 08<br />
Active<br />
Potential<br />
Dec 10<br />
Dec 11<br />
<strong>2012</strong><br />
New<br />
Dec 12<br />
Rolling 12 Month Take-Up<br />
Dec 09<br />
Dec 10<br />
Dec 11<br />
Dec 12<br />
Potentia<br />
Active<br />
Rolling 1<br />
Gra<br />
Ove


![Presseinformation inklusive Charts [PDF] - Jones Lang LaSalle](https://img.yumpu.com/23689734/1/184x260/presseinformation-inklusive-charts-pdf-jones-lang-lasalle.jpg?quality=85)