Central London Market Report Q4 2012 - Jones Lang LaSalle
Central London Market Report Q4 2012 - Jones Lang LaSalle
Central London Market Report Q4 2012 - Jones Lang LaSalle

You also want an ePaper? Increase the reach of your titles
YUMPU automatically turns print PDFs into web optimized ePapers that Google loves.
6 On Point • <strong>Central</strong> <strong>London</strong> <strong>Market</strong> • Fourth Quarter <strong>2012</strong><br />
The <strong>Central</strong> <strong>London</strong> <strong>Market</strong><br />
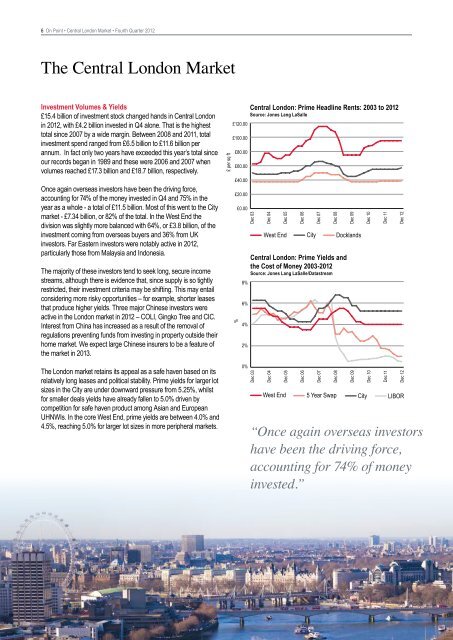
Investment Volumes & Yields<br />
£15.4 billion of investment stock changed hands in <strong>Central</strong> <strong>London</strong><br />
in <strong>2012</strong>, with £4.2 billion invested in <strong>Q4</strong> alone. That is the highest<br />
£120.00<br />
total since 2007 by a wide margin. Between <strong>Central</strong> 2008 and <strong>London</strong>: 2011, Prime total Headline Rents: 2002 to 2011 Q2<br />
£100.00<br />
Source: <strong>Jones</strong> <strong>Lang</strong> <strong>LaSalle</strong><br />
investment spend ranged from<br />
<strong>Central</strong><br />
£6.5 billion<br />
<strong>London</strong>:<br />
to £11.6<br />
Prime<br />
billion<br />
Headline<br />
per<br />
Rents: 2002 to 2011 Q2<br />
annum. In fact only two years<br />
£120.00<br />
Source: have exceeded <strong>Jones</strong> <strong>Lang</strong> this <strong>LaSalle</strong> year’s total since £80.00<br />
our records began <strong>Central</strong> in 1989 <strong>London</strong>: £120.00 and these Prime were Headline 2006 and Rents: 20072002 when to 2011 Q2<br />
£100.00<br />
Source: <strong>Jones</strong> <strong>Lang</strong> <strong>LaSalle</strong><br />
£60.00<br />
volumes reached £17.3 billion and £18.7 billion, respectively.<br />
£ per sq ft<br />
June 02<br />
June 03<br />
June 04<br />
June 05<br />
June 06<br />
June 07<br />
June 08<br />
June 09<br />
June 10<br />
£ per sq ft<br />
June 11<br />
<strong>Central</strong> <strong>London</strong>: Prime Headline Rents: 2003 to <strong>2012</strong><br />
Source: <strong>Jones</strong> <strong>Lang</strong> <strong>LaSalle</strong><br />
£120.00<br />
£100.00 £80.00<br />
£40.00<br />
West En<br />
Once again £100.00 overseas investors £80.00 have been the driving force,<br />
£60.00<br />
accounting for 74% of the money invested in <strong>Q4</strong> and 75% in the<br />
£80.00<br />
£60.00<br />
year as a whole - a total of £11.5 billion. £40.00 Most of this went to the City<br />
£20.00<br />
£0.00 West End<br />
City<br />
Docklan<br />
market -<br />
£60.00<br />
£7.34 billion, or 82%<br />
£40.00of the total. In the West End the<br />
£20.00<br />
division was slightly more balanced with 64%, or £3.8 billion, of the<br />
West End City<br />
investment £40.00 coming from overseas £20.00 buyers £0.00 and 36% from UK<br />
West End City Docklands<br />
investors. Far Eastern investors were notably active in <strong>2012</strong>,<br />
£20.00<br />
£0.00 City<br />
Docklands<br />
particularly those from Malaysia and Indonesia.<br />
<strong>Central</strong> <strong>London</strong>: Prime Yields and<br />
£0.00 Docklands<br />
£ per sq ft<br />
June 02<br />
£ per sq ft<br />
June 03<br />
June 02<br />
June 04<br />
June 03<br />
June 05<br />
June 04<br />
June 06<br />
June 05<br />
June 07<br />
June 06<br />
June 08<br />
June 07<br />
June 09<br />
%<br />
Dec 03<br />
June 08<br />
June 10<br />
Dec 04<br />
June 09<br />
June 11<br />
Dec 05<br />
June 10<br />
Dec 06<br />
June 11<br />
Dec 07<br />
the Cost of Money 2003-<strong>2012</strong><br />
Source: <strong>Jones</strong> <strong>Lang</strong> <strong>LaSalle</strong>/Datastream<br />
The majority of these investors tend to seek long, secure income<br />
streams, although there is evidence that, since supply is so tightly<br />
8%<br />
restricted, their investment criteria may be shifting. This may entail <strong>Central</strong> <strong>London</strong>: Prime Yields and<br />
considering more risky opportunities – for example, <strong>Central</strong> shorter <strong>London</strong>: leases<br />
the Cost of Money 2002-2011 Q2<br />
Prime Yields and<br />
Source: <strong>Jones</strong> <strong>Lang</strong> 6% <strong>LaSalle</strong>/Datastream<br />
that produce higher yields. Three major Chinese investors the Cost were of Money 2002-2011 Q2<br />
<strong>Central</strong> <strong>London</strong>: Prime<br />
Source:<br />
Yields 8%<br />
<strong>Jones</strong> <strong>Lang</strong><br />
and<br />
<strong>LaSalle</strong>/Datastream<br />
active in the <strong>London</strong> market in <strong>2012</strong> – COLI, Gingko Tree and CIC.<br />
the Cost of Money 2002-2011 Q2<br />
Interest from China <strong>Central</strong> has <strong>London</strong>: increased Prime Yields and 8%<br />
4%<br />
Source: as <strong>Jones</strong> a result <strong>Lang</strong> of <strong>LaSalle</strong>/Datastream<br />
the removal of<br />
the Cost of Money 2002-2011 Q2<br />
6%<br />
regulations preventing funds 8% from investing in property outside their<br />
Source: <strong>Jones</strong> <strong>Lang</strong> <strong>LaSalle</strong>/Datastream<br />
home market. We expect large Chinese insurers 6% to be a feature of<br />
2%<br />
8%<br />
the market in 2013.<br />
4%<br />
4%<br />
0% LIBOR<br />
The <strong>London</strong> 6% market retains its appeal as a safe haven based West End<br />
2%<br />
on its<br />
5 Year Swap<br />
relatively long leases and political<br />
4%<br />
stability. Prime yields for larger lot<br />
West End 5 Year SwapCity<br />
2%<br />
sizes in the 4% City are under downward pressure from 5.25%, whilst<br />
0% West End 5 Year Swap City<br />
for smaller deals yields have<br />
LIBOR<br />
2% already fallen to 5.0% driven by<br />
competition for safe haven product among Asian 0% and European<br />
5 Year Swap City<br />
LIBOR<br />
2%<br />
UHNWIs. In the core West End, prime yields are between 4.0% and<br />
0% City<br />
LIBOR<br />
4.5%, reaching 5.0% for larger lot sizes in more peripheral markets.<br />
0% LIBOR<br />
%<br />
June 02<br />
June 03<br />
%<br />
June 04<br />
6%<br />
June 02<br />
June 05<br />
June 03<br />
June 06<br />
%<br />
June 04<br />
June 07<br />
June 02<br />
June 05<br />
June 08<br />
%<br />
June 03<br />
June 06<br />
June 09<br />
June 02<br />
June 04<br />
June 07<br />
June 10<br />
June 03<br />
June 05<br />
June 08<br />
June 11<br />
June 04<br />
June 06<br />
June 09<br />
Dec 03<br />
June 05<br />
June 07<br />
June 10<br />
Dec 04<br />
June 06<br />
June 08<br />
June 11<br />
Dec 05<br />
June 07<br />
June 09<br />
Dec 06<br />
June 08<br />
June 10<br />
Dec 07<br />
June 09<br />
June 11<br />
Dec 08<br />
Dec 08<br />
June 10<br />
Dec 09<br />
Dec 09<br />
June 11<br />
Dec 10<br />
Dec 10<br />
Dec 11<br />
Dec 11<br />
Dec 12<br />
West End<br />
“Once again overseas investors<br />
have been the driving force,<br />
accounting for 74% of money<br />
invested.”<br />
Dec 12<br />
West E<br />
5 Year S<br />
City


![Presseinformation inklusive Charts [PDF] - Jones Lang LaSalle](https://img.yumpu.com/23689734/1/184x260/presseinformation-inklusive-charts-pdf-jones-lang-lasalle.jpg?quality=85)