Central London Market Report Q4 2012 - Jones Lang LaSalle
Central London Market Report Q4 2012 - Jones Lang LaSalle
Central London Market Report Q4 2012 - Jones Lang LaSalle

You also want an ePaper? Increase the reach of your titles
YUMPU automatically turns print PDFs into web optimized ePapers that Google loves.
12 On Point • <strong>Central</strong> <strong>London</strong> <strong>Market</strong> • Fourth Quarter <strong>2012</strong><br />
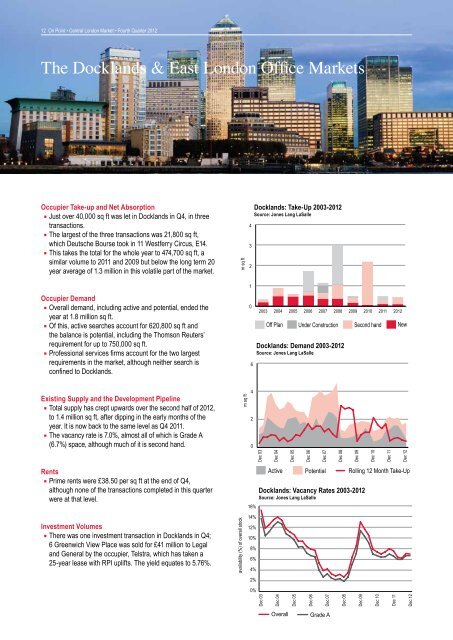
The Docklands & East <strong>London</strong> Office <strong>Market</strong>s<br />
Occupier Take-up and Net Absorption<br />
Just over 40,000 sq ft was let in Docklands in <strong>Q4</strong>, in three<br />
transactions.<br />
The largest of the three transactions was 21,800 sq ft,<br />
which Deutsche Bourse took in 11 Westferry Circus, E14.<br />
This takes the total for the whole year to 474,700 sq ft, a<br />
West End: Take-Up 5 2001-2011 Q1<br />
similar volume to 2011 and 2009 but below the long term 20 4<br />
year average of 1.3 million<br />
Source:<br />
in this<br />
<strong>Jones</strong><br />
volatile<br />
<strong>Lang</strong> <strong>LaSalle</strong><br />
part of the market.<br />
West End: 5 Take-Up 2001-20114<br />
3<br />
Q1<br />
Source: <strong>Jones</strong> <strong>Lang</strong> <strong>LaSalle</strong><br />
5<br />
Occupier Demand<br />
Overall demand, including active and potential, ended the<br />
0<br />
Off Plan<br />
4<br />
3<br />
2<br />
1<br />
2003 2004 2005 2006<br />
year at 1.8 million sq ft.<br />
2007 2008<br />
Of this, active searches account for 620,800 sq ft and<br />
Off Plan Under Construction<br />
3<br />
2<br />
1<br />
0<br />
2002 2003 2004 2005 2006 2007 2008 2009<br />
the balance is potential, including the Thomson Reuters’<br />
requirement for up to 750,000 sq ft.<br />
Under Construction Second hand<br />
2<br />
1<br />
0<br />
Docklands: Demand 2003-<strong>2012</strong><br />
2002 2003 2004 2005 2006 2007 2008 2009 2010 2011<br />
Professional services firms account for the two largest<br />
Source: <strong>Jones</strong> <strong>Lang</strong> <strong>LaSalle</strong><br />
Second hand New<br />
requirements 1 in the market, 0 although neither search is<br />
6<br />
2002 2003 2004 2005 2006 2007 2008 2009 2010 2011<br />
confined to Docklands.<br />
West End: Demand 2002-2011 Q1<br />
New<br />
0<br />
Source: <strong>Jones</strong> <strong>Lang</strong> <strong>LaSalle</strong><br />
2002 2003 2004 West 2005 End: 2006 Demand 2007 2002-2011 2008 2009 Q1 2010 2011<br />
m sq ft<br />
m sq ft<br />
4<br />
Existing Supply West and End: the Development 12 Demand 2002-2011 Pipeline 10 Q1<br />
Total supply has Source: crept <strong>Jones</strong> upwards <strong>Lang</strong> <strong>LaSalle</strong> over the second half of <strong>2012</strong>,<br />
10<br />
8<br />
to 1.4 million 12 sq ft, after dipping in the early months of the<br />
year. It is now back to the 8same level as <strong>Q4</strong> 6 2011.<br />
10<br />
The vacancy rate is 7.0%, almost all of which is Grade A<br />
(6.7%) space, although much<br />
6<br />
of it is second<br />
4<br />
hand.<br />
m sq ft<br />
8<br />
6<br />
Rents<br />
2<br />
0<br />
4<br />
Prime rents were £38.50 per sq ft at the end of <strong>Q4</strong>,<br />
0<br />
2<br />
although none of the transactions completed in this quarter<br />
were at that level.<br />
0<br />
Mar 02<br />
Mar 03<br />
m sq ft<br />
Mar 04<br />
Mar 05<br />
West End: Take-Up 5 2001-2011 3 Q1<br />
Source: <strong>Jones</strong> <strong>Lang</strong> <strong>LaSalle</strong><br />
West End: Vacancy Rates 2002-2011 Q1<br />
Investment Volumes<br />
Source: <strong>Jones</strong> <strong>Lang</strong> <strong>LaSalle</strong><br />
There was one West investment End: Vacancy transaction Rates in 2002-2011 Docklands Q1<br />
9%<br />
in <strong>Q4</strong>;<br />
Source: <strong>Jones</strong> <strong>Lang</strong> <strong>LaSalle</strong><br />
6 Greenwich View Place 8% was sold for £41 million to Legal<br />
9%<br />
and General by the occupier, 7% Telstra, which has taken a<br />
8%<br />
25-year lease with RPI uplifts. 6% The yield equates to 5.76%.<br />
availability (%) of overall stock<br />
7%<br />
6%<br />
5%<br />
4%<br />
3%<br />
2%<br />
1%<br />
0%<br />
ar 02<br />
availability (%) of overall stock<br />
ar 03<br />
4<br />
Mar 06<br />
m sq ft<br />
12<br />
Source: <strong>Jones</strong> <strong>Lang</strong> <strong>LaSalle</strong><br />
Mar 02<br />
5%<br />
4%<br />
3%<br />
2%<br />
1%<br />
0%<br />
ar 04<br />
Mar 02<br />
ar 05<br />
Mar 03<br />
Mar 03<br />
m sq ft<br />
ar 06<br />
Mar 04<br />
Mar 04<br />
2<br />
3<br />
Mar 02<br />
Mar 07<br />
an 07<br />
Mar 05<br />
Mar 05<br />
Mar 03<br />
Mar 08<br />
an 08<br />
Mar 06<br />
Mar 06<br />
m sq ft<br />
Mar 04<br />
Mar 09<br />
ar 09<br />
Mar 07<br />
Man 07<br />
2<br />
m sq ft<br />
4<br />
2<br />
1<br />
Docklands: Take-Up 2003-<strong>2012</strong><br />
Source: <strong>Jones</strong> <strong>Lang</strong> <strong>LaSalle</strong><br />
West End: Take-Up 2001-2011 Q1<br />
Source: <strong>Jones</strong> <strong>Lang</strong> <strong>LaSalle</strong><br />
Mar 05<br />
Mar 10<br />
ar 10<br />
Mar 08<br />
Man 08<br />
Mar 06<br />
Mar 11<br />
ar 11<br />
Mar 09<br />
availability (%) of overall stock<br />
m sq ft<br />
Mar 09<br />
4<br />
2<br />
0<br />
Mar 07<br />
Dec 03<br />
Dec 04<br />
Active<br />
Dec 05<br />
Dec 06<br />
Dec 07<br />
Dec 08<br />
2010<br />
Off Pla<br />
Off Plan<br />
Under<br />
Off Plan<br />
Under ConstructionSecon<br />
New<br />
Under Construction Second hand<br />
2009<br />
2010<br />
Second hand<br />
2011<br />
New<br />
Dec 09<br />
Rolling 12 Month Take-Up<br />
Docklands: Potential Vacancy Rates 2003-<strong>2012</strong><br />
Source: <strong>Jones</strong> <strong>Lang</strong> <strong>LaSalle</strong><br />
Rolling 12 Month Take-Up<br />
16%<br />
14%<br />
12%<br />
10%<br />
8%<br />
6%<br />
4%<br />
2%<br />
0%<br />
Mar 10<br />
Dec 03<br />
Mar 10<br />
Mar 08<br />
Mar 11<br />
Dec 04<br />
Mar 09<br />
Overall<br />
Mar 11<br />
Grade A<br />
Dec 05<br />
Mar 10<br />
Active<br />
Potential<br />
Dec 06<br />
Mar 11<br />
Dec 07<br />
Overall<br />
Grade A<br />
Dec 08<br />
Active<br />
Potential<br />
Dec 10<br />
2011<br />
Dec 11<br />
<strong>2012</strong><br />
New<br />
Dec 12<br />
Rolling 12 Month Take-Up<br />
Dec 09<br />
Dec 10<br />
Dec 11<br />
Dec 12<br />
Poten<br />
Active<br />
Rollin<br />
Gra<br />
Ove


![Presseinformation inklusive Charts [PDF] - Jones Lang LaSalle](https://img.yumpu.com/23689734/1/184x260/presseinformation-inklusive-charts-pdf-jones-lang-lasalle.jpg?quality=85)