Central London Market Report Q4 2012 - Jones Lang LaSalle
Central London Market Report Q4 2012 - Jones Lang LaSalle
Central London Market Report Q4 2012 - Jones Lang LaSalle

Create successful ePaper yourself
Turn your PDF publications into a flip-book with our unique Google optimized e-Paper software.
4 On Point • <strong>Central</strong> <strong>London</strong> <strong>Market</strong> • Fourth Quarter <strong>2012</strong><br />
The <strong>Central</strong> <strong>London</strong> <strong>Market</strong><br />
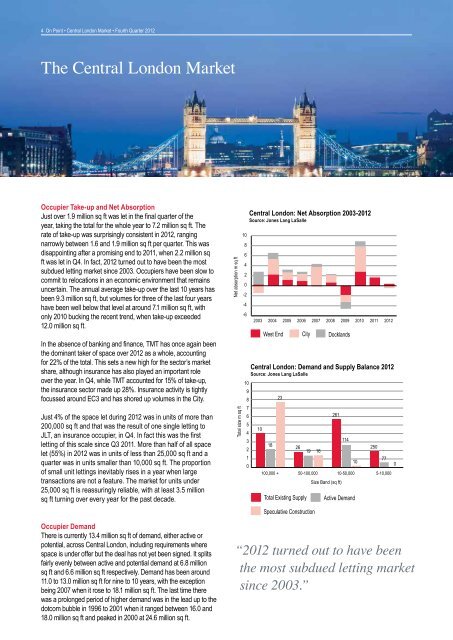
Occupier Take-up and Net Absorption<br />
Just over 1.9 million sq ft was let in the final quarter of the<br />
year, taking the total for the whole year to 7.2 million sq ft. The<br />
rate of take-up was surprisingly consistent in <strong>2012</strong>, ranging<br />
Source: <strong>Jones</strong> <strong>Lang</strong> <strong>LaSalle</strong><br />
narrowly between 1.6 and 1.9 million sq ft per quarter. This was<br />
disappointing after a promising end to 2011, when 2.2 million sq<br />
Source: <strong>Jones</strong> 10 <strong>Lang</strong> <strong>LaSalle</strong><br />
ft was let in <strong>Q4</strong>. In fact, <strong>2012</strong> turned out to have been the most<br />
subdued letting market<br />
<strong>Central</strong><br />
since<br />
<strong>London</strong>:<br />
2003. Occupiers<br />
Net Absorption<br />
8<br />
have been<br />
2002-2011<br />
slow to<br />
Q2<br />
Source: <strong>Jones</strong> <strong>Lang</strong> 10 <strong>LaSalle</strong> 6<br />
commit to relocations in an economic<br />
8<br />
environment that remains<br />
4<br />
uncertain. The annual 10 average take-up over the last 10 years has<br />
6<br />
2<br />
been 9.3 million sq 8 ft, but volumes for three of the last four years<br />
4<br />
have been well below 6 that level at around 7.1<br />
0<br />
million sq ft, with<br />
2<br />
only 2010 bucking<br />
4the recent trend, when take-up -2 exceeded<br />
0<br />
12.0 million sq ft.<br />
-4<br />
Net absorption m sq ft<br />
2<br />
0<br />
In the absence of banking and finance,<br />
-4<br />
2002 2003 2004 2005<br />
TMT has once again been<br />
-2<br />
the dominant taker of space over -6<strong>2012</strong> as a whole, accounting<br />
-4<br />
2002 2003 2004 2005 2006<br />
for 22% of the total. This sets a new high for the sector’s market<br />
-6<br />
share, although insurance has also played an important role<br />
2002 2003 2004 2005 2006 2007 2008 2009<br />
over the year. In <strong>Q4</strong>, while TMT accounted for 15% of take-up,<br />
the insurance sector made up 28%. Insurance activity is tightly<br />
focussed around EC3 and has shored up volumes in the City.<br />
Just 4% of the <strong>Central</strong> space let <strong>London</strong>: during Demand <strong>2012</strong> was and in units Supply of more Balance than 2011 Q2 6<br />
Source: <strong>Jones</strong> <strong>Lang</strong> <strong>LaSalle</strong><br />
<strong>Central</strong> <strong>London</strong>: Demand and Supply Balance 2011 Q2<br />
200,000 sq ft and that was the result Source: of one <strong>Jones</strong> single <strong>Lang</strong> <strong>LaSalle</strong> letting to<br />
5<br />
10<br />
10<br />
4<br />
JLT, an insurance <strong>Central</strong> occupier, <strong>London</strong>: in <strong>Q4</strong>. Demand 10In fact this was the first<br />
9<br />
and Supply Balance 2011 Q2<br />
letting of this scale<br />
Source:<br />
since<br />
<strong>Jones</strong> <strong>Lang</strong><br />
Q3 2011.<br />
<strong>LaSalle</strong>9<br />
3<br />
8<br />
More than half of all space<br />
18<br />
2<br />
26<br />
let (55%) in<br />
10<br />
8<br />
<strong>2012</strong> 7 was in units of less than 25,000 sq ft and a<br />
9<br />
7<br />
296<br />
1<br />
quarter was 6in units smaller than 10,000 sq ft. The proportion 296<br />
8<br />
6<br />
0<br />
of small unit 5lettings inevitably rises in a year when large<br />
100,000 +<br />
7<br />
5<br />
296<br />
transactions 4<br />
16<br />
Total Existing Supply<br />
are not a feature. The market for units under<br />
6<br />
4<br />
16<br />
25,000 sq ft<br />
3 15<br />
is reassuringly reliable, with at least 3.5 million<br />
5<br />
3 15<br />
113 341<br />
11<br />
113 341<br />
2<br />
26<br />
Active Demand<br />
11<br />
sq ft turning over every 16 year for the 20 past decade. 26<br />
Total Existing Supply<br />
Total size m Total sq ft size m sq ft<br />
4<br />
1<br />
3<br />
0<br />
2<br />
15<br />
11<br />
100,000 +<br />
Net absorption m sq ft<br />
-2<br />
Total size m sq ft<br />
Occupier Demand 1<br />
9 100,000 + 50-100,000 92<br />
Size Band (sq ft) 10<br />
There is currently 0 13.4 million sq ft of demand, either active or<br />
100,000 + 50-100,000 10-50,000<br />
potential, across <strong>Central</strong> <strong>London</strong>, including requirements where<br />
Size Band (sq ft)<br />
space is under offer but the deal has not yet been signed. It splits<br />
fairly evenly between active and potential demand at 6.8 million<br />
sq ft and 6.6 million sq ft respectively. Demand has been around<br />
11.0 to 13.0 million sq ft for nine to 10 years, with the exception<br />
being 2007 when it rose to 18.1 million sq ft. The last time there<br />
was a prolonged period of higher demand was in the lead up to the<br />
dotcom bubble in 1996 to 2001 when it ranged between 16.0 and<br />
18.0 million sq ft and peaked in 2000 at 24.6 million sq ft.<br />
<strong>Central</strong> <strong>London</strong>: Net Absorption 10 2002-2011 Q2<br />
8<br />
6<br />
4<br />
2<br />
0<br />
-2<br />
-4<br />
-6<br />
2003 2004 2005<br />
<strong>Central</strong> <strong>London</strong>: Net Absorption 2002-2011 Q2<br />
Net absorption m sq ft<br />
-6<br />
2007<br />
2010<br />
2006<br />
2008<br />
Net absorption m sq ft<br />
2011<br />
yoy<br />
2007<br />
Total size m sq ft<br />
2009<br />
<strong>Central</strong> <strong>London</strong>: Net Absorption 2003-<strong>2012</strong><br />
Source: <strong>Jones</strong> <strong>Lang</strong> <strong>LaSalle</strong><br />
2008<br />
2010<br />
West End<br />
2009<br />
City<br />
2011<br />
yoy<br />
2006<br />
2007<br />
2008<br />
2009<br />
2010<br />
2011<br />
<strong>2012</strong><br />
<strong>Central</strong> Docklands <strong>London</strong>: Demand and Supply Balance <strong>2012</strong><br />
Source: <strong>Jones</strong> <strong>Lang</strong> <strong>LaSalle</strong><br />
10<br />
9<br />
8<br />
23<br />
7<br />
2<br />
9 20 92<br />
1<br />
10<br />
113 3419 0<br />
92<br />
10<br />
26<br />
0<br />
0<br />
50-100,000 20<br />
10-50,000<br />
5-10,000<br />
10-50,000<br />
5-10,000<br />
Size Band (sq 0 ft)<br />
5-10,000<br />
2010<br />
2011<br />
yoy<br />
West End<br />
City<br />
Docklands<br />
19 16<br />
Speculative Construction<br />
Active Demand<br />
Speculative Construction<br />
West End<br />
City<br />
Docklands<br />
261<br />
114<br />
10<br />
50-100,000 10-50,000<br />
Size Band Total (sq Existing ft) Supply<br />
Active Demand<br />
250<br />
Speculative Construction<br />
77<br />
0<br />
5-10,000<br />
“<strong>2012</strong> turned out to have been<br />
the most subdued letting market<br />
since 2003.”<br />
Docklands<br />
City<br />
West End<br />
Total Exis<br />
Active De<br />
Speculat


![Presseinformation inklusive Charts [PDF] - Jones Lang LaSalle](https://img.yumpu.com/23689734/1/184x260/presseinformation-inklusive-charts-pdf-jones-lang-lasalle.jpg?quality=85)