Central London Market Report Q4 2012 - Jones Lang LaSalle
Central London Market Report Q4 2012 - Jones Lang LaSalle
Central London Market Report Q4 2012 - Jones Lang LaSalle

Create successful ePaper yourself
Turn your PDF publications into a flip-book with our unique Google optimized e-Paper software.
The <strong>Central</strong> <strong>London</strong> <strong>Market</strong> <strong>Q4</strong> <strong>2012</strong><br />
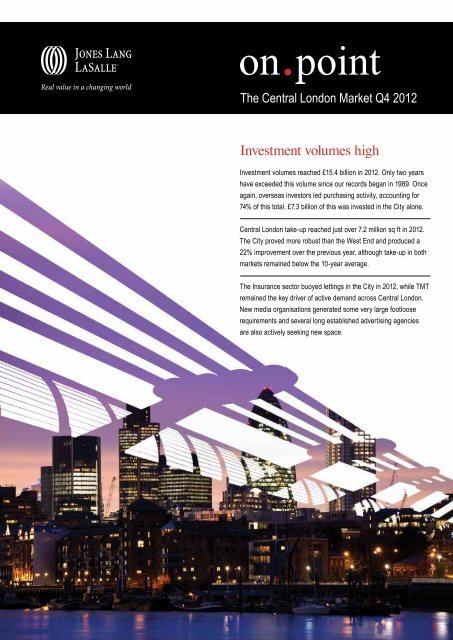
Investment volumes high<br />
Investment volumes reached £15.4 billion in <strong>2012</strong>. Only two years<br />
have exceeded this volume since our records began in 1989. Once<br />
again, overseas investors led purchasing activity, accounting for<br />
74% of this total. £7.3 billion of this was invested in the City alone.<br />
<strong>Central</strong> <strong>London</strong> take-up reached just over 7.2 million sq ft in <strong>2012</strong>.<br />
The City proved more robust than the West End and produced a<br />
22% improvement over the previous year, although take-up in both<br />
markets remained below the 10-year average.<br />
The Insurance sector buoyed lettings in the City in <strong>2012</strong>, while TMT<br />
remained the key driver of active demand across <strong>Central</strong> <strong>London</strong>.<br />
New media organisations generated some very large footloose<br />
requirements and several long established advertising agencies<br />
are also actively seeking new space.
Summary of statistics<br />
Sizes in 000 sq ft<br />
Units of 5,400 sq ft and above<br />
Take-Up<br />
TOTALS<br />
Grade A<br />
Off-plan<br />
Under construction<br />
New completed<br />
Second hand (incl. refurbished)<br />
100,000+<br />
50,000 - 99,999<br />
10,000 - 49,999<br />
Sub 10,000<br />
Banking & Finance<br />
Professional Services<br />
Service Industries<br />
Manufacturing Industries<br />
Public Admin. & Institutions<br />
Other<br />
Net Absorption<br />
TOTALS<br />
Prime Rents & Rent Free<br />
Prime Rent<br />
Rent Free (months)<br />
Net Effective<br />
Demand (As at 31 Dec <strong>2012</strong>)<br />
TOTALS<br />
100,000+<br />
50,000 - 99,999<br />
10,000 - 49,999<br />
Sub 10,000<br />
Banking & Finance<br />
Professional Services<br />
Service Industries<br />
Manufacturing Industries<br />
Public Admin. & Institutions<br />
Other<br />
Supply (As at 31 Dec <strong>2012</strong>)<br />
Total Current Supply<br />
VACANCY RATE (% of total stock)<br />
100,000+<br />
50,000 - 99,999<br />
10,000 - 49,999<br />
Sub 10,000<br />
Speculative Development<br />
(As at 31 Dec <strong>2012</strong>)<br />
TOTALS<br />
2013<br />
2014<br />
2015<br />
Capital Transactions<br />
£millions<br />
TOTALS<br />
UK Purchasers<br />
Overseas Purchasers<br />
Property Companies<br />
Institutions<br />
Privates & Other Investors<br />
Prime Yield (As at 31 Dec <strong>2012</strong>)<br />
West End City Docklands / East <strong>London</strong> <strong>Central</strong> <strong>London</strong><br />
2011 <strong>2012</strong> <strong>2012</strong> 2011 <strong>2012</strong> <strong>2012</strong> 2011 <strong>2012</strong> <strong>2012</strong> 2011 <strong>2012</strong> <strong>2012</strong><br />
Q1-<strong>Q4</strong> <strong>Q4</strong> Q1-<strong>Q4</strong> <strong>Q4</strong> Q1-<strong>Q4</strong> <strong>Q4</strong> Q1-<strong>Q4</strong> <strong>Q4</strong><br />
3,201 2,521 621 3,444 4,160 1,244 496 475 40 7,141 7,156 1,905<br />
2,315 1,730 533 1,774 3,120 1,082 488 228 34 4,577 5,078 1,649<br />
216 20 0 0 190 84 250 0 0 467 209 84<br />
402 491 156 197 219 52 0 0 0 599 711 207<br />
806 237 60 583 692 462 102 97 0 1,491 1,025 523<br />
1,777 1,773 405 2,663 3,059 646 144 377 40 4,585 5,210 1,091<br />
600 127 0 197 673 415 250 165 0 1,047 965 415<br />
267 256 115 411 681 146 59 75 0 737 1,012 261<br />
1,516 1,426 351 1,774 1,922 472 143 203 34 3,433 3,551 858<br />
817 713 154 1,062 884 210 44 32 6 1,923 1,628 370<br />
13% 9% 9% 21% 13% 12% 7% 10% 54% 16% 11% 12%<br />
7% 12% 14% 24% 22% 28% 0% 1% 0% 15% 17% 23%<br />
52% 53% 53% 40% 51% 57% 20% 21% 46% 44% 51% 55%<br />
10% 13% 20% 5% 5% 3% 62% 0% 0% 11% 8% 8%<br />
14% 5% 1% 5% 7% 0% 10% 68% 0% 9% 10% 0%<br />
5% 6% 2% 5% 1% 0% 0% 0% 0% 4% 3% 1%<br />
2011 <strong>2012</strong> <strong>2012</strong> 2011 <strong>2012</strong> <strong>2012</strong> 2011 <strong>2012</strong> <strong>2012</strong> 2011 <strong>2012</strong> <strong>2012</strong><br />
Q1-<strong>Q4</strong> <strong>Q4</strong> Q1-<strong>Q4</strong> <strong>Q4</strong> Q1-<strong>Q4</strong> <strong>Q4</strong> Q1-<strong>Q4</strong> <strong>Q4</strong><br />
1,647 382 76 148 -476 214 83 27 -64 1,985 -137 210<br />
2011 <strong>2012</strong> <strong>2012</strong> 2011 <strong>2012</strong> <strong>2012</strong> 2011 <strong>2012</strong> <strong>2012</strong><br />
Q3 <strong>Q4</strong> Q3 <strong>Q4</strong> Q3 <strong>Q4</strong><br />
£95.00 £95.00 £95.00 £55.00 £55.00 £57.00 £38.50 £38.50 £38.50<br />
16 16 16 22 24 24<br />
£82.33 £82.33 £82.33 £44.92 £44.00 £45.60<br />
Total Active Potential Total Active Potential Total Active Potential Total Active Potential<br />
5,941 2,957 2,984 9,836 5,370 4,466 1,756 603 1,153 13,412 6,786 6,627<br />
2,562 1,152 1,410 4,800 2,148 2,652 1,462 375 1,087 5,705 2,148 3,558<br />
1,236 563 673 2,034 1,117 917 233 168 65 2,818 1,393 1,425<br />
1,847 1,021 827 2,568 1,704 864 60 60 0 4,171 2,633 1,538<br />
296 221 75 433 400 32 0 0 0 718 611 107<br />
8% 7% 10% 24% 17% 32% 41% 23% 51% 21% 16% 25%<br />
10% 13% 8% 23% 30% 14% 26% 77% 0% 19% 26% 12%<br />
72% 74% 71% 49% 47% 51% 32% 0% 49% 53% 51% 56%<br />
6% 5% 8% 2% 3% 1% 0% 0% 0% 4% 5% 4%<br />
3% 1% 4% 2% 2% 2% 0% 0% 0% 3% 2% 3%<br />
0% 0% 0% 0% 0% 0% 0% 0% 0% 0% 0% 0%<br />
Total Grade A Grade B Total Grade A Grade B Total Grade A Grade B Total Grade A Grade B<br />
3,764 2,937 709 8,195 6,136 2,024 1,428 1,365 63 13,387 10,437 2,796<br />
4.1% 3.2% 0.8% 7.5% 5.7% 1.9% 7.0% 6.7% 0.3% 6.1% 2.8% 8.9%<br />
470 470 0 3,025 3,025 0 548 548 0 4,043 4,043 0<br />
728 588 71 699 639 60 419 419 0 1,846 1,646 131<br />
1,770 1,322 410 3,576 1,976 1,494 401 357 44 5,746 3,655 1,948<br />
798 557 228 1,046 495 469 61 42 19 1,905 1,093 717<br />
Total Over 50,000- Total Over 50,000- Total Over 50,000- Total Over 50,000-<br />
100,000 99,999 100,000 99,999 100,000 99,999 100,000 99,999<br />
2,679 1,980 699 5,953 5,212 741 522 522 0 9,154 7,714 1,440<br />
1,500 1,137 363 2,753 2,195 558 522 522 0 4,775 3,854 921<br />
651 315 336 2,567 2,384 183 0 0 0 3,218 2,699 519<br />
528 528 0 633 633 0 0 0 0 1,161 1,161 0<br />
2011 <strong>2012</strong> <strong>2012</strong> 2011 <strong>2012</strong> <strong>2012</strong> 2011 <strong>2012</strong> <strong>2012</strong> 2011 <strong>2012</strong> <strong>2012</strong><br />
Q1-<strong>Q4</strong> <strong>Q4</strong> Q1-<strong>Q4</strong> <strong>Q4</strong> Q1-<strong>Q4</strong> <strong>Q4</strong> Q1-<strong>Q4</strong> <strong>Q4</strong><br />
4,720 5,895 1,810 6,029 8,994 2,361 42 512 55 10,791 15,401 4,226<br />
2,070 2,126 395 2,258 1,656 654 30 131 41 4,357 3,913 1,090<br />
2,651 3,769 1,415 3,772 7,338 1,707 12 380 14 6,435 11,487 3,136<br />
1,619 1,741 263 976 1,357 261 30 90 0 2,625 3,188 524<br />
1,437 1,532 520 2,951 5,701 1,493 0 68 41 4,387 7,301 2,054<br />
1,664 2,622 1,027 2,103 1,936 607 12 353 14 3,780 4,911 1,648<br />
Sub £10m £10-£50m £80m+ Sub £40m £40-£125m £125m+<br />
4.00% 4.25% 4.75% 5.00% 5.25% 5.25%<br />
2
On Point • <strong>Central</strong> <strong>London</strong> <strong>Market</strong> • Fourth Quarter <strong>2012</strong> 3<br />
The <strong>Central</strong> <strong>London</strong> <strong>Market</strong><br />
<strong>Market</strong> Indicators (QoQ) West End City Docklands<br />
Take-up F F A<br />
Supply A A F<br />
Overall Vacancy Rate E A F<br />
Grade A Vacancy Rate E E F<br />
Occupier Demand F A F<br />
Prime Rent E F E<br />
Under Construction A F E<br />
Investment Volumes F F E<br />
The Economy for <strong>London</strong> Bulletin<br />
January 2013<br />
Frantic tax debates in the US at the start of 2013 provided a<br />
sobering reminder that the global Chart economy GDP growth is still forecasts fragile. The compared<br />
Source: <strong>Jones</strong> <strong>Lang</strong> <strong>LaSalle</strong><br />
avoidance of the impending fiscal cliff was a relief for markets, but<br />
only a temporary Chart one, GDP<br />
5<br />
with growth agreement forecasts on spending compared still required<br />
Source: <strong>Jones</strong> <strong>Lang</strong> <strong>LaSalle</strong><br />
over the next couple of months. 4 In the Eurozone, the economic<br />
5<br />
news has remained downbeat, especially for the fringe economies.<br />
But the underlying health of<br />
3<br />
Source: <strong>Jones</strong> <strong>Lang</strong> <strong>LaSalle</strong><br />
4<br />
the single currency area looks<br />
5<br />
more secure since the ECB’s<br />
2<br />
pledge to buy bonds, which had a<br />
3<br />
sustained impact in lowering spreads. Nonetheless, 4 swingeing<br />
austerity means the economic 1 outlook remains weak in 2013.<br />
% of forecasts<br />
% of forecasts<br />
December’s Autumn Statement provided few surprises. With<br />
the double-dip de-railing fiscal consolidation, there was no extra<br />
spending to support the recovery. Corporation tax cuts were<br />
welcomed, but will be clawed back in a further squeeze on welfare<br />
and other spending. On the monetary front, the Bank of England<br />
appears to have abandoned Quantitative Easing for the time<br />
being. A lack of evidence of the effectiveness of the most recent<br />
injections is likely to blame, as banks continue to use the extra<br />
liquidity to bolster capital, not lending.<br />
% of forecasts<br />
Chart GDP growth forecasts compared<br />
5<br />
4<br />
3<br />
2<br />
1<br />
Chart GDP growth forecasts compared<br />
Source: <strong>Jones</strong> <strong>Lang</strong> <strong>LaSalle</strong><br />
1.0% 0.9%<br />
0<br />
Inner <strong>London</strong><br />
2.1% 2.0% 2.6%<br />
-1<br />
2<br />
-0.3% -0.5%<br />
3<br />
0.6%<br />
Inner <strong>London</strong> UK<br />
0<br />
2.1% 2.0% 2.6%<br />
Last year was<br />
1<br />
not a vintage one for the UK. Even 2 if Christmas<br />
trading is healthy, -0.3% the economy -1-0.5% will at 0.6% best be flat in <strong>2012</strong> as<br />
UK<br />
Rest of UK<br />
<strong>2012</strong> 2013-16<br />
0<br />
2.1% 2.0% 2.6%<br />
1<br />
a whole. After a second dip, output will start 2013 more than<br />
3% below its -1<br />
-0.3% -0.5% 0.6%<br />
2008 peak, with little prospect of returning there<br />
Rest of UK<br />
<strong>2012</strong> 0<br />
2013-16<br />
before 2015. There have been some brighter signs. Jobs have<br />
-1<br />
been created at a healthy rate and lower inflation has eased <strong>2012</strong> the<br />
2013-16<br />
pressure on real incomes. But with confidence fragile, any upturn<br />
is likely to be faltering, at least until later this year. GDP is forecast<br />
to rise to by about 1% overall, better than <strong>2012</strong>, but not strong by<br />
historic standards.<br />
% of forecasts<br />
1.5%<br />
2.3% 2.2%<br />
2013 2014-16<br />
Inner <strong>London</strong><br />
UK<br />
Rest of UK<br />
3.2%<br />
“With confidence fragile, any<br />
upturn is likely to be faltering,<br />
at least until later this year.”<br />
Inner Lon<br />
UK<br />
Rest of U<br />
The <strong>London</strong> economy appears to have been the UK’s most<br />
resilient and is certainly where much of the recent jobs impetus<br />
has been concentrated. But business sentiment has slipped even<br />
in the capital, with the Lloyds-TSB’s index mirroring the national<br />
downtrend last year. Oxford Economics project that the capital will<br />
pull away again in 2013 and consistently out-perform the national<br />
economy thereafter. <strong>Central</strong> <strong>London</strong>’s growth for the current year<br />
is about 0.5 percentage points higher than the UK benchmark and<br />
this margin is sustained over a four year horizon.
4 On Point • <strong>Central</strong> <strong>London</strong> <strong>Market</strong> • Fourth Quarter <strong>2012</strong><br />
The <strong>Central</strong> <strong>London</strong> <strong>Market</strong><br />
Occupier Take-up and Net Absorption<br />
Just over 1.9 million sq ft was let in the final quarter of the<br />
year, taking the total for the whole year to 7.2 million sq ft. The<br />
rate of take-up was surprisingly consistent in <strong>2012</strong>, ranging<br />
Source: <strong>Jones</strong> <strong>Lang</strong> <strong>LaSalle</strong><br />
narrowly between 1.6 and 1.9 million sq ft per quarter. This was<br />
disappointing after a promising end to 2011, when 2.2 million sq<br />
Source: <strong>Jones</strong> 10 <strong>Lang</strong> <strong>LaSalle</strong><br />
ft was let in <strong>Q4</strong>. In fact, <strong>2012</strong> turned out to have been the most<br />
subdued letting market<br />
<strong>Central</strong><br />
since<br />
<strong>London</strong>:<br />
2003. Occupiers<br />
Net Absorption<br />
8<br />
have been<br />
2002-2011<br />
slow to<br />
Q2<br />
Source: <strong>Jones</strong> <strong>Lang</strong> 10 <strong>LaSalle</strong> 6<br />
commit to relocations in an economic<br />
8<br />
environment that remains<br />
4<br />
uncertain. The annual 10 average take-up over the last 10 years has<br />
6<br />
2<br />
been 9.3 million sq 8 ft, but volumes for three of the last four years<br />
4<br />
have been well below 6 that level at around 7.1<br />
0<br />
million sq ft, with<br />
2<br />
only 2010 bucking<br />
4the recent trend, when take-up -2 exceeded<br />
0<br />
12.0 million sq ft.<br />
-4<br />
Net absorption m sq ft<br />
2<br />
0<br />
In the absence of banking and finance,<br />
-4<br />
2002 2003 2004 2005<br />
TMT has once again been<br />
-2<br />
the dominant taker of space over -6<strong>2012</strong> as a whole, accounting<br />
-4<br />
2002 2003 2004 2005 2006<br />
for 22% of the total. This sets a new high for the sector’s market<br />
-6<br />
share, although insurance has also played an important role<br />
2002 2003 2004 2005 2006 2007 2008 2009<br />
over the year. In <strong>Q4</strong>, while TMT accounted for 15% of take-up,<br />
the insurance sector made up 28%. Insurance activity is tightly<br />
focussed around EC3 and has shored up volumes in the City.<br />
Just 4% of the <strong>Central</strong> space let <strong>London</strong>: during Demand <strong>2012</strong> was and in units Supply of more Balance than 2011 Q2 6<br />
Source: <strong>Jones</strong> <strong>Lang</strong> <strong>LaSalle</strong><br />
<strong>Central</strong> <strong>London</strong>: Demand and Supply Balance 2011 Q2<br />
200,000 sq ft and that was the result Source: of one <strong>Jones</strong> single <strong>Lang</strong> <strong>LaSalle</strong> letting to<br />
5<br />
10<br />
10<br />
4<br />
JLT, an insurance <strong>Central</strong> occupier, <strong>London</strong>: in <strong>Q4</strong>. Demand 10In fact this was the first<br />
9<br />
and Supply Balance 2011 Q2<br />
letting of this scale<br />
Source:<br />
since<br />
<strong>Jones</strong> <strong>Lang</strong><br />
Q3 2011.<br />
<strong>LaSalle</strong>9<br />
3<br />
8<br />
More than half of all space<br />
18<br />
2<br />
26<br />
let (55%) in<br />
10<br />
8<br />
<strong>2012</strong> 7 was in units of less than 25,000 sq ft and a<br />
9<br />
7<br />
296<br />
1<br />
quarter was 6in units smaller than 10,000 sq ft. The proportion 296<br />
8<br />
6<br />
0<br />
of small unit 5lettings inevitably rises in a year when large<br />
100,000 +<br />
7<br />
5<br />
296<br />
transactions 4<br />
16<br />
Total Existing Supply<br />
are not a feature. The market for units under<br />
6<br />
4<br />
16<br />
25,000 sq ft<br />
3 15<br />
is reassuringly reliable, with at least 3.5 million<br />
5<br />
3 15<br />
113 341<br />
11<br />
113 341<br />
2<br />
26<br />
Active Demand<br />
11<br />
sq ft turning over every 16 year for the 20 past decade. 26<br />
Total Existing Supply<br />
Total size m Total sq ft size m sq ft<br />
4<br />
1<br />
3<br />
0<br />
2<br />
15<br />
11<br />
100,000 +<br />
Net absorption m sq ft<br />
-2<br />
Total size m sq ft<br />
Occupier Demand 1<br />
9 100,000 + 50-100,000 92<br />
Size Band (sq ft) 10<br />
There is currently 0 13.4 million sq ft of demand, either active or<br />
100,000 + 50-100,000 10-50,000<br />
potential, across <strong>Central</strong> <strong>London</strong>, including requirements where<br />
Size Band (sq ft)<br />
space is under offer but the deal has not yet been signed. It splits<br />
fairly evenly between active and potential demand at 6.8 million<br />
sq ft and 6.6 million sq ft respectively. Demand has been around<br />
11.0 to 13.0 million sq ft for nine to 10 years, with the exception<br />
being 2007 when it rose to 18.1 million sq ft. The last time there<br />
was a prolonged period of higher demand was in the lead up to the<br />
dotcom bubble in 1996 to 2001 when it ranged between 16.0 and<br />
18.0 million sq ft and peaked in 2000 at 24.6 million sq ft.<br />
<strong>Central</strong> <strong>London</strong>: Net Absorption 10 2002-2011 Q2<br />
8<br />
6<br />
4<br />
2<br />
0<br />
-2<br />
-4<br />
-6<br />
2003 2004 2005<br />
<strong>Central</strong> <strong>London</strong>: Net Absorption 2002-2011 Q2<br />
Net absorption m sq ft<br />
-6<br />
2007<br />
2010<br />
2006<br />
2008<br />
Net absorption m sq ft<br />
2011<br />
yoy<br />
2007<br />
Total size m sq ft<br />
2009<br />
<strong>Central</strong> <strong>London</strong>: Net Absorption 2003-<strong>2012</strong><br />
Source: <strong>Jones</strong> <strong>Lang</strong> <strong>LaSalle</strong><br />
2008<br />
2010<br />
West End<br />
2009<br />
City<br />
2011<br />
yoy<br />
2006<br />
2007<br />
2008<br />
2009<br />
2010<br />
2011<br />
<strong>2012</strong><br />
<strong>Central</strong> Docklands <strong>London</strong>: Demand and Supply Balance <strong>2012</strong><br />
Source: <strong>Jones</strong> <strong>Lang</strong> <strong>LaSalle</strong><br />
10<br />
9<br />
8<br />
23<br />
7<br />
2<br />
9 20 92<br />
1<br />
10<br />
113 3419 0<br />
92<br />
10<br />
26<br />
0<br />
0<br />
50-100,000 20<br />
10-50,000<br />
5-10,000<br />
10-50,000<br />
5-10,000<br />
Size Band (sq 0 ft)<br />
5-10,000<br />
2010<br />
2011<br />
yoy<br />
West End<br />
City<br />
Docklands<br />
19 16<br />
Speculative Construction<br />
Active Demand<br />
Speculative Construction<br />
West End<br />
City<br />
Docklands<br />
261<br />
114<br />
10<br />
50-100,000 10-50,000<br />
Size Band Total (sq Existing ft) Supply<br />
Active Demand<br />
250<br />
Speculative Construction<br />
77<br />
0<br />
5-10,000<br />
“<strong>2012</strong> turned out to have been<br />
the most subdued letting market<br />
since 2003.”<br />
Docklands<br />
City<br />
West End<br />
Total Exis<br />
Active De<br />
Speculat
On Point • <strong>Central</strong> <strong>London</strong> <strong>Market</strong> • Fourth Quarter <strong>2012</strong> 5<br />
The primary drivers of current demand are lease expiries or the<br />
desire to consolidate occupied property in order to reduce costs.<br />
Even then, in many cases, the prospect of an expiry culminates in<br />
a lease regearing or renewal rather than relocation. Occupiers are<br />
Source: <strong>Jones</strong> <strong>Lang</strong> <strong>LaSalle</strong><br />
inhibited by the continuing uncertainties in the UK economy, the<br />
18%<br />
Eurozone and wider global markets. Source: Nevertheless, <strong>Jones</strong> <strong>Lang</strong> <strong>LaSalle</strong> there are some<br />
very large active <strong>Central</strong> requirements <strong>London</strong>: generated Vacancy 16%<br />
by Rates business 2002-2011 expansion Q2<br />
18%<br />
Source: <strong>Jones</strong> <strong>Lang</strong> <strong>LaSalle</strong><br />
in <strong>London</strong>. The most obvious examples<br />
14%<br />
16% are in the TMT sector,<br />
18%<br />
particularly new media or technology companies 12%<br />
14%<br />
such as Google,<br />
16%<br />
which is under offer at King’s Cross. But 10%<br />
12% the long established<br />
14%<br />
<strong>London</strong> advertising agencies have some 8%<br />
10%<br />
big requirements too<br />
12%<br />
– such as Ogilvy (200,000 sq ft) and Saatchi 6% & Saatchi (up to<br />
8%<br />
10%<br />
175,000 sq ft).<br />
4%<br />
availability (%) of overall stock<br />
June 02<br />
June 03<br />
availability (%) of overall stock<br />
June 04<br />
June 05<br />
June 06<br />
June 07<br />
June 08<br />
June 09<br />
June 10<br />
availability (%) of overall stock<br />
June 11<br />
<strong>Central</strong> <strong>London</strong>: Vacancy Rates 2003-<strong>2012</strong><br />
Source: <strong>Jones</strong> <strong>Lang</strong> <strong>LaSalle</strong><br />
sq ft. In the City however there was a slight increase in <strong>Q4</strong>, for<br />
Mar-99 Jun-99 Sep-99 Dec-99 Mar-00 Jun-00 Sep-00 Dec-00 Mar-01 Jun-01 Sep-01 Dec-01 Mar-02 Jun-02 Sep-02 Dec-02 Mar-03 Jun-03 Sep-03 Dec-03 Mar-04 Jun-04 Sep-04 Dec-04 Mar-05 Jun-05 Sep-05 Dec-05 Mar-06 Jun-06 Sep-06 Dec-06 Mar-07 Jun-07 Sep-07 Dec-07 Mar-08<br />
Existing Supply & the Development Pipeline<br />
the first time since <strong>Q4</strong> 2010, to £57.00. The impetus has come<br />
The vacancy rate for <strong>Central</strong> <strong>London</strong> was 6.1% at the end of<br />
from the strength of the insurance sector and an increase in<br />
<strong>2012</strong>. That level has been broadly maintained since 2009. This is<br />
lettings over 50,000 sq ft during <strong>2012</strong>.<br />
Mar-99 Jun-99 Sep-99 Dec-99 Mar-00 Jun-00 Sep-00 Dec-00 Mar-01 Jun-01 Sep-01 Dec-01 Mar-02 Jun-02 Sep-02 Dec-02 Mar-03 Jun-03 Sep-03 Dec-03 Mar-04 Jun-04 Sep-04 Dec-04 Mar-05 Jun-05 Sep-05 Dec-05 Mar-06 Jun-06 Sep-06 Dec-06 Mar-07 Jun-07 Sep-07 Dec-07 Mar-08<br />
a sustainable level of vacancy for <strong>London</strong> and just below the<br />
Mar-99 Jun-99 Sep-99 Dec-99 Mar-00 Jun-00 Sep-00 Dec-00 Mar-01 Jun-01 Sep-01 Dec-01 Mar-02 Jun-02 Sep-02 Dec-02 Mar-03 Jun-03 Sep-03 Dec-03 Mar-04 Jun-04 Sep-04 Dec-04 Mar-05 Jun-05 Sep-05 Dec-05 Mar-06 Jun-06 Sep-06<br />
long-term average of 7.4% established over the last 20 years.<br />
Of Dec-06 Mar-07 the Jun-07 Sep-07 10.4 Dec-07 Mar-08 million sq ft that is Grade A, only 3.8 million sq ft is<br />
Mar-99 Jun-99 Sep-99 Dec-99 Mar-00 Jun-00 Sep-00 Dec-00 Mar-01 Jun-01 Sep-01 Dec-01 Mar-02 Jun-02 Sep-02 Dec-02 Mar-03 Jun-03 Sep-03 Dec-03 Mar-04 Jun-04 Sep-04 Dec-04 Mar-05 Jun-05 Sep-05 Dec-05 Mar-06 Jun-06 Sep-06 Dec-06 Mar-07 Jun-07 Sep-07 Dec-07 Mar-08<br />
new development. While a further 6.3 million sq ft of space is<br />
Most of the 13.4 million sq ft available at the end of <strong>2012</strong> is of<br />
speculatively being developed, this is a relatively small pipeline<br />
Grade A quality, although it is far more likely to be second hand<br />
by historic standards and there will be little added to it for the<br />
than newly developed space. Of the 10.4 million sq ft that is<br />
foreseeable future. In the City it is the towers that can attract<br />
Grade A, only 3.7 million sq ft is new development, however an<br />
premium rents, while in the West End location is the critical<br />
additional 6.3 million sq ft is speculative under construction and<br />
factor. In the core of St James’ and Mayfair, rents of over £100.00<br />
will feed through into the availability statistics over the next three<br />
per sq ft are well-established for smaller lot sizes.<br />
years. Construction is at its highest level since 2008.<br />
18%<br />
16%<br />
14%<br />
12%<br />
10%<br />
8%<br />
6%<br />
4%<br />
2%<br />
<strong>Central</strong> <strong>London</strong>: Vacancy Rates 2002-2011 Q2<br />
<strong>Central</strong> <strong>London</strong>: Vacancy Rates 2002-2011 Q2<br />
June 02<br />
availability (%) of overall stock<br />
June 03<br />
June 02<br />
June 04<br />
June 03<br />
June 05<br />
June 04<br />
June 06<br />
June 05<br />
June 07<br />
June 06<br />
June 08<br />
June 07<br />
June 09<br />
Dec 03<br />
June 08<br />
June 10<br />
Dec 04<br />
June 09<br />
June 11<br />
Dec 05<br />
June 10<br />
Dec 06<br />
June 11<br />
Dec 07<br />
Dec 08<br />
Dec 09<br />
Dec 10<br />
Dec 11<br />
Docklands City<br />
0% West End DocklandsCity<br />
Docklan<br />
6%<br />
Docklands<br />
8%<br />
West End City City West End<br />
2%<br />
4%<br />
The insurance<br />
6%<br />
sector, which has boosted take-up in <strong>2012</strong>, is the<br />
West End<br />
City<br />
West End<br />
0% City Docklands<br />
2%<br />
source of some 4% large active requirements in the City. Liberty and<br />
0% City<br />
Docklands West End<br />
Munich Re 2% both need over 100,000 sq ft while Royal and Sun<br />
Alliance, Heath 0% Gallagher and Fidelity Insurance all have sizeable<br />
Docklands<br />
units under offer.<br />
Rents and Rental Expectations<br />
Prime rents remained unchanged in the West End at £95.00 per<br />
Dec 12<br />
West En<br />
“There are some very large<br />
active requirements generated<br />
by business expansion in<br />
<strong>London</strong>.”
6 On Point • <strong>Central</strong> <strong>London</strong> <strong>Market</strong> • Fourth Quarter <strong>2012</strong><br />
The <strong>Central</strong> <strong>London</strong> <strong>Market</strong><br />
Investment Volumes & Yields<br />
£15.4 billion of investment stock changed hands in <strong>Central</strong> <strong>London</strong><br />
in <strong>2012</strong>, with £4.2 billion invested in <strong>Q4</strong> alone. That is the highest<br />
£120.00<br />
total since 2007 by a wide margin. Between <strong>Central</strong> 2008 and <strong>London</strong>: 2011, Prime total Headline Rents: 2002 to 2011 Q2<br />
£100.00<br />
Source: <strong>Jones</strong> <strong>Lang</strong> <strong>LaSalle</strong><br />
investment spend ranged from<br />
<strong>Central</strong><br />
£6.5 billion<br />
<strong>London</strong>:<br />
to £11.6<br />
Prime<br />
billion<br />
Headline<br />
per<br />
Rents: 2002 to 2011 Q2<br />
annum. In fact only two years<br />
£120.00<br />
Source: have exceeded <strong>Jones</strong> <strong>Lang</strong> this <strong>LaSalle</strong> year’s total since £80.00<br />
our records began <strong>Central</strong> in 1989 <strong>London</strong>: £120.00 and these Prime were Headline 2006 and Rents: 20072002 when to 2011 Q2<br />
£100.00<br />
Source: <strong>Jones</strong> <strong>Lang</strong> <strong>LaSalle</strong><br />
£60.00<br />
volumes reached £17.3 billion and £18.7 billion, respectively.<br />
£ per sq ft<br />
June 02<br />
June 03<br />
June 04<br />
June 05<br />
June 06<br />
June 07<br />
June 08<br />
June 09<br />
June 10<br />
£ per sq ft<br />
June 11<br />
<strong>Central</strong> <strong>London</strong>: Prime Headline Rents: 2003 to <strong>2012</strong><br />
Source: <strong>Jones</strong> <strong>Lang</strong> <strong>LaSalle</strong><br />
£120.00<br />
£100.00 £80.00<br />
£40.00<br />
West En<br />
Once again £100.00 overseas investors £80.00 have been the driving force,<br />
£60.00<br />
accounting for 74% of the money invested in <strong>Q4</strong> and 75% in the<br />
£80.00<br />
£60.00<br />
year as a whole - a total of £11.5 billion. £40.00 Most of this went to the City<br />
£20.00<br />
£0.00 West End<br />
City<br />
Docklan<br />
market -<br />
£60.00<br />
£7.34 billion, or 82%<br />
£40.00of the total. In the West End the<br />
£20.00<br />
division was slightly more balanced with 64%, or £3.8 billion, of the<br />
West End City<br />
investment £40.00 coming from overseas £20.00 buyers £0.00 and 36% from UK<br />
West End City Docklands<br />
investors. Far Eastern investors were notably active in <strong>2012</strong>,<br />
£20.00<br />
£0.00 City<br />
Docklands<br />
particularly those from Malaysia and Indonesia.<br />
<strong>Central</strong> <strong>London</strong>: Prime Yields and<br />
£0.00 Docklands<br />
£ per sq ft<br />
June 02<br />
£ per sq ft<br />
June 03<br />
June 02<br />
June 04<br />
June 03<br />
June 05<br />
June 04<br />
June 06<br />
June 05<br />
June 07<br />
June 06<br />
June 08<br />
June 07<br />
June 09<br />
%<br />
Dec 03<br />
June 08<br />
June 10<br />
Dec 04<br />
June 09<br />
June 11<br />
Dec 05<br />
June 10<br />
Dec 06<br />
June 11<br />
Dec 07<br />
the Cost of Money 2003-<strong>2012</strong><br />
Source: <strong>Jones</strong> <strong>Lang</strong> <strong>LaSalle</strong>/Datastream<br />
The majority of these investors tend to seek long, secure income<br />
streams, although there is evidence that, since supply is so tightly<br />
8%<br />
restricted, their investment criteria may be shifting. This may entail <strong>Central</strong> <strong>London</strong>: Prime Yields and<br />
considering more risky opportunities – for example, <strong>Central</strong> shorter <strong>London</strong>: leases<br />
the Cost of Money 2002-2011 Q2<br />
Prime Yields and<br />
Source: <strong>Jones</strong> <strong>Lang</strong> 6% <strong>LaSalle</strong>/Datastream<br />
that produce higher yields. Three major Chinese investors the Cost were of Money 2002-2011 Q2<br />
<strong>Central</strong> <strong>London</strong>: Prime<br />
Source:<br />
Yields 8%<br />
<strong>Jones</strong> <strong>Lang</strong><br />
and<br />
<strong>LaSalle</strong>/Datastream<br />
active in the <strong>London</strong> market in <strong>2012</strong> – COLI, Gingko Tree and CIC.<br />
the Cost of Money 2002-2011 Q2<br />
Interest from China <strong>Central</strong> has <strong>London</strong>: increased Prime Yields and 8%<br />
4%<br />
Source: as <strong>Jones</strong> a result <strong>Lang</strong> of <strong>LaSalle</strong>/Datastream<br />
the removal of<br />
the Cost of Money 2002-2011 Q2<br />
6%<br />
regulations preventing funds 8% from investing in property outside their<br />
Source: <strong>Jones</strong> <strong>Lang</strong> <strong>LaSalle</strong>/Datastream<br />
home market. We expect large Chinese insurers 6% to be a feature of<br />
2%<br />
8%<br />
the market in 2013.<br />
4%<br />
4%<br />
0% LIBOR<br />
The <strong>London</strong> 6% market retains its appeal as a safe haven based West End<br />
2%<br />
on its<br />
5 Year Swap<br />
relatively long leases and political<br />
4%<br />
stability. Prime yields for larger lot<br />
West End 5 Year SwapCity<br />
2%<br />
sizes in the 4% City are under downward pressure from 5.25%, whilst<br />
0% West End 5 Year Swap City<br />
for smaller deals yields have<br />
LIBOR<br />
2% already fallen to 5.0% driven by<br />
competition for safe haven product among Asian 0% and European<br />
5 Year Swap City<br />
LIBOR<br />
2%<br />
UHNWIs. In the core West End, prime yields are between 4.0% and<br />
0% City<br />
LIBOR<br />
4.5%, reaching 5.0% for larger lot sizes in more peripheral markets.<br />
0% LIBOR<br />
%<br />
June 02<br />
June 03<br />
%<br />
June 04<br />
6%<br />
June 02<br />
June 05<br />
June 03<br />
June 06<br />
%<br />
June 04<br />
June 07<br />
June 02<br />
June 05<br />
June 08<br />
%<br />
June 03<br />
June 06<br />
June 09<br />
June 02<br />
June 04<br />
June 07<br />
June 10<br />
June 03<br />
June 05<br />
June 08<br />
June 11<br />
June 04<br />
June 06<br />
June 09<br />
Dec 03<br />
June 05<br />
June 07<br />
June 10<br />
Dec 04<br />
June 06<br />
June 08<br />
June 11<br />
Dec 05<br />
June 07<br />
June 09<br />
Dec 06<br />
June 08<br />
June 10<br />
Dec 07<br />
June 09<br />
June 11<br />
Dec 08<br />
Dec 08<br />
June 10<br />
Dec 09<br />
Dec 09<br />
June 11<br />
Dec 10<br />
Dec 10<br />
Dec 11<br />
Dec 11<br />
Dec 12<br />
West End<br />
“Once again overseas investors<br />
have been the driving force,<br />
accounting for 74% of money<br />
invested.”<br />
Dec 12<br />
West E<br />
5 Year S<br />
City
On Point • <strong>Central</strong> <strong>London</strong> <strong>Market</strong> • Fourth Quarter <strong>2012</strong> 7<br />
<strong>Central</strong> <strong>London</strong> <strong>Market</strong><br />
<strong>2012</strong> was always expected to be a quiet year in the <strong>Central</strong><br />
<strong>London</strong> letting market. Even without the distractions of a ‘summer<br />
like no other’, sluggish conditions in the UK economy, combined<br />
with a hugely unsettled Eurozone and uncertainties in the<br />
emerging markets, would have conspired to make forward<br />
planning challenging. It was inevitable that businesses would be<br />
reluctant to make significant medium term commitments to new<br />
property. Bizarrely, the same uncertainties that dampened letting<br />
activity attracted record volumes of investment funds to <strong>London</strong>,<br />
simply because it seemed safe and stable compared with so<br />
many other places.<br />
In fact, the very characteristics that make <strong>London</strong> a magnet for<br />
investment also mean it is never truly quiet – even in a slow year.<br />
<strong>London</strong> is one of the most mature, dynamic office markets in the<br />
world and as such it is in a constant state of flux. It is interesting<br />
to reflect on the scale of change in recent decades. <strong>London</strong>’s<br />
stock of offices has increased by 41% since 1984. Most of that<br />
growth has taken place in the City and Docklands where 50.4<br />
million sq ft has been added to the stock. The West End, over<br />
the same period, has acquired an additional 12.0 million sq ft.<br />
Of course, Docklands and Canary Wharf have grown from<br />
almost nothing, but the City has expanded by 39% and the<br />
West End by 16%.<br />
Office employment in <strong>London</strong> doubled over the same period, so<br />
expansion was necessary to accommodate the additional<br />
demand. The current vacancy rate of 6.1% demonstrates that<br />
there is a healthy balance between supply and demand. But the<br />
magnitude of expansion in the City compared with the West End<br />
does, at least in part, explain the differential in rental growth<br />
between the two markets. While the City’s rents have remained<br />
broadly stable in real terms since the mid 1980s, the heart of the<br />
West End has experienced significant growth.<br />
It raises an important question about business location within<br />
<strong>London</strong>. We have seen in the past that occupier groups can shift<br />
over quite large distances: investment banks to Canary Wharf or<br />
advertising agencies to the West End. Today the City looks like<br />
an attractive proposition for footloose occupiers. There is a huge<br />
opportunity here, given that there are 2.3 million sq ft of current,<br />
footloose requirements in <strong>Central</strong> <strong>London</strong>.<br />
The question is whether we are really about to see a significant<br />
diversification in the City’s occupier base. Its building stock is<br />
predominantly Grade A, much of it has been renewed since the<br />
1980s; its rents are relatively low; its streetscape is attractive and<br />
it has excellent public transport. It looks like very good value,<br />
especially as floorspace densities increase. For all these<br />
reasons, we believe that the City will gradually begin to attract a<br />
wider mix of occupier types. This has already begun on the<br />
fringes – a trend that will intensify over the next few years.<br />
Whether they will be attracted to the core will depend on whether<br />
its amenities and the overall ‘lifestyle offer’ continue to improve<br />
over the longer term. We do not expect the City’s gain to be at<br />
the expense of the West End. Indeed, supply is so tightly<br />
constrained that the West End has its own built-in protection<br />
mechanism.<br />
The City Core’s close association with the banking and financial<br />
sector is, however, a barrier for some occupiers, who see<br />
themselves as part of a very different kind of business culture.<br />
Image and lifestyle is increasingly important to many companies<br />
when they choose their premises, particularly as it is key to<br />
attracting and retaining young, talented, globally footloose<br />
workers. The Fringe offers the bars, shops and restaurants that<br />
fit in with this requirement. While more retail and leisure – and<br />
residential – is increasingly on offer in the City core, in addition to<br />
established venues such as the Barbican, it remains a<br />
predominantly corporate environment, albeit one that will<br />
continue to change. A wider mix of uses will probably be<br />
introduced into its heart. In time, it may well be that more atypical<br />
occupiers begin to move into the square mile itself, perhaps when<br />
they themselves have become more established.
8 On Point • <strong>Central</strong> <strong>London</strong> <strong>Market</strong> • Fourth Quarter <strong>2012</strong><br />
The West End Office <strong>Market</strong><br />
Occupier Take-Up and Net Absorption<br />
Just under 620,500 sq ft was let in 38 transactions, still<br />
trailing at 23% below the quarterly average for the past<br />
10 years.<br />
In <strong>2012</strong> as a whole, 2.5 million sq ft was let, compared<br />
with 3.2 million sq ft in 2011 and a 10 year average of<br />
3.2 million sq ft. West End: Take-Up 5 2001-2011 Q2<br />
Source: <strong>Jones</strong> <strong>Lang</strong> <strong>LaSalle</strong><br />
TMT accounted for 35% of take-up this quarter.<br />
Once again, it West was End: 5<br />
the best Take-Up quality 2001-20114<br />
space that Q2let, with<br />
Source: <strong>Jones</strong> <strong>Lang</strong> <strong>LaSalle</strong><br />
Grade A comprising 85% of take-up.<br />
5<br />
4<br />
3<br />
The largest deal in <strong>Q4</strong> was 61,000 sq ft let to Coca Cola<br />
at Kingsley House, 1a Wimpole Street, W1.<br />
4<br />
3<br />
2<br />
11 transactions totalling 249,200 sq ft fell into the TMT<br />
sector, including Linkedin (48,300 sq ft); Emap (27,800<br />
3<br />
2<br />
1<br />
sq ft) and Medidata (23,000 sq ft). There was 545,000<br />
sq ft under offer 2 at the end 1 of the year, suggesting 0 that take-up<br />
2002 2003<br />
in the early months of 2013 will be strong and this excludes the<br />
863,000 sq ft 1 under offer 0to Google at King’s Cross.<br />
m sq ft<br />
m sq ft<br />
Existing Supply and the Development Pipeline<br />
Total supply increased by a small margin to 3.8 million sq ft in<br />
the final quarter of <strong>2012</strong>, having changed very little over the<br />
course of the year – it ended just 3% above the level recorded<br />
at end of 2011. However, this is still just over half the volume<br />
available at the beginning of 2010.<br />
The vast majority of space available, 2.9 million sq ft, is<br />
Grade A (78% of the total).<br />
2.0 million sq ft is under construction speculatively and adding<br />
that to the total supply increases it to 5.8 million sq ft.<br />
m sq ft<br />
Source: <strong>Jones</strong> <strong>Lang</strong> <strong>LaSalle</strong><br />
4<br />
5<br />
West End: Take-Up 2001-2011 Q2<br />
Source: <strong>Jones</strong> <strong>Lang</strong> <strong>LaSalle</strong><br />
m sq ft<br />
4<br />
3<br />
2<br />
1<br />
0<br />
m sq ft<br />
5<br />
3<br />
2<br />
1<br />
0<br />
West End: Take-Up 2003-<strong>2012</strong><br />
Source: <strong>Jones</strong> <strong>Lang</strong> <strong>LaSalle</strong><br />
West End: Take-Up 2001-2011 Q2<br />
2002<br />
2004 2005 2006<br />
Under Construction Second hand<br />
New<br />
West End: Demand 2003-<strong>2012</strong><br />
2007 2008 2009 2010 2011<br />
Source: <strong>Jones</strong> <strong>Lang</strong> <strong>LaSalle</strong><br />
Second hand New<br />
8<br />
2002 2003 2004 2005 2006 2007 2008 2009 2010 2011<br />
West End: Demand 2002-2011 Q2 7<br />
New<br />
0<br />
Source: <strong>Jones</strong> <strong>Lang</strong> <strong>LaSalle</strong><br />
2002 2003 2004 2005 2006 2007 2008 2009 2010 2011 6<br />
Occupier Demand West End: Demand 12 2002-2011 Q2<br />
Source: <strong>Jones</strong> <strong>Lang</strong> <strong>LaSalle</strong><br />
5<br />
There was 5.9 million sq ft of active and potential demand<br />
outstanding at<br />
West<br />
the end<br />
End: 12<br />
of<br />
Demand<br />
<strong>2012</strong>. Of<br />
2002-2011 10<br />
that, 2.9 million<br />
Q2<br />
4<br />
sq ft was<br />
Source: <strong>Jones</strong> <strong>Lang</strong> <strong>LaSalle</strong><br />
3<br />
active and the balance of 103.0 million sq ft 8was made up of<br />
12<br />
potential demand from businesses with impending lease<br />
2<br />
8<br />
6<br />
expiries or breaks 10 that have not yet initiated active searches.<br />
1<br />
Outstanding demand is at its highest level since <strong>Q4</strong> 2009,<br />
Active<br />
6<br />
4<br />
0<br />
8<br />
although the proportion actively seeking new space has<br />
Active<br />
4<br />
2<br />
declined.<br />
Potential<br />
6<br />
The TMT subsector made 2 up 62% of overall 0 demand adding<br />
4<br />
up to 3.75 million sq ft, of which 1.6 million sq ft, is active and<br />
Active Potential Rolling 12 Month Take-Up<br />
0<br />
the balance 2is potential demand. Some of the more notable<br />
active requirements are: Ogilvy (200,000 sq ft); Havas<br />
0<br />
(120-170,000 sq ft) and Capita for 60,000 sq ft.<br />
Potential<br />
Rolling 12 Month Take-Up<br />
m sq ft<br />
June 02<br />
June 03<br />
m sq ft<br />
June 02<br />
June 04<br />
June 03<br />
June 05<br />
m sq ft<br />
June 04<br />
June 06<br />
June 02<br />
June 05<br />
June 07<br />
June 03<br />
June 06<br />
June 08<br />
June 04<br />
June 07<br />
June 09<br />
June 05<br />
June 08<br />
June 10<br />
June 06<br />
June 09<br />
June 11<br />
2003<br />
m sq ft<br />
June 07<br />
2004<br />
June 10<br />
Dec 03<br />
2003<br />
June 08<br />
2004<br />
Off Plan<br />
2005<br />
June 11<br />
Dec 04<br />
June 09<br />
2006<br />
2005<br />
Dec 05<br />
June 10<br />
Off Plan<br />
2006<br />
2007<br />
Under Construction<br />
2007<br />
Dec 06<br />
June 11<br />
2008<br />
Dec 07<br />
2009<br />
“Take-up<br />
Rolling 12 Month<br />
is<br />
Take-Up<br />
still trailing at 30%<br />
below the quarterly average for<br />
the past 10 years.”<br />
2008<br />
Dec 08<br />
2010<br />
2009<br />
2010<br />
2011<br />
<strong>2012</strong><br />
Off Pla<br />
Under<br />
Off Plan<br />
Second<br />
Off Plan<br />
Under Construction<br />
New<br />
Under Construction Second hand<br />
Second hand<br />
Dec 09<br />
2011<br />
Dec 10<br />
Dec 11<br />
New<br />
Dec 12<br />
Activ<br />
Pote<br />
Rolli
On Point • <strong>Central</strong> <strong>London</strong> <strong>Market</strong> • Fourth Quarter <strong>2012</strong> 9<br />
There are 10 buildings that could offer more than 100,000 sq ft<br />
but only two are completed – Park House, Oxford Street, and<br />
5 Howick Place, Victoria. The largest is 62 Buckingham Gate<br />
West End: Vacancy Rates 2002-2011 Q2<br />
where 260,000 sq ft should Source: be completed <strong>Jones</strong> <strong>Lang</strong> in <strong>LaSalle</strong> mid-2013.<br />
The overall vacancy West End: rate Vacancy remained Rates unchanged 2002-2011 at 4.1% Q2<br />
9%<br />
Source: <strong>Jones</strong> <strong>Lang</strong> <strong>LaSalle</strong><br />
and there was no change 8% in any of the individual grade<br />
9%<br />
vacancy rates. 7%<br />
8%<br />
During <strong>Q4</strong>, 403,000 sq 6%<br />
7%<br />
ft went under construction in four<br />
developments, which were 5%<br />
6%<br />
the Zig Zag Building, Victoria Street,<br />
SW1 (188,000 sq ft); 394%<br />
5%<br />
Victoria Street, SW1 (88,000 sq ft);<br />
1 Mabledon 4% Place, WC1<br />
3%<br />
(87,300 sq ft) and Walmar House,<br />
2%<br />
Regent Street, 3% SW1 (40,000 sq ft).<br />
availability (%) of overall stock<br />
£ per sq ft<br />
June 02<br />
June 02<br />
availability (%) of overall stock<br />
June 03<br />
£ per sq ft<br />
June 03<br />
June 04<br />
June 02<br />
June 04<br />
June 02<br />
June 05<br />
June 03<br />
June 05<br />
June 03<br />
June 06<br />
June 04<br />
June 06<br />
June 04<br />
June 07<br />
June 05<br />
June 07<br />
June 05<br />
June 08<br />
June 06<br />
June 08<br />
June 06<br />
June 09<br />
June 07<br />
June 09<br />
June 07<br />
June 10<br />
June 08<br />
June 10<br />
June 08<br />
June 11<br />
availability (%) of overall stock<br />
June 09<br />
£ per sq ft<br />
June 11<br />
June 09<br />
£ billion<br />
9%<br />
8%<br />
7%<br />
6%<br />
5%<br />
4%<br />
3%<br />
2%<br />
1%<br />
0%<br />
June 10<br />
West End: Vacancy Rates 2003-<strong>2012</strong><br />
Source: <strong>Jones</strong> <strong>Lang</strong> <strong>LaSalle</strong><br />
Grad<br />
Over<br />
Overall<br />
2%<br />
1%<br />
1%<br />
0%<br />
Overall Grade A<br />
Rents 0%<br />
Grade A<br />
Prime core rents remained stable at £95.00 per sq ft for the<br />
West End: Prime Headline Rents and Net Effective Rents<br />
2003-<strong>2012</strong><br />
seventh consecutive quarter and rent free periods, assuming<br />
Source: <strong>Jones</strong> <strong>Lang</strong> <strong>LaSalle</strong><br />
a 10 year term, remained at 16 months.<br />
West End: Prime Headline Rents and Net Effective £120.00 Rents<br />
2002-2011 Q2<br />
West End: Prime Source: Headline <strong>Jones</strong> <strong>Lang</strong> Rents <strong>LaSalle</strong>and Net Effective Rents £100.00<br />
Investment Volumes 2002-2011 £120.00 and Q2 Yields<br />
Source: <strong>Jones</strong> <strong>Lang</strong> <strong>LaSalle</strong><br />
£1.8 billion was invested in <strong>Q4</strong> across 38 transactions.<br />
£120.00 £100.00<br />
Over the whole of <strong>2012</strong>, £5.8 billion was invested, 25%<br />
more than £100.00 2011. This £80.00 represents the highest West End<br />
investment turnover since the financial crisis and the third<br />
£80.00<br />
£60.00<br />
highest on record after 2006 (£6.3 billion) and 2007<br />
(£6.2 billion). £60.00<br />
£40.00<br />
Once again, overseas purchasers were the dominant force,<br />
£80.00<br />
£60.00<br />
£40.00<br />
£20.00<br />
£0.00<br />
Prim<br />
Net<br />
£40.00<br />
accounting for 78% of<br />
£20.00<br />
all transactions in <strong>Q4</strong>, and 64% over<br />
the whole<br />
£20.00<br />
of <strong>2012</strong>.<br />
£0.00<br />
Asian investors made up the largest purchasing group in<br />
Prime<br />
Prime<br />
Net Effective<br />
<strong>Q4</strong>, acquiring<br />
£0.00<br />
£380 million of assets in six transactions.<br />
Net Effective<br />
West End: Investment Purchases 2003-<strong>2012</strong><br />
The largest single transaction was North American, being<br />
Source: <strong>Jones</strong> <strong>Lang</strong> <strong>LaSalle</strong><br />
Blackstone’s acquisition of The Adelphi, John Adam Street,<br />
£7<br />
WC2, for £265 million, reflecting a net initial yield of 6.2%. West End: Investment Purchases 2002-2011 Q2<br />
Source: <strong>Jones</strong> <strong>Lang</strong> £6 <strong>LaSalle</strong><br />
Prime yields for sub £10 million lot sizes remained stable at<br />
4.0%, since September 2010. West End: Investment £7 Purchases £52002-2011 Q2<br />
Source: <strong>Jones</strong> <strong>Lang</strong> <strong>LaSalle</strong><br />
For lot sizes over £80 million, yields within the core are £6 sub<br />
£4<br />
4.5%. Outside West of the End: core, Investment £7<br />
prime yields Purchases for larger 2002-2011 lots sizes Q2<br />
Source: <strong>Jones</strong> <strong>Lang</strong> <strong>LaSalle</strong><br />
£5<br />
£3<br />
Prope<br />
have remained at 5.0%.<br />
£6<br />
£7<br />
£4<br />
£2<br />
£5<br />
Institu<br />
£6<br />
£3<br />
Property Companies<br />
£1<br />
£4<br />
£5<br />
£2<br />
£0<br />
Othe<br />
£3<br />
Property Companies Institutions<br />
2003 2004 2005 2006 2007 2008 2009 2010 2011 <strong>2012</strong><br />
£4<br />
£1<br />
£3<br />
£2<br />
£0<br />
Property Companies Institutions Others<br />
£1<br />
2002 2003 2004 2005 2006 2007 2008 2009 2010 2011<br />
£2<br />
£0 Institutions<br />
Others<br />
£ billion<br />
£ billion<br />
£ billion<br />
Dec 03<br />
June 10<br />
Dec 03<br />
June 11<br />
June 11<br />
Dec 04<br />
Dec 04<br />
Dec 05<br />
Dec 05<br />
Dec 06<br />
Dec 06<br />
Dec 07<br />
Dec 07<br />
Dec 08<br />
Dec 08<br />
Dec 09<br />
Dec 09<br />
Dec 10<br />
Dec 10<br />
Dec 11<br />
Dec 11<br />
Dec 12<br />
Dec 12
10 On Point • <strong>Central</strong> <strong>London</strong> <strong>Market</strong> • Fourth Quarter <strong>2012</strong><br />
The City Office <strong>Market</strong><br />
Occupier Take-up and Net Absorption<br />
Leasing activity picked up in the final quarter of the year<br />
with 1.2 million sq ft let in 53 transactions.<br />
4.2 million sq ft was let in the whole of <strong>2012</strong>, that is 22%<br />
more than 2011 when the total was 3.4 million sq ft but<br />
remains below the long term 20 year average of<br />
5.1 million sq ft. West End: Take-Up 5 2001-2011 Q1<br />
For the first time in two years, Source: the <strong>Jones</strong> City <strong>Lang</strong> delivered <strong>LaSalle</strong> a deal of<br />
more than quarter West of End: a million 5 Take-Up sq ft. 2001-2011 JLT’s acquisition 4Q1<br />
of<br />
287,500 sq ft Source: in St Botolph’s <strong>Jones</strong> <strong>Lang</strong> House <strong>LaSalle</strong> boosted take-up and<br />
accounted for 5<br />
4<br />
3<br />
23% of the space let in the quarter.<br />
Inevitably, the insurance sector accounted for the largest<br />
4<br />
3<br />
2<br />
share of take-up in the quarter, with 38% of the total.<br />
The TMT sector accounted for only 5% of take-up in <strong>Q4</strong><br />
3<br />
2<br />
1<br />
<strong>2012</strong> with only 60,400 sq ft in seven transactions. This is<br />
in stark contrast<br />
2<br />
to the rest 1 of the year. In the 0 first three<br />
2002 2003<br />
quarters, 710,000 sq ft was let to the TMT sector.<br />
The amount 1of space under 0 offer rose in <strong>Q4</strong> to 1.2 million<br />
2002 2003 2004 2005 2006 2007<br />
sq ft, a minimal increase of 9% over the quarter from 1.1<br />
million sq ft 0at the end of September. This provides for an<br />
2002 2003 2004 2005 2006 2007 2008 2009<br />
encouraging start to 2013 City: and includes Demand 18<br />
111,800 2002-2011 sq ft Q2 under<br />
Source: <strong>Jones</strong> <strong>Lang</strong><br />
offer to Amlin Plc in the Leadenhall Building 16<strong>LaSalle</strong><br />
and 90,145<br />
sq ft in 20 Fenchurch City: Demand 18<br />
Street, 2002-2011 under offer Q2 14to Liberty Re.<br />
m sq ft<br />
m sq ft<br />
Occupier Demand 12<br />
8<br />
14<br />
Demand remained broadly 10 stable in <strong>Q4</strong> at 6just over 9.8 million<br />
12<br />
sq ft, of which 5.3 million 8sq ft was active and 4 the balance<br />
10<br />
was potential demand. 6<br />
2<br />
Ogilvy and Mather<br />
8<br />
WPP’s 4 search for 250,0000<br />
sq ft extends<br />
to the City market 6 and is the 2 largest active search in this part<br />
of the market; 4 Cameron McKenna 0 and Bird & Bird are both<br />
in the market 2 for up to 200,000 sq ft and KPMG is seeking<br />
150,000 sq 0ft, as is, potentially, Mishcon de Reya.<br />
West End: Take-Up 5 2001-2011 6 Q1<br />
Source: <strong>Jones</strong> <strong>Lang</strong> <strong>LaSalle</strong><br />
Source: <strong>Jones</strong> <strong>Lang</strong> <strong>LaSalle</strong><br />
2010<br />
West End: Vacancy Rates 2002-2011 Q1<br />
Existing Supply and the Development Source: <strong>Jones</strong> <strong>Lang</strong> Pipeline <strong>LaSalle</strong><br />
West End: Vacancy Rates 2002-2011 Q1<br />
Overall supply was 8.2 million 9%<br />
Source: <strong>Jones</strong> <strong>Lang</strong> <strong>LaSalle</strong><br />
sq ft, at the end of <strong>Q4</strong> <strong>2012</strong>,<br />
which translates into a manageable 8%<br />
9%<br />
vacancy rate of 7.5%.<br />
Almost three quarters of<br />
7%<br />
8%<br />
the space available was of Grade A<br />
6%<br />
quality and 7% that equates to a Grade A vacancy rate of 5.7%.<br />
5%<br />
There was 6% just under 4.0 million sq ft speculatively under<br />
4%<br />
construction 5% at the end of <strong>Q4</strong>.<br />
availability (%) of overall stock<br />
m sq ft<br />
Source: <strong>Jones</strong> 16 <strong>Lang</strong> <strong>LaSalle</strong><br />
18<br />
14<br />
16<br />
4%<br />
3%<br />
2%<br />
1%<br />
0%<br />
June 02<br />
02<br />
m sq ft<br />
June 03<br />
availability (%) of overall stock<br />
03<br />
June 04<br />
3%<br />
2%<br />
1%<br />
0%<br />
04<br />
June 02<br />
Mar 02<br />
June 05<br />
05<br />
June 03<br />
Mar 03<br />
m sq ft<br />
June 06<br />
06<br />
June 04<br />
Mar 04<br />
m sq ft<br />
12<br />
10<br />
June 05<br />
June 07<br />
June 06<br />
June 08<br />
m sq ft<br />
June 07<br />
June 09<br />
4<br />
3<br />
2<br />
1<br />
0<br />
2004<br />
2008<br />
2005<br />
2009<br />
2011<br />
m sq ft<br />
2006<br />
8<br />
4<br />
2<br />
0<br />
2010 13<br />
City: Take-Up 2003-<strong>2012</strong><br />
Source: <strong>Jones</strong> <strong>Lang</strong> <strong>LaSalle</strong><br />
West End: Take-Up 2001-2011 Q1<br />
Source: <strong>Jones</strong> <strong>Lang</strong> <strong>LaSalle</strong><br />
June 10<br />
2002<br />
June 08<br />
June 11<br />
2003<br />
City: Demand 2002-2011 Q2<br />
June 02<br />
07<br />
Mar 05<br />
June 03<br />
08<br />
Mar 06<br />
June 04<br />
09<br />
Man 07<br />
June 05<br />
10<br />
Man 08<br />
June 06<br />
m sq ft<br />
June 09<br />
availability (%) of overall stock<br />
11<br />
Mar 09<br />
11<br />
2004<br />
9<br />
7<br />
5<br />
3<br />
1<br />
June 07<br />
2004<br />
2005<br />
Off Plan<br />
2006<br />
2007<br />
Under Construction Second hand<br />
City: 2008 Demand 2009 2003-<strong>2012</strong><br />
2010 2011<br />
Source: <strong>Jones</strong> <strong>Lang</strong> <strong>LaSalle</strong><br />
Second hand New<br />
2007<br />
Dec 03<br />
2011<br />
2005<br />
New<br />
Dec 04<br />
Active<br />
2006<br />
Dec 05<br />
2007<br />
Off Plan<br />
2008<br />
Under Construction<br />
Dec 06<br />
2008<br />
Dec 07<br />
2009<br />
Dec 08<br />
2009<br />
2010<br />
Dec 09<br />
Off Plan<br />
Off Plan<br />
Under C<br />
Off Plan<br />
Under Construction Second<br />
New<br />
Under Construction Second hand<br />
2010<br />
2011<br />
Second hand<br />
2011<br />
New<br />
Potential Rolling 12 Month Take-Up<br />
City: Vacancy Rates 2003-<strong>2012</strong><br />
Source: <strong>Jones</strong> <strong>Lang</strong> <strong>LaSalle</strong><br />
Rolling 12 Month Take-Up<br />
14%<br />
June 10<br />
12%<br />
10%<br />
8%<br />
6%<br />
4%<br />
2%<br />
0%<br />
Mar 10<br />
Dec 03<br />
June 08<br />
June 11<br />
Dec 04<br />
June 09<br />
Overall<br />
Grade A<br />
Mar 11<br />
Dec 05<br />
June 10<br />
Active<br />
Potential<br />
Dec 06<br />
June 11<br />
Dec 07<br />
Overall<br />
Grade A<br />
Dec 08<br />
Active<br />
Potential<br />
Dec 10<br />
Dec 11<br />
<strong>2012</strong><br />
New<br />
Dec 12<br />
Rolling 12 Month Take-Up<br />
Dec 09<br />
Dec 10<br />
Dec 11<br />
Dec 12<br />
Potentia<br />
Active<br />
Rolling 1<br />
Gra<br />
Ove
On Point • <strong>Central</strong> <strong>London</strong> <strong>Market</strong> • Fourth Quarter <strong>2012</strong> 11<br />
Three large projects were commenced during <strong>Q4</strong>, adding<br />
up to 431,700 sq ft. These were 71 Queen Victoria Street, EC4<br />
(187,000 sq ft); Commodity Quay, East Smithfield, E1 (143,000<br />
sq ft) and 40 Chancery City: Prime Lane, Headline WC2 (101,600 and Net sq Effective ft). Rents<br />
Three developments 2002-2011 were Q2completed in the final quarter of<br />
Source: <strong>Jones</strong> <strong>Lang</strong><br />
City:<br />
<strong>LaSalle</strong><br />
Prime Headline and Net Effective Rents<br />
<strong>2012</strong>. These were 97,700 sq 2002-2011 ft at 8 Fenchurch Q2 Place, EC3;<br />
£70.00<br />
79,300 sq ft in 26 Finsbury Source: Square, <strong>Jones</strong> EC2 <strong>Lang</strong> and <strong>LaSalle</strong> 63,000 sq ft in<br />
£60.00<br />
280 High Holborn, WC1. £70.00<br />
£ per sq ft<br />
£50.00<br />
£40.00<br />
Rents<br />
£30.00<br />
Prime core rents now £40.00 stand at £50-£57.00 per sq ft. This<br />
represents £20.00a slight (3.6%) £30.00 increase after eight consecutive<br />
quarters in which the maximum remained at £55.00 per sq ft.<br />
£10.00 £20.00<br />
Incentives, assuming a 10-year term, remained at 24 months.<br />
£0.00<br />
Towers attract significant<br />
£10.00premiums, with rents of up to<br />
£70.00 being achieved £0.00 – although around £60.00<br />
is more typical.<br />
June 02<br />
£ per sq ft<br />
June 03<br />
£60.00<br />
£50.00<br />
June 04<br />
June 02<br />
June 05<br />
June 03<br />
June 06<br />
June 04<br />
June 07<br />
June 05<br />
June 08<br />
June 06<br />
June 09<br />
June 07<br />
June 10<br />
June 08<br />
£ per sq ft<br />
June 11<br />
June 09<br />
£70.00<br />
£60.00<br />
£50.00<br />
£40.00<br />
£30.00<br />
£20.00<br />
£10.00<br />
City: Prime Headline and Net Effective Rents<br />
2003-<strong>2012</strong><br />
Source: <strong>Jones</strong> <strong>Lang</strong> <strong>LaSalle</strong><br />
£0.00<br />
Net Effective<br />
Prime Net Effective<br />
Prime<br />
City: Investment Purchases 2003-<strong>2012</strong><br />
West End: Investment Purchases 2002-2011 Q1<br />
Investment Volumes and Yields<br />
Source: <strong>Jones</strong> <strong>Lang</strong> <strong>LaSalle</strong> £10<br />
There were £2.4 million of investment transactions West End: in Investment the £7 Purchases 2002-2011 Q1<br />
City in <strong>Q4</strong> <strong>2012</strong>. This was 15% higher than Source: Q3 <strong>Jones</strong> and, <strong>Lang</strong> although <strong>LaSalle</strong><br />
£8<br />
£6<br />
not reaching the West £3.1 End: billion Investment total of Q2, £7 Purchases was still the 2002-2011 second Q1<br />
£6<br />
highest quarterly<br />
Source:<br />
volume<br />
<strong>Jones</strong> <strong>Lang</strong><br />
since<br />
<strong>LaSalle</strong><br />
£5<br />
June 2007.<br />
£6<br />
72% was purchased £7<br />
£4<br />
by overseas investors, amounting to<br />
Others<br />
£4<br />
£5<br />
£1.7 billion. £6<br />
£3<br />
£2<br />
Property Companies Institut<br />
Throughout the whole of <strong>2012</strong>, City turnover £4 amounted to<br />
£5<br />
£2<br />
Proper<br />
£0<br />
£8.9 billion, compared with £6.1 billion £3in 2011. This is the<br />
2003 2004 2005 2006 2007 2008Property 2009 Companies<br />
2010 2011 Institutions <strong>2012</strong><br />
£4<br />
highest volume since 2007 when £9.4 billion changed hands. £1<br />
£2<br />
Chinese Overseas £3 Land and Investment (COLI) bought £0<br />
Property Companies Institutions Others<br />
£1<br />
1 Finsbury Circus for £152 million, reflecting a net initial yield<br />
2002 2003 2004 2005 2006 2007 2008 2009 2010 2011<br />
£2<br />
of 5.25% and a capital value of £729 £0 per sq ft. The building<br />
Institutions<br />
Others<br />
£1<br />
2002 2003 2004 2005 2006 2007 2008 2009 2010 2011<br />
is 208,536 sq ft and is multi-let, although 80% of the rental<br />
income is secured £0 against Stephenson Harwood until 2025. “Prime Others core rents grew by 3.6%<br />
2002 2003 2004 2005 2006 2007 2008 2009 2010 2011<br />
Other significant transactions include: St Martin’s Court,<br />
10 Paternoster Row, bought by Oxford Properties for £110<br />
in <strong>Q4</strong>, to £57.00 per sq ft”<br />
million, reflecting a net initial yield of 5.48% and Winchester<br />
House, 75 <strong>London</strong> Wall, a 313,000 sq ft building sold for £250<br />
million to Invesco/CIC equating to a net initial yield of 5.4%.<br />
Prime initial yields now range from 5.0% to 5.25% depending<br />
on the lot size. Given the volume of demand relative to<br />
supply, they are likely to remain at this level.<br />
£ billion<br />
£ billion<br />
£ billion<br />
£ billion<br />
June 10<br />
Dec 03<br />
June 11<br />
Dec 04<br />
Dec 05<br />
Dec 06<br />
Source: <strong>Jones</strong> <strong>Lang</strong> <strong>LaSalle</strong><br />
£12<br />
Dec 07<br />
Dec 08<br />
Dec 09<br />
Dec 10<br />
Dec 11<br />
Dec 12<br />
Net<br />
Prim
12 On Point • <strong>Central</strong> <strong>London</strong> <strong>Market</strong> • Fourth Quarter <strong>2012</strong><br />
The Docklands & East <strong>London</strong> Office <strong>Market</strong>s<br />
Occupier Take-up and Net Absorption<br />
Just over 40,000 sq ft was let in Docklands in <strong>Q4</strong>, in three<br />
transactions.<br />
The largest of the three transactions was 21,800 sq ft,<br />
which Deutsche Bourse took in 11 Westferry Circus, E14.<br />
This takes the total for the whole year to 474,700 sq ft, a<br />
West End: Take-Up 5 2001-2011 Q1<br />
similar volume to 2011 and 2009 but below the long term 20 4<br />
year average of 1.3 million<br />
Source:<br />
in this<br />
<strong>Jones</strong><br />
volatile<br />
<strong>Lang</strong> <strong>LaSalle</strong><br />
part of the market.<br />
West End: 5 Take-Up 2001-20114<br />
3<br />
Q1<br />
Source: <strong>Jones</strong> <strong>Lang</strong> <strong>LaSalle</strong><br />
5<br />
Occupier Demand<br />
Overall demand, including active and potential, ended the<br />
0<br />
Off Plan<br />
4<br />
3<br />
2<br />
1<br />
2003 2004 2005 2006<br />
year at 1.8 million sq ft.<br />
2007 2008<br />
Of this, active searches account for 620,800 sq ft and<br />
Off Plan Under Construction<br />
3<br />
2<br />
1<br />
0<br />
2002 2003 2004 2005 2006 2007 2008 2009<br />
the balance is potential, including the Thomson Reuters’<br />
requirement for up to 750,000 sq ft.<br />
Under Construction Second hand<br />
2<br />
1<br />
0<br />
Docklands: Demand 2003-<strong>2012</strong><br />
2002 2003 2004 2005 2006 2007 2008 2009 2010 2011<br />
Professional services firms account for the two largest<br />
Source: <strong>Jones</strong> <strong>Lang</strong> <strong>LaSalle</strong><br />
Second hand New<br />
requirements 1 in the market, 0 although neither search is<br />
6<br />
2002 2003 2004 2005 2006 2007 2008 2009 2010 2011<br />
confined to Docklands.<br />
West End: Demand 2002-2011 Q1<br />
New<br />
0<br />
Source: <strong>Jones</strong> <strong>Lang</strong> <strong>LaSalle</strong><br />
2002 2003 2004 West 2005 End: 2006 Demand 2007 2002-2011 2008 2009 Q1 2010 2011<br />
m sq ft<br />
m sq ft<br />
4<br />
Existing Supply West and End: the Development 12 Demand 2002-2011 Pipeline 10 Q1<br />
Total supply has Source: crept <strong>Jones</strong> upwards <strong>Lang</strong> <strong>LaSalle</strong> over the second half of <strong>2012</strong>,<br />
10<br />
8<br />
to 1.4 million 12 sq ft, after dipping in the early months of the<br />
year. It is now back to the 8same level as <strong>Q4</strong> 6 2011.<br />
10<br />
The vacancy rate is 7.0%, almost all of which is Grade A<br />
(6.7%) space, although much<br />
6<br />
of it is second<br />
4<br />
hand.<br />
m sq ft<br />
8<br />
6<br />
Rents<br />
2<br />
0<br />
4<br />
Prime rents were £38.50 per sq ft at the end of <strong>Q4</strong>,<br />
0<br />
2<br />
although none of the transactions completed in this quarter<br />
were at that level.<br />
0<br />
Mar 02<br />
Mar 03<br />
m sq ft<br />
Mar 04<br />
Mar 05<br />
West End: Take-Up 5 2001-2011 3 Q1<br />
Source: <strong>Jones</strong> <strong>Lang</strong> <strong>LaSalle</strong><br />
West End: Vacancy Rates 2002-2011 Q1<br />
Investment Volumes<br />
Source: <strong>Jones</strong> <strong>Lang</strong> <strong>LaSalle</strong><br />
There was one West investment End: Vacancy transaction Rates in 2002-2011 Docklands Q1<br />
9%<br />
in <strong>Q4</strong>;<br />
Source: <strong>Jones</strong> <strong>Lang</strong> <strong>LaSalle</strong><br />
6 Greenwich View Place 8% was sold for £41 million to Legal<br />
9%<br />
and General by the occupier, 7% Telstra, which has taken a<br />
8%<br />
25-year lease with RPI uplifts. 6% The yield equates to 5.76%.<br />
availability (%) of overall stock<br />
7%<br />
6%<br />
5%<br />
4%<br />
3%<br />
2%<br />
1%<br />
0%<br />
ar 02<br />
availability (%) of overall stock<br />
ar 03<br />
4<br />
Mar 06<br />
m sq ft<br />
12<br />
Source: <strong>Jones</strong> <strong>Lang</strong> <strong>LaSalle</strong><br />
Mar 02<br />
5%<br />
4%<br />
3%<br />
2%<br />
1%<br />
0%<br />
ar 04<br />
Mar 02<br />
ar 05<br />
Mar 03<br />
Mar 03<br />
m sq ft<br />
ar 06<br />
Mar 04<br />
Mar 04<br />
2<br />
3<br />
Mar 02<br />
Mar 07<br />
an 07<br />
Mar 05<br />
Mar 05<br />
Mar 03<br />
Mar 08<br />
an 08<br />
Mar 06<br />
Mar 06<br />
m sq ft<br />
Mar 04<br />
Mar 09<br />
ar 09<br />
Mar 07<br />
Man 07<br />
2<br />
m sq ft<br />
4<br />
2<br />
1<br />
Docklands: Take-Up 2003-<strong>2012</strong><br />
Source: <strong>Jones</strong> <strong>Lang</strong> <strong>LaSalle</strong><br />
West End: Take-Up 2001-2011 Q1<br />
Source: <strong>Jones</strong> <strong>Lang</strong> <strong>LaSalle</strong><br />
Mar 05<br />
Mar 10<br />
ar 10<br />
Mar 08<br />
Man 08<br />
Mar 06<br />
Mar 11<br />
ar 11<br />
Mar 09<br />
availability (%) of overall stock<br />
m sq ft<br />
Mar 09<br />
4<br />
2<br />
0<br />
Mar 07<br />
Dec 03<br />
Dec 04<br />
Active<br />
Dec 05<br />
Dec 06<br />
Dec 07<br />
Dec 08<br />
2010<br />
Off Pla<br />
Off Plan<br />
Under<br />
Off Plan<br />
Under ConstructionSecon<br />
New<br />
Under Construction Second hand<br />
2009<br />
2010<br />
Second hand<br />
2011<br />
New<br />
Dec 09<br />
Rolling 12 Month Take-Up<br />
Docklands: Potential Vacancy Rates 2003-<strong>2012</strong><br />
Source: <strong>Jones</strong> <strong>Lang</strong> <strong>LaSalle</strong><br />
Rolling 12 Month Take-Up<br />
16%<br />
14%<br />
12%<br />
10%<br />
8%<br />
6%<br />
4%<br />
2%<br />
0%<br />
Mar 10<br />
Dec 03<br />
Mar 10<br />
Mar 08<br />
Mar 11<br />
Dec 04<br />
Mar 09<br />
Overall<br />
Mar 11<br />
Grade A<br />
Dec 05<br />
Mar 10<br />
Active<br />
Potential<br />
Dec 06<br />
Mar 11<br />
Dec 07<br />
Overall<br />
Grade A<br />
Dec 08<br />
Active<br />
Potential<br />
Dec 10<br />
2011<br />
Dec 11<br />
<strong>2012</strong><br />
New<br />
Dec 12<br />
Rolling 12 Month Take-Up<br />
Dec 09<br />
Dec 10<br />
Dec 11<br />
Dec 12<br />
Poten<br />
Active<br />
Rollin<br />
Gra<br />
Ove
On Point • <strong>Central</strong> <strong>London</strong> <strong>Market</strong> • Fourth Quarter <strong>2012</strong> 13<br />
Headline Transactions<br />
West End<br />
Kingsley House,<br />
1A Wimpole Street, W1<br />
Size: 61,037 sq ft<br />
Tenant: Coca Cola<br />
Rent: £60.00 per sq ft<br />
Status: Under construction<br />
95 Wigmore Street, W1<br />
Size: 40,000 sq ft<br />
Tenant: Lane Clark and Peacock<br />
Rent: £77.50 per sq ft<br />
Status: Under construction<br />
The Adelphi, John Adam Street, WC2<br />
Purchaser: Blackstone<br />
<strong>Report</strong>ed price: £265 million<br />
Est initial yield: 6.2%<br />
78 St James’s Street, SW1<br />
Purchaser: State Oil Fund of Azerbaijan<br />
(SOFAZ)<br />
Price: £177.35m<br />
NIY: 4.50%<br />
City<br />
The St Botolph Building,<br />
Houndsditch, EC3<br />
Size: 287,960 sq ft<br />
Tenant: JLT<br />
Rent: Confidential<br />
1 Finsbury Circus, EC2<br />
Purchaser:Chinese Overseas Land<br />
and Investment (COLI)<br />
<strong>Report</strong>ed price: £152 million<br />
Est initial yield: 5.25%<br />
70 Mark Lane, EC3<br />
Size: 84,000 sq ft<br />
Tenant: Miller Insurance<br />
Rent: £54.50 per sq ft<br />
Status: Under construction<br />
St Martin’s Ct, 10 Paternoster<br />
Row EC4<br />
Purchaser: Oxford Properties<br />
<strong>Report</strong>ed price: £110 million<br />
Est initial yield: 5.48%<br />
Docklands & East <strong>London</strong><br />
11 Westferry Circus, E14<br />
Size: 21,750 sq ft<br />
Tenant: Deutsche Bourse<br />
Rent: £27.50 per sq ft<br />
Status: Refurbished<br />
6 Greenwich View Place E4<br />
Purchaser: Legal and General<br />
<strong>Report</strong>ed price: £41 million<br />
Est initial yield: 5.76%
14 On Point • <strong>Central</strong> <strong>London</strong> <strong>Market</strong> • Fourth Quarter <strong>2012</strong><br />
Rental Conditions across <strong>Central</strong> <strong>London</strong><br />
West End Village<br />
Belgravia & Marylebone North of<br />
Knightsbridge Covent Garden & Euston Mayfair Oxford Street Paddington Soho St James’s Victoria<br />
max<br />
min<br />
average<br />
% annual change (average)<br />
£67.50 £65.00 £55.00 £95.00 £80.00 £57.50 £65.00 £95.00 £65.00<br />
£40.00 £40.00 £30.00 £62.50 £40.00 £32.50 £40.00 £45.00 £35.00<br />
£52.89 £47.84 £39.55 £73.94 £48.70 £42.95 £44.74 £64.50 £43.98<br />
4.1% 2.4% 9.2% 3.1% 7.6% 5.0% 12.2% 2.8% 3.8%<br />
City Village<br />
<strong>Central</strong> Core City Midtown Eastern Eastern Fringe Northern Northern Fringe Southbank Southern Western<br />
max<br />
min<br />
average<br />
% annual change (average)<br />
£57.00 £55.00 £55.00 £40.00 £55.00 £45.00 £47.50 £52.50 £54.50<br />
£50.00 £35.00 £30.00 £20.00 £35.00 £30.00 £35.00 £40.00 £35.00<br />
£53.50 £44.19 £42.00 £29.67 £46.45 £33.44 £41.63 £47.00 £47.21<br />
0.7% 2.2% 2.1% 4.7% 3.7% 15.9% 2.7% 2.2% 3.1%
On Point • <strong>Central</strong> <strong>London</strong> <strong>Market</strong> • Fourth Quarter <strong>2012</strong> 15<br />
Town Planning<br />
LEGISLATIVE CHANGES – HIGHLIGHTS<br />
Greater <strong>London</strong> Authority<br />
The Greater <strong>London</strong> Authority, in partnership with <strong>London</strong><br />
Boroughs is issuing a ‘call for sites’ to be included in the <strong>London</strong>wide<br />
Strategic Housing Land Availability Assessment (SHLAA).<br />
All sites over 0.25 ha will be considered. If you have any sites<br />
you think should be included, please contact the planning team.<br />
The call for sites will be open until 28th January.<br />
Boroughs<br />
The Royal Borough of Kensington and Chelsea is consulting<br />
on the following policy documents until January 31st 2013:<br />
Basements, Conservation & Design, Involving People in Planning<br />
and Miscellaneous Matters. Camden Council is consulting on the<br />
Fitzrovia Area Action Plan which is at the advanced ‘proposed<br />
submission’ stage, until January 31st.<br />
Camden is consulting on its Local List until 22nd January – buildings<br />
that will have a local (non-statutory) listing. If you have buildings that<br />
may be at risk, or benefit from, local listing, contact the planning team.<br />
The City of <strong>London</strong> will seek views on a single plan for the district<br />
combining Core Strategy and development management policies,<br />
to be known as its Local Plan, in January 2013.<br />
Due to the release of the NPPF Westminster has reviewed its<br />
LDF documents and is preparing to put out to consultation a<br />
merged Core Strategy and City Management Plan, which will<br />
replace the UDP to create a new main/single development plan for<br />
Westminster. Westminster will be consulting in January 2013.<br />
Applications<br />
Communications House, 48 Leicester Square, received a<br />
resolution to grant permission on 13th December at Westminster’s<br />
Planning Committee for demolition and reconstruction of<br />
the current building to provide a nine storey employment-led<br />
development with retail uses on the lower floors.<br />
On 13th December Wandsworth Planning Committee permitted<br />
the first phase of Battersea Power Station redevelopment. It will<br />
provide 800 homes, a hotel and space for cafes, restaurants, bars,<br />
a gym, pool, spa, theatre, office studios and a new six-acre public<br />
park right on the bank of the Thames.<br />
To discuss how these changes may affect your development,<br />
contact Guy Bransby on 020 7399 5409<br />
or Jeff Field on 020 7852 4742.<br />
Definition of Terms<br />
Floorspace Threshold – Data refers to office floorspace in units of 5,380 sq ft and above.<br />
Grading – A subjective assessment taking into account specification, floorplate efficiency<br />
and image.<br />
Take-Up – Floorspace acquired for occupation by leasing, pre-leasing or purchasing a freehold<br />
or long leasehold interest.<br />
Supply – Floorspace which is on the market and available for occupation. Floorspace which<br />
is under offer prior to a contractual commitment is included. Speculative development prior to<br />
practical completion is excluded.<br />
Speculative Development – Floorspace under construction or comprehensive modernisation<br />
which will be available for speculative letting (or sale). The forecast of development<br />
completions relates only to developments currently under construction.<br />
Net Absorption – a measure of the change in occupied stock between periods.<br />
Demand – Some applicants search across two or three market areas. In such cases their<br />
demand appears in the total for each area. However, when calculating total <strong>Central</strong> <strong>London</strong><br />
demand, duplicates are eliminated.<br />
Active Demand – Organisations with a declared requirement for office accommodation which<br />
are actively in the market to acquire floorspace in the short term.<br />
Potential Demand – Organisations with a potential requirement for office accommodation, but<br />
without a finalised brief in terms of timing.<br />
Prime Rent – An opinion of the highest rent (excluding incentives) achievable upon a letting<br />
agreed at the quarter-end of a notional 10,000 sq ft unit of the best quality office space in a<br />
prime location.<br />
Net effective rents are calculated against our prime headline rent values and assume a<br />
10-year term, a notional three month fit-out period and amortisation over 10 years. In practice<br />
net effective rents are subject to far more variability related to the specific characteristics of the<br />
individual premises.<br />
Prime Yield – An opinion of the yield which would be appropriate for a freehold Grade A<br />
office investment in a prime location let at a current market rent to a tenant with a strong<br />
financial covenant.<br />
Investment Turnover – Capital transactions comprising freehold and long leasehold acquisitions<br />
for investment, owner occupation or development. Corporate transactions are excluded.<br />
Stratford<br />
Camden<br />
Regents<br />
Park<br />
Marylebone/Euston<br />
North of<br />
Oxford Street<br />
Mayfair<br />
Bloomsbury<br />
Covent<br />
Soho Garden<br />
Northern<br />
Fringe<br />
City<br />
Midtown<br />
South Bank<br />
<strong>Central</strong> City<br />
Eastern<br />
Fringe<br />
Wapping<br />
Canary<br />
Wharf<br />
Royal Docks<br />
Isle of<br />
Dogs<br />
Greenwich<br />
Peninsula
Contacts<br />
Neil Prime<br />
Director<br />
Head of UK Office Agency<br />
+44(0)20 7399 5190<br />
neil.prime@eu.jll.com<br />
Damian Corbett<br />
Director<br />
Head of <strong>London</strong> Capital <strong>Market</strong>s<br />
+44(0)20 7399 5286<br />
damian.corbett@eu.jll.com<br />
Jon Neale<br />
Head of Research - UK<br />
EMEA Research<br />
+44(0)20 7852 4685<br />
jon.neale@eu.jll.com<br />
Jonathan Evans<br />
Director<br />
West End Agency & Development<br />
+44(0)20 7399 5950<br />
jonathan.evans@eu.jll.com<br />
Julian Sandbach<br />
Director<br />
West End Investment<br />
+44 (0)020 7399 5973<br />
julian.sandbach@eu.jll.com<br />
Dan Burn<br />
Director<br />
City Agency<br />
+44 (0)20 7399 5966<br />
dan.burn@eu.jll.com<br />
Chris Northam<br />
Director<br />
City Investment<br />
+44(0)20 7399 5826<br />
chris.northam@eu.jll.com<br />
Angus Goswell<br />
Director<br />
City & Canary Wharf Agency<br />
+44 (0)20 7399 5508<br />
angus.goswell@eu.jll.com<br />
Sam McMillen<br />
<strong>Market</strong>ing Manager<br />
EMEA <strong>Market</strong>ing<br />
+44(0)20 7399 5964<br />
sam.mcmillen@eu.jll.com<br />
OnPoint reports from <strong>Jones</strong> <strong>Lang</strong> <strong>LaSalle</strong> include quarterly and annual highlights of real estate activity, performance and specialised<br />
surveys and forecasts that uncover emerging trends.<br />
www.joneslanglasalle.co.uk<br />
COPYRIGHT © JONES LANG LASALLE IP, INC. 2013. All rights reserved. No part of this publication may be reproduced or transmitted in any form or by any means without prior written<br />
consent of <strong>Jones</strong> <strong>Lang</strong> <strong>LaSalle</strong>. It is based on material that we believe to be reliable. Whilst every effort has been made to ensure its accuracy, we cannot offer any warranty that it contains<br />
no factual errors. We would like to be told of any such errors in order to correct them.<br />
Printed on recycled paper


![Presseinformation inklusive Charts [PDF] - Jones Lang LaSalle](https://img.yumpu.com/23689734/1/184x260/presseinformation-inklusive-charts-pdf-jones-lang-lasalle.jpg?quality=85)