Hixon 1 Concentrations and identities of fecal coliform bacteria from ...
Hixon 1 Concentrations and identities of fecal coliform bacteria from ...
Hixon 1 Concentrations and identities of fecal coliform bacteria from ...

Create successful ePaper yourself
Turn your PDF publications into a flip-book with our unique Google optimized e-Paper software.
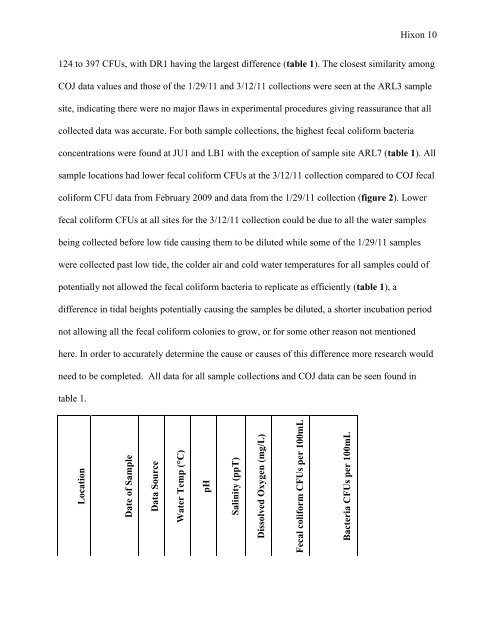
Location<br />
Date <strong>of</strong> Sample<br />
Data Source<br />
Water Temp (°C)<br />
pH<br />
Salinity (ppT)<br />
Dissolved Oxygen (mg/L)<br />
Fecal <strong>coliform</strong> CFUs per 100mL<br />
Bacteria CFUs per 100mL<br />
<strong>Hixon</strong> 10<br />
124 to 397 CFUs, with DR1 having the largest difference (table 1). The closest similarity among<br />
COJ data values <strong>and</strong> those <strong>of</strong> the 1/29/11 <strong>and</strong> 3/12/11 collections were seen at the ARL3 sample<br />
site, indicating there were no major flaws in experimental procedures giving reassurance that all<br />
collected data was accurate. For both sample collections, the highest <strong>fecal</strong> <strong>coliform</strong> <strong>bacteria</strong><br />
concentrations were found at JU1 <strong>and</strong> LB1 with the exception <strong>of</strong> sample site ARL7 (table 1). All<br />
sample locations had lower <strong>fecal</strong> <strong>coliform</strong> CFUs at the 3/12/11 collection compared to COJ <strong>fecal</strong><br />
<strong>coliform</strong> CFU data <strong>from</strong> February 2009 <strong>and</strong> data <strong>from</strong> the 1/29/11 collection (figure 2). Lower<br />
<strong>fecal</strong> <strong>coliform</strong> CFUs at all sites for the 3/12/11 collection could be due to all the water samples<br />
being collected before low tide causing them to be diluted while some <strong>of</strong> the 1/29/11 samples<br />
were collected past low tide, the colder air <strong>and</strong> cold water temperatures for all samples could <strong>of</strong><br />
potentially not allowed the <strong>fecal</strong> <strong>coliform</strong> <strong>bacteria</strong> to replicate as efficiently (table 1), a<br />
difference in tidal heights potentially causing the samples be diluted, a shorter incubation period<br />
not allowing all the <strong>fecal</strong> <strong>coliform</strong> colonies to grow, or for some other reason not mentioned<br />
here. In order to accurately determine the cause or causes <strong>of</strong> this difference more research would<br />
need to be completed. All data for all sample collections <strong>and</strong> COJ data can be seen found in<br />
table 1.