Hixon 1 Concentrations and identities of fecal coliform bacteria from ...
Hixon 1 Concentrations and identities of fecal coliform bacteria from ...
Hixon 1 Concentrations and identities of fecal coliform bacteria from ...

Create successful ePaper yourself
Turn your PDF publications into a flip-book with our unique Google optimized e-Paper software.
<strong>Hixon</strong> 12<br />
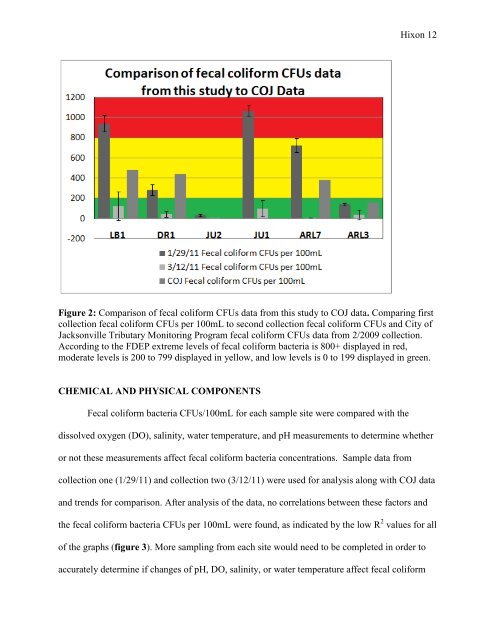
Figure 2: Comparison <strong>of</strong> <strong>fecal</strong> <strong>coliform</strong> CFUs data <strong>from</strong> this study to COJ data. Comparing first<br />
collection <strong>fecal</strong> <strong>coliform</strong> CFUs per 100mL to second collection <strong>fecal</strong> <strong>coliform</strong> CFUs <strong>and</strong> City <strong>of</strong><br />
Jacksonville Tributary Monitoring Program <strong>fecal</strong> <strong>coliform</strong> CFUs data <strong>from</strong> 2/2009 collection.<br />
According to the FDEP extreme levels <strong>of</strong> <strong>fecal</strong> <strong>coliform</strong> <strong>bacteria</strong> is 800+ displayed in red,<br />
moderate levels is 200 to 799 displayed in yellow, <strong>and</strong> low levels is 0 to 199 displayed in green.<br />
CHEMICAL AND PHYSICAL COMPONENTS<br />
Fecal <strong>coliform</strong> <strong>bacteria</strong> CFUs/100mL for each sample site were compared with the<br />
dissolved oxygen (DO), salinity, water temperature, <strong>and</strong> pH measurements to determine whether<br />
or not these measurements affect <strong>fecal</strong> <strong>coliform</strong> <strong>bacteria</strong> concentrations. Sample data <strong>from</strong><br />
collection one (1/29/11) <strong>and</strong> collection two (3/12/11) were used for analysis along with COJ data<br />
<strong>and</strong> trends for comparison. After analysis <strong>of</strong> the data, no correlations between these factors <strong>and</strong><br />
the <strong>fecal</strong> <strong>coliform</strong> <strong>bacteria</strong> CFUs per 100mL were found, as indicated by the low R 2 values for all<br />
<strong>of</strong> the graphs (figure 3). More sampling <strong>from</strong> each site would need to be completed in order to<br />
accurately determine if changes <strong>of</strong> pH, DO, salinity, or water temperature affect <strong>fecal</strong> <strong>coliform</strong>