Hixon 1 Concentrations and identities of fecal coliform bacteria from ...
Hixon 1 Concentrations and identities of fecal coliform bacteria from ...
Hixon 1 Concentrations and identities of fecal coliform bacteria from ...
You also want an ePaper? Increase the reach of your titles
YUMPU automatically turns print PDFs into web optimized ePapers that Google loves.
<strong>Hixon</strong> 9<br />
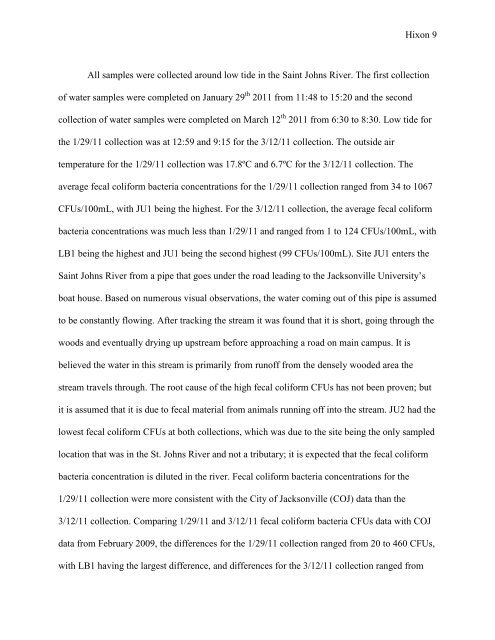
All samples were collected around low tide in the Saint Johns River. The first collection<br />
<strong>of</strong> water samples were completed on January 29 th 2011 <strong>from</strong> 11:48 to 15:20 <strong>and</strong> the second<br />
collection <strong>of</strong> water samples were completed on March 12 th 2011 <strong>from</strong> 6:30 to 8:30. Low tide for<br />
the 1/29/11 collection was at 12:59 <strong>and</strong> 9:15 for the 3/12/11 collection. The outside air<br />
temperature for the 1/29/11 collection was 17.8ºC <strong>and</strong> 6.7ºC for the 3/12/11 collection. The<br />
average <strong>fecal</strong> <strong>coliform</strong> <strong>bacteria</strong> concentrations for the 1/29/11 collection ranged <strong>from</strong> 34 to 1067<br />
CFUs/100mL, with JU1 being the highest. For the 3/12/11 collection, the average <strong>fecal</strong> <strong>coliform</strong><br />
<strong>bacteria</strong> concentrations was much less than 1/29/11 <strong>and</strong> ranged <strong>from</strong> 1 to 124 CFUs/100mL, with<br />
LB1 being the highest <strong>and</strong> JU1 being the second highest (99 CFUs/100mL). Site JU1 enters the<br />
Saint Johns River <strong>from</strong> a pipe that goes under the road leading to the Jacksonville University’s<br />
boat house. Based on numerous visual observations, the water coming out <strong>of</strong> this pipe is assumed<br />
to be constantly flowing. After tracking the stream it was found that it is short, going through the<br />
woods <strong>and</strong> eventually drying up upstream before approaching a road on main campus. It is<br />
believed the water in this stream is primarily <strong>from</strong> run<strong>of</strong>f <strong>from</strong> the densely wooded area the<br />
stream travels through. The root cause <strong>of</strong> the high <strong>fecal</strong> <strong>coliform</strong> CFUs has not been proven; but<br />
it is assumed that it is due to <strong>fecal</strong> material <strong>from</strong> animals running <strong>of</strong>f into the stream. JU2 had the<br />
lowest <strong>fecal</strong> <strong>coliform</strong> CFUs at both collections, which was due to the site being the only sampled<br />
location that was in the St. Johns River <strong>and</strong> not a tributary; it is expected that the <strong>fecal</strong> <strong>coliform</strong><br />
<strong>bacteria</strong> concentration is diluted in the river. Fecal <strong>coliform</strong> <strong>bacteria</strong> concentrations for the<br />
1/29/11 collection were more consistent with the City <strong>of</strong> Jacksonville (COJ) data than the<br />
3/12/11 collection. Comparing 1/29/11 <strong>and</strong> 3/12/11 <strong>fecal</strong> <strong>coliform</strong> <strong>bacteria</strong> CFUs data with COJ<br />
data <strong>from</strong> February 2009, the differences for the 1/29/11 collection ranged <strong>from</strong> 20 to 460 CFUs,<br />
with LB1 having the largest difference, <strong>and</strong> differences for the 3/12/11 collection ranged <strong>from</strong>


