surface & stormwater management performance audit final report
surface & stormwater management performance audit final report
surface & stormwater management performance audit final report

You also want an ePaper? Increase the reach of your titles
YUMPU automatically turns print PDFs into web optimized ePapers that Google loves.
Surface & Storm Water Management Performance Audit<br />
Kitsap County, Washington<br />
Final Report<br />
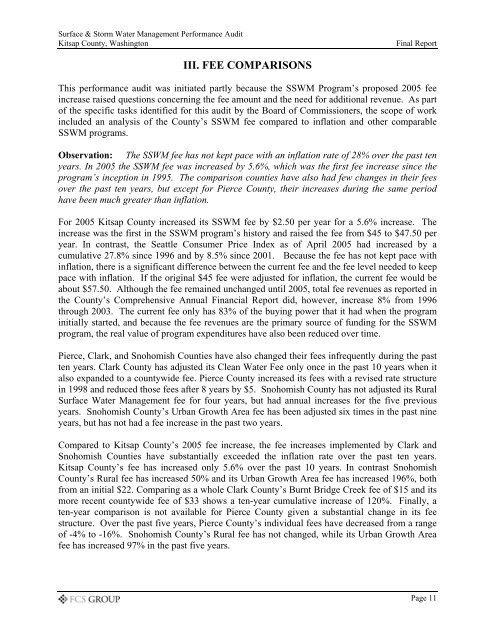
III. FEE COMPARISONS<br />
This <strong>performance</strong> <strong>audit</strong> was initiated partly because the SSWM Program’s proposed 2005 fee<br />
increase raised questions concerning the fee amount and the need for additional revenue. As part<br />
of the specific tasks identified for this <strong>audit</strong> by the Board of Commissioners, the scope of work<br />
included an analysis of the County’s SSWM fee compared to inflation and other comparable<br />
SSWM programs.<br />
Observation: The SSWM fee has not kept pace with an inflation rate of 28% over the past ten<br />
years. In 2005 the SSWM fee was increased by 5.6%, which was the first fee increase since the<br />
program’s inception in 1995. The comparison counties have also had few changes in their fees<br />
over the past ten years, but except for Pierce County, their increases during the same period<br />
have been much greater than inflation.<br />
For 2005 Kitsap County increased its SSWM fee by $2.50 per year for a 5.6% increase. The<br />
increase was the first in the SSWM program’s history and raised the fee from $45 to $47.50 per<br />
year. In contrast, the Seattle Consumer Price Index as of April 2005 had increased by a<br />
cumulative 27.8% since 1996 and by 8.5% since 2001. Because the fee has not kept pace with<br />
inflation, there is a significant difference between the current fee and the fee level needed to keep<br />
pace with inflation. If the original $45 fee were adjusted for inflation, the current fee would be<br />
about $57.50. Although the fee remained unchanged until 2005, total fee revenues as <strong>report</strong>ed in<br />
the County’s Comprehensive Annual Financial Report did, however, increase 8% from 1996<br />
through 2003. The current fee only has 83% of the buying power that it had when the program<br />
initially started, and because the fee revenues are the primary source of funding for the SSWM<br />
program, the real value of program expenditures have also been reduced over time.<br />
Pierce, Clark, and Snohomish Counties have also changed their fees infrequently during the past<br />
ten years. Clark County has adjusted its Clean Water Fee only once in the past 10 years when it<br />
also expanded to a countywide fee. Pierce County increased its fees with a revised rate structure<br />
in 1998 and reduced those fees after 8 years by $5. Snohomish County has not adjusted its Rural<br />
Surface Water Management fee for four years, but had annual increases for the five previous<br />
years. Snohomish County’s Urban Growth Area fee has been adjusted six times in the past nine<br />
years, but has not had a fee increase in the past two years.<br />
Compared to Kitsap County’s 2005 fee increase, the fee increases implemented by Clark and<br />
Snohomish Counties have substantially exceeded the inflation rate over the past ten years.<br />
Kitsap County’s fee has increased only 5.6% over the past 10 years. In contrast Snohomish<br />
County’s Rural fee has increased 50% and its Urban Growth Area fee has increased 196%, both<br />
from an initial $22. Comparing as a whole Clark County’s Burnt Bridge Creek fee of $15 and its<br />
more recent countywide fee of $33 shows a ten-year cumulative increase of 120%. Finally, a<br />
ten-year comparison is not available for Pierce County given a substantial change in its fee<br />
structure. Over the past five years, Pierce County’s individual fees have decreased from a range<br />
of -4% to -16%. Snohomish County’s Rural fee has not changed, while its Urban Growth Area<br />
fee has increased 97% in the past five years.<br />
Page 11