- Page 1 and 2: Kitsap County, Washington 2011 Budg
- Page 3 and 4: KITSAP COUNTY 2010 BUDGET Approved
- Page 5 and 6: The Government Finance Officers Ass
- Page 7 and 8: T A B L E O F C O N T E N T S Page
- Page 9: KITSAP COUNTY OFFICIALS ELECTED OFF
- Page 12 and 13: County Mission Kitsap County govern
- Page 14 and 15: This page intentionally left blank
- Page 16 and 17: This page intentionally left blank
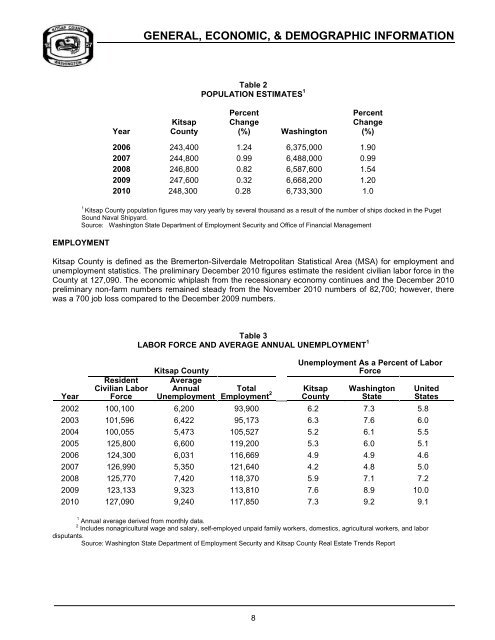
- Page 20 and 21: GENERAL, ECONOMIC, & DEMOGRAPHIC IN
- Page 22 and 23: GENERAL, ECONOMIC, & DEMOGRAPHIC IN
- Page 24 and 25: GENERAL, ECONOMIC, & DEMOGRAPHIC IN
- Page 26 and 27: GENERAL, ECONOMIC, & DEMOGRAPHIC IN
- Page 28 and 29: This page intentionally left blank
- Page 30: This page intentionally left blank
- Page 34 and 35: BUDGET OVERVIEW Core Services: Ther
- Page 36 and 37: BUDGET OVERVIEW Debt Service Funds:
- Page 38 and 39: BUDGET OVERVIEW $0 Major Revenue Pe
- Page 40 and 41: BUDGET OVERVIEW Special Revenue Fun
- Page 42 and 43: Statement of Changes in Fund Balanc
- Page 44 and 45: This page intentionally left blank
- Page 46: 2010 Calendar for 2011 Annual Budge
- Page 60 and 61: This page intentionally left blank
- Page 62 and 63: This page intentionally left blank
- Page 64 and 65: COUNT ASSESSOR g. Responded to all
- Page 66 and 67: COUNT ASSESSOR Funding Consequences
- Page 68 and 69:
AUDITOR I. Purpose: The County Audi
- Page 70 and 71:
AUDITOR III. 2010 Accomplishments:
- Page 72 and 73:
AUDITOR Program Title: Financial Se
- Page 74 and 75:
AUDITOR Workload Indicators 2011 20
- Page 76 and 77:
AUDITOR Detailed Program Descriptio
- Page 78 and 79:
AUDITOR Detailed Program Descriptio
- Page 80 and 81:
AUDITOR Expenditures: 2011 Budget S
- Page 82 and 83:
BOARD OF COMMISSIONERS Significant
- Page 84 and 85:
BOARD OF COMMISSIONERS Mandates and
- Page 86 and 87:
BOARD OF COMMISSIONERS Program Just
- Page 88 and 89:
BOARD OF COMMISSIONERS Partnerships
- Page 90 and 91:
BOARD OF COMMISSIONERS Full Time Eq
- Page 92 and 93:
CLERK Expenditure by Catagory Inter
- Page 94 and 95:
CLERK Mandates and Contractual Agre
- Page 96 and 97:
CLERK Program Title: Public Defende
- Page 98 and 99:
CLERK Program Justification: This p
- Page 100 and 101:
CLERK Program Title: Passport Desk
- Page 102 and 103:
CLERK Full Time Equivalents 2011 Fu
- Page 104 and 105:
CORONER III. 2010 Accomplishments:
- Page 106 and 107:
DISTRICT COURT I. Purpose: District
- Page 108 and 109:
DISTRICT COURT Partnerships/ Collab
- Page 110 and 111:
DISTRICT COURT Program Title: Colle
- Page 112 and 113:
DISTRICT COURT Budget Totals 2011 P
- Page 114 and 115:
DISTRICT COURT Full Time Equivalent
- Page 116 and 117:
FACILITIES MAINTENANCE Significant
- Page 118 and 119:
FACILITIES MAINTENANCE Categories 2
- Page 120 and 121:
FACILITIES MAINTENANCE Maint Sq Fee
- Page 122 and 123:
FACILITIES MAINTENANCE Funding Cons
- Page 124 and 125:
GENERAL ADMINISTRATION & OPERATIONS
- Page 126 and 127:
JUVENILE SERVICES I. Purpose - Miss
- Page 128 and 129:
JUVENILE SERVICES Administrative Se
- Page 130 and 131:
JUVENILE SERVICES Program Title: Re
- Page 132 and 133:
JUVENILE SERVICES Program Title: Pr
- Page 134 and 135:
JUVENILE SERVICES Partnerships/ Col
- Page 136 and 137:
JUVENILE SERVICES Efficiencies/ Inn
- Page 138 and 139:
JUVENILE SERVICES Expenditures: 201
- Page 140 and 141:
OFFICE OF STRATEGIC FINANCIAL PLANN
- Page 142 and 143:
OFFICE OF STRATEGIC FINANCIAL PLANN
- Page 144 and 145:
OFFICE OF STRATEGIC FINANCIAL PLANN
- Page 146 and 147:
OFFICE OF STRATEGIC FINANCIAL PLANN
- Page 148 and 149:
PARKS AND RECREATION I. Purpose: Th
- Page 150 and 151:
PARKS AND RECREATION Partnerships/
- Page 152 and 153:
PARKS AND RECREATION Budget Totals
- Page 154 and 155:
PARKS AND RECREATION Detailed Progr
- Page 156 and 157:
PARKS AND RECREATION Expenditures:
- Page 158 and 159:
PERSONNEL & HUMAN SERVICES Signific
- Page 160 and 161:
PERSONNEL & HUMAN SERVICES Program
- Page 162 and 163:
PERSONNEL & HUMAN SERVICES Number o
- Page 164 and 165:
PERSONNEL & HUMAN SERVICES Quality
- Page 166 and 167:
PERSONNEL & HUMAN SERVICES Quality
- Page 168 and 169:
PERSONNEL & HUMAN SERVICES Cost Rec
- Page 170 and 171:
PERSONNEL & HUMAN SERVICES Budget T
- Page 172 and 173:
PROSECUTING ATTORNEY I. Purpose: Th
- Page 174 and 175:
PROSECUTING ATTORNEY • Punishment
- Page 176 and 177:
PROSECUTING ATTORNEY Detailed Progr
- Page 178 and 179:
PROSECUTING ATTORNEY Detailed Progr
- Page 180 and 181:
PROSECUTING ATTORNEY Detailed Progr
- Page 182 and 183:
Program Title: Criminal - Juvenile
- Page 184 and 185:
PROSECUTING ATTORNEY Partnerships/
- Page 186 and 187:
PROSECUTING ATTORNEY Minimum Servic
- Page 188 and 189:
PROSECUTING ATTORNEY jurisdictional
- Page 190 and 191:
PROSECUTING ATTORNEY Detailed Progr
- Page 192 and 193:
PROSECUTING ATTORNEY Detailed Progr
- Page 194 and 195:
PROSECUTING ATTORNEY Mandates and C
- Page 196 and 197:
PROSECUTING ATTORNEY Cost Recovery
- Page 198 and 199:
PROSECUTING ATTORNEY PROSECUTOR’S
- Page 200 and 201:
SHERIFF I. PURPOSE: The Kitsap Coun
- Page 202 and 203:
o Purchased personal protective and
- Page 204 and 205:
SHERIFF Program Title: The Sheriff'
- Page 206 and 207:
Mandates and Contractual Agreements
- Page 208 and 209:
SHERIFF Minimum Service Level: Prog
- Page 210 and 211:
SHERIFF Quality Indicators: 2011 20
- Page 212 and 213:
SHERIFF Mandates and Contractual Ag
- Page 214 and 215:
SHERIFF - JAIL I. Purpose: Our miss
- Page 216 and 217:
SHERIFF - JAIL Program Title: Sheri
- Page 218 and 219:
SHERIFF - JAIL AGENCY BUDGET EXPEND
- Page 220 and 221:
SUPERIOR COURT Significant Budget I
- Page 222 and 223:
SUPERIOR COURT Cost Recovery Cost A
- Page 224 and 225:
SUPERIOR COURT SUPERIOR COURT’S O
- Page 226 and 227:
TREASURER Significant Budget Issues
- Page 228 and 229:
TREASURER Partnerships/Collaboratio
- Page 230 and 231:
WSU EXTENSION SERVICES I. Purpose:
- Page 232 and 233:
WSU EXTENSION SERVICES Detailed Pro
- Page 234 and 235:
WSU EXTENSION SERVICES Program Just
- Page 236 and 237:
WSU EXTENSION SERVICES Cost Recover
- Page 238 and 239:
WSU EXTENSION SERVICES Program Titl
- Page 240 and 241:
WSU EXTENSION SERVICES Program Just
- Page 242 and 243:
This page intentionally left blank
- Page 244 and 245:
This page intentionally left blank
- Page 246 and 247:
This page intentionally left blank
- Page 248 and 249:
Central Communications (CENCOM/911)
- Page 250 and 251:
Central Communications (CENCOM/911)
- Page 252 and 253:
COMMUNITY DEVELOPMENT III. 2010 Acc
- Page 254 and 255:
COMMUNITY DEVELOPMENT Minimum Servi
- Page 256 and 257:
COMMUNITY DEVELOPMENT Efficiencies/
- Page 258 and 259:
COMMUNITY DEVELOPMENT Program Justi
- Page 260 and 261:
COMMUNITY DEVELOPMENT Minimum Servi
- Page 262 and 263:
COMMUNITY DEVELOPMENT Efficiencies/
- Page 264 and 265:
COMMUNITY DEVELOPMENT Program Title
- Page 266 and 267:
COMMUNITY DEVELOPMENT Funding Conse
- Page 268 and 269:
COMMUNITY DEVELOPMENT Funding Conse
- Page 270 and 271:
COMMUNITY DEVELOPMENT Program Title
- Page 272 and 273:
COMMUNITY DEVELOPMENT Funding Conse
- Page 274 and 275:
COMMUNITY DEVELOPMENT Cost Avoidanc
- Page 276 and 277:
COMMUNITY DEVELOPMENT Quality Indic
- Page 278 and 279:
COMMUNITY DEVELOPMENT Cost Recovery
- Page 280 and 281:
EMERGENCY MANAGEMENT Program Title:
- Page 282 and 283:
EMERGENCY MANAGEMENT Agency Structu
- Page 284 and 285:
PERSONNEL AND HUMAN SERVICES Grant
- Page 286 and 287:
PERSONNEL AND HUMAN SERVICES • Co
- Page 288 and 289:
PERSONNEL AND HUMAN SERVICES Annual
- Page 290 and 291:
PERSONNEL AND HUMAN SERVICES Outpat
- Page 292 and 293:
PERSONNEL AND HUMAN SERVICES Progra
- Page 294 and 295:
Minimum Service Level: PERSONNEL AN
- Page 296 and 297:
PERSONNEL AND HUMAN SERVICES Qualit
- Page 298 and 299:
PERSONNEL AND HUMAN SERVICES Readmi
- Page 300 and 301:
Teen Mentor (TM) Program will demon
- Page 302 and 303:
PERSONNEL AND HUMAN SERVICES Progra
- Page 304 and 305:
PERSONNEL AND HUMAN SERVICES Progra
- Page 306 and 307:
PUBLIC WORKS - ROAD DIVISION I. ROA
- Page 308 and 309:
PUBLIC WORKS - ROAD DIVISION • Se
- Page 310 and 311:
PUBLIC WORKS - ROAD DIVISION • Ut
- Page 312 and 313:
PUBLIC WORKS - ROAD DIVISION Mandat
- Page 314 and 315:
PUBLIC WORKS - ROAD DIVISION Worklo
- Page 316 and 317:
PUBLIC WORKS - ROAD DIVISION Cost R
- Page 318 and 319:
PUBLIC WORKS - ROAD DIVISION
- Page 320 and 321:
ENTERPRISE FUNDS ENTERPRISE FUNDS $
- Page 322 and 323:
Enterprise Funds $73,070,668 SSWM P
- Page 324 and 325:
SEWER UTILITY DIVISION Significant
- Page 326 and 327:
SEWER UTILITY DIVISION Program Just
- Page 328 and 329:
SEWER UTILITY DIVISION Quality Indi
- Page 330 and 331:
SEWER UTILITY DIVISION Quality Indi
- Page 332 and 333:
SEWER UTILITY DIVISION Workload Ind
- Page 334 and 335:
SEWER UTILITY DIVISION Budget Total
- Page 336 and 337:
Agency Structure: SEWER UTILITY DIV
- Page 338 and 339:
SOLID WASTE DIVISION II. BUDGET OVE
- Page 340 and 341:
SOLID WASTE DIVISION Program Title:
- Page 342 and 343:
SOLID WASTE DIVISION This program i
- Page 344 and 345:
SOLID WASTE DIVISION Partnerships/C
- Page 346 and 347:
SOLID WASTE DIVISION Facility; from
- Page 348 and 349:
SOLID WASTE DIVISION Partnerships/C
- Page 350 and 351:
SOLID WASTE DIVISION Regional or Lo
- Page 352 and 353:
SOLID WASTE DIVISION Cost Recovery
- Page 354 and 355:
SURFACE & STORMWATER MANAGEMENT SSW
- Page 356 and 357:
SURFACE & STORMWATER MANAGEMENT •
- Page 358 and 359:
SURFACE & STORMWATER MANAGEMENT Qua
- Page 360 and 361:
SURFACE & STORMWATER MANAGEMENT Qua
- Page 362 and 363:
SURFACE & STORMWATER MANAGEMENT Qua
- Page 364 and 365:
SURFACE & STORMWATER MANAGEMENT Wor
- Page 366 and 367:
SURFACE & STORMWATER MANAGEMENT Wor
- Page 368 and 369:
SURFACE & STORMWATER MANAGEMENT Bud
- Page 370 and 371:
SURFACE & STORMWATER MANAGEMENT Pro
- Page 372 and 373:
SURFACE & STORMWATER MANAGEMENT Pro
- Page 374 and 375:
SURFACE & STORMWATER MANAGEMENT Pro
- Page 376 and 377:
SURFACE & STORMWATER MANAGEMENT Pro
- Page 378 and 379:
SURFACE & STORMWATER MANAGEMENT The
- Page 380 and 381:
SURFACE & STORMWATER MANAGEMENT Kit
- Page 382 and 383:
OTHER ENTERPRISE FUNDS Fund Number
- Page 384 and 385:
INTERNAL SERVICE FUNDS ENTERPRISE F
- Page 386 and 387:
Internal Service Funds $19,403,786
- Page 388 and 389:
AUDITOR III. 2010 Accomplishments:
- Page 390 and 391:
AUDITOR WORKLOAD INDICATORS: # Ball
- Page 392 and 393:
AUDITOR Budget Totals 2011 Budget 2
- Page 394 and 395:
KITSAP COUNTY PUBLIC WORKS - ER&R D
- Page 396 and 397:
KITSAP COUNTY PUBLIC WORKS - ER&R D
- Page 398 and 399:
INFORMATION SERVICES Significant Bu
- Page 400 and 401:
INFORMATION SERVICES Efficiencies/
- Page 402 and 403:
INFORMATION SERVICES Detailed Progr
- Page 404 and 405:
INFORMATION SERVICES Detailed Progr
- Page 406 and 407:
INFORMATION SERVICES Regional or Lo
- Page 408 and 409:
RISK MANAGEMENT I. Purpose: The Ris
- Page 410 and 411:
RISK MANAGEMENT Quality Indicators:
- Page 412 and 413:
This page intentionally left blank
- Page 414 and 415:
DEBT SERVICE FUNDS The County uses
- Page 416 and 417:
DEBT SERVICE FUNDS The following ch
- Page 418 and 419:
DEBT SERVICE REQUIREMENTS FOR LTGO
- Page 420 and 421:
PUBLIC WORKS DEBT SERVICE FUNDS FOR
- Page 422 and 423:
PUBLIC WORKS DEBT SERVICE FUNDS FOR
- Page 424 and 425:
This page intentionally left blank
- Page 426 and 427:
Capital Project Funds Central Kitsa
- Page 428 and 429:
Capital Project Funds Parks Capital
- Page 430 and 431:
COSTS/REVENUES 2011 2012 2013 2014
- Page 432 and 433:
Appendices
- Page 434 and 435:
Appendix A Policies Budget Policy T
- Page 436 and 437:
Appendix A Policies Employees of th
- Page 438 and 439:
Appendix A Policies XIV. AUTHORIZED
- Page 440 and 441:
Appendix A Policies for such insura
- Page 442 and 443:
Appendix A Policies Advance refundi
- Page 444 and 445:
Appendix B Tax Levies 2010 KITSAP C
- Page 446 and 447:
Appendix B Tax Levies PORT OF INDIA
- Page 448 and 449:
Appendix C Synopsis of Property Tax
- Page 450 and 451:
Appendix C Synopsis of Property Tax
- Page 452 and 453:
Appendix E Staffing Levels INTRODUC
- Page 454 and 455:
Appendix E Staffing Levels Appendix
- Page 456 and 457:
Appendix E Staffing Levels Appendix
- Page 458 and 459:
Appendix E Staffing Levels Appendix
- Page 460 and 461:
Appendix E Staffing Levels Appendix
- Page 462 and 463:
Appendix E Staffing Levels Appendix
- Page 464 and 465:
Appendix E Staffing Levels Appendix
- Page 466 and 467:
Appendix E Staffing Levels Appendix
- Page 468 and 469:
Appendix F Glossary G L O S S A R Y
- Page 470 and 471:
F3 Appendix F Glossary ESA - Endang
- Page 472 and 473:
Appendix F Glossary RECLASSIFICATIO