3.0 Affected Environment - Knik Arm Bridge and Toll Authority
3.0 Affected Environment - Knik Arm Bridge and Toll Authority
3.0 Affected Environment - Knik Arm Bridge and Toll Authority

You also want an ePaper? Increase the reach of your titles
YUMPU automatically turns print PDFs into web optimized ePapers that Google loves.
<strong>Knik</strong> <strong>Arm</strong> Crossing DraftFinal EIS<br />
<strong>Affected</strong> <strong>Environment</strong><br />
<strong>3.0</strong> <strong>Affected</strong> <strong>Environment</strong><br />
This section inventories <strong>and</strong> characterizes the economic, environmental, <strong>and</strong> cultural<br />
resources that might be affected by construction <strong>and</strong> operation of the proposed KAC project.<br />
This information was drawn from technical studies <strong>and</strong> reports prepared to identify<br />
environmental impacts of the proposed project. Several reports have documented the<br />
previous public outreach efforts <strong>and</strong> public comments on alternatives for the proposed<br />
project. The original reports, listed in the References Section, should be consulted for more<br />
detail.<br />
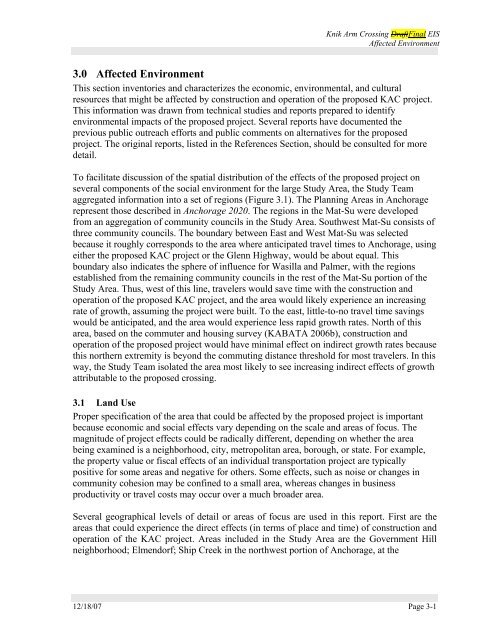
To facilitate discussion of the spatial distribution of the effects of the proposed project on<br />
several components of the social environment for the large Study Area, the Study Team<br />
aggregated information into a set of regions (Figure 3.1). The Planning Areas in Anchorage<br />
represent those described in Anchorage 2020. The regions in the Mat-Su were developed<br />
from an aggregation of community councils in the Study Area. Southwest Mat-Su consists of<br />
three community councils. The boundary between East <strong>and</strong> West Mat-Su was selected<br />
because it roughly corresponds to the area where anticipated travel times to Anchorage, using<br />
either the proposed KAC project or the Glenn Highway, would be about equal. This<br />
boundary also indicates the sphere of influence for Wasilla <strong>and</strong> Palmer, with the regions<br />
established from the remaining community councils in the rest of the Mat-Su portion of the<br />
Study Area. Thus, west of this line, travelers would save time with the construction <strong>and</strong><br />
operation of the proposed KAC project, <strong>and</strong> the area would likely experience an increasing<br />
rate of growth, assuming the project were built. To the east, little-to-no travel time savings<br />
would be anticipated, <strong>and</strong> the area would experience less rapid growth rates. North of this<br />
area, based on the commuter <strong>and</strong> housing survey (KABATA 2006b), construction <strong>and</strong><br />
operation of the proposed project would have minimal effect on indirect growth rates because<br />
this northern extremity is beyond the commuting distance threshold for most travelers. In this<br />
way, the Study Team isolated the area most likely to see increasing indirect effects of growth<br />
attributable to the proposed crossing.<br />
3.1 L<strong>and</strong> Use<br />
Proper specification of the area that could be affected by the proposed project is important<br />
because economic <strong>and</strong> social effects vary depending on the scale <strong>and</strong> areas of focus. The<br />
magnitude of project effects could be radically different, depending on whether the area<br />
being examined is a neighborhood, city, metropolitan area, borough, or state. For example,<br />
the property value or fiscal effects of an individual transportation project are typically<br />
positive for some areas <strong>and</strong> negative for others. Some effects, such as noise or changes in<br />
community cohesion may be confined to a small area, whereas changes in business<br />
productivity or travel costs may occur over a much broader area.<br />
Several geographical levels of detail or areas of focus are used in this report. First are the<br />
areas that could experience the direct effects (in terms of place <strong>and</strong> time) of construction <strong>and</strong><br />
operation of the KAC project. Areas included in the Study Area are the Government Hill<br />
neighborhood; Elmendorf; Ship Creek in the northwest portion of Anchorage, at the<br />
12/18/07 Page 3-1
<strong>Knik</strong> <strong>Arm</strong> Crossing DraftFinal EIS<br />
<strong>Affected</strong> <strong>Environment</strong><br />
Figure 3.1. Study Area regions<br />
Page 3-2 12/18/07
<strong>Knik</strong> <strong>Arm</strong> Crossing DraftFinal EIS<br />
<strong>Affected</strong> <strong>Environment</strong><br />
eastern terminus of the proposed project; <strong>and</strong> the Point MacKenzie census-designated place<br />
(CDP) in the southern part of the Mat-Su, at the western terminus of the proposed project.<br />
As discussed above, the Mat-Su is such a large jurisdiction that smaller regions were<br />
designated for this Study. Most of the effects of the proposed project on the pattern of l<strong>and</strong><br />
use, population density, <strong>and</strong> growth rate in the Mat-Su would be expected to occur in these<br />
portions of the borough. The regions include all of the Mat-Su south of Willow on the Parks<br />
Highway east to Sutton on the Glenn Highway, including the Point MacKenzie CDP <strong>and</strong> an<br />
unincorporated area between Palmer <strong>and</strong> Wasilla that has particularly high rates of<br />
population growth <strong>and</strong> development <strong>and</strong> is often referred to as the Core Area.<br />
A third level of detail includes the two broad jurisdictions affected by the proposed project—<br />
Anchorage <strong>and</strong> the Mat-Su. The socioeconomic data are presented at this level because of<br />
data availability issues <strong>and</strong> because it is likely that many of the indirect <strong>and</strong> cumulative<br />
effects of the proposed project would be experienced at this level. In many of the tables, data<br />
are also provided for the three incorporated areas located in the Mat-Su: the cities of<br />
Houston, Palmer, <strong>and</strong> Wasilla. A more detailed overview of the components of the affected<br />
area is provided in the sections below. The general boundaries of the affected area for the<br />
socioeconomic analysis are shown in Figure 3.1, which also illustrates the location of the<br />
regions, the Point MacKenzie area, the Anchorage Bowl Planning Areas, Elmendorf, Fort<br />
Richardson, <strong>and</strong> towns in the Study Area. A full discussion of the selection of the Study Area<br />
for l<strong>and</strong> use is in the L<strong>and</strong> Use <strong>and</strong> Transportation Forecasting Technical Report<br />
(KABATA 2006b). Transportation modeling incorporated in the analysis also included<br />
reasonably foreseeable actions outside the Study Area, <strong>and</strong> l<strong>and</strong> use <strong>and</strong> population modeling<br />
included the area where increased growth is projected to occur with implementation of the<br />
build alternatives.<br />
3.1.1 L<strong>and</strong> Use <strong>and</strong> Ownership<br />
The KAC Study Area is within Anchorage <strong>and</strong> the Mat-Su. Although Anchorage covers an<br />
area of 1,961 square miles including Chugach State Park, <strong>and</strong> the Mat-Su covers an area of<br />
24,683 square miles, the regional Study Area of cumulative <strong>and</strong> indirect effects <strong>and</strong>,<br />
therefore, the Study Area, is confined to those portions of Anchorage <strong>and</strong> the Mat-Su that<br />
would reasonably be affected, directly <strong>and</strong> indirectly, by implementation of the KAC project.<br />
The Mat-Su <strong>and</strong> Anchorage portions of the Study Area—83 <strong>and</strong> 77 square miles,<br />
respectively—are relatively small in comparison with the overall size of each jurisdiction.<br />
3.1.1.1 The <strong>Knik</strong> <strong>Arm</strong> Crossing project <strong>and</strong> federal, state, <strong>and</strong> local government<br />
planning regulations<br />
Within the KAC Study Area there are many different levels of government with varying<br />
transportation responsibilities, levels of planning authority, <strong>and</strong> regulations. This section<br />
discusses:<br />
• federal regulations regarding transportation planning in Anchorage, a Metropolitan<br />
Planning Organization (MPO), <strong>and</strong> in relationship to the proposed KAC project<br />
12/18/07 Page 3-3
<strong>Knik</strong> <strong>Arm</strong> Crossing DraftFinal EIS<br />
<strong>Affected</strong> <strong>Environment</strong><br />
• state regulations regarding powers of planning, platting, <strong>and</strong> l<strong>and</strong> use regulations <strong>and</strong><br />
provisions for transportation systems in Anchorage <strong>and</strong> in the Mat-Su, a second class<br />
borough<br />
3.1.1.1.1 Metropolitan Planning Organization regulations<br />
There are two distinctions between Anchorage, as an MPO, <strong>and</strong> other communities within<br />
the state (except for Fairbanks, also an MPO):<br />
• only these two MPOs receive a federal transportation funding allocation, established by<br />
the state, for transportation projects within the MPO boundaries<br />
• as MPOs, a set of federal regulations regarding planning must be followed<br />
An MPO, as defined in 23 U.S.C. § 134, is an urbanized area with a population of more than<br />
50,000 individuals. Under the authority granted to Anchorage with its MPO status since<br />
April 8, 1976, the Anchorage Metropolitan Area Transportation Solutions (AMATS) carries<br />
out transportation planning <strong>and</strong> programming <strong>and</strong> air quality conformity for the Municipality.<br />
AMATS consists of a Technical Advisory Committee <strong>and</strong> a Policy Committee.<br />
Transportation planning <strong>and</strong> programming is performed in cooperation with the state under<br />
an Inter-governmental Operating Agreement between the Municipality of Anchorage <strong>and</strong><br />
ADOT&PF.<br />
Because the KAC project has been proposed as a “project of regional <strong>and</strong> national<br />
significance” <strong>and</strong> a portion of the project lies within the Anchorage MPO, there are four<br />
primary actions required by AMATS:<br />
• the project must be included in the Municipality of Anchorage’s Long-Range<br />
Transportation Plan (LRTP) [23 U.S.C. § 134(g)(2)(A) <strong>and</strong> AS § 19.20.200]<br />
• the Anchorage LRTP must have a fiscally constrained financial plan with the KAC<br />
project included [23 U.S.C. § 134(g)(2)(B)]<br />
• Transportation air quality conformity is required on the LRTP amendment<br />
[23 U.S.C. § 134(g)(3)]<br />
• the project must be included in the AMATS Transportation Improvement Program (TIP)<br />
[23 U.S.C. § 134(h)(3)(B)(i)]<br />
The Anchorage 2025 LRTP (2005) was approved by the AMATS Policy Committee on<br />
December 20, 2005. It includes the KAC project as far as its progress through the NEPA<br />
process. To secure a Record of Decision on the EIS, however, the KAC project must be<br />
included in the LRTP through the proposed project’s construction phase. An amendment to<br />
the Anchorage LRTP is required for inclusion of the proposed <strong>Knik</strong> <strong>Arm</strong> Crossing project,<br />
under 23 U.S.C. § 134(g)(2)(A).<br />
Although the Mat-Su is the fastest growing borough in Alaska, it has yet to meet the<br />
requirements to be classified as an MPO. The Mat-Su’s LRTP is written <strong>and</strong> is pending<br />
assembly approval though such a plan is not required by federal law <strong>and</strong> the Borough does<br />
not require a fiscally constrained financial plan. State law does provide, under<br />
AS § 29.35.210(a)(1), that the Mat-Su Borough, as a second class borough, has the power to<br />
Page 3-4 12/18/07
<strong>Knik</strong> <strong>Arm</strong> Crossing DraftFinal EIS<br />
<strong>Affected</strong> <strong>Environment</strong><br />
provide transportation systems. Unlike MPOs with a transportation funding allocation,<br />
transportation projects in the Mat-Su compete with other projects within the state for federalaid<br />
highway funds through the Statewide Transportation Improvement Program (STIP) or are<br />
programmed into the Borough’s Capital Improvement Program.<br />
3.1.1.1.2 State <strong>and</strong> local planning<br />
AS §§ 29.35 <strong>and</strong> 29.40 define the authority of cities <strong>and</strong> boroughs to provide for planning,<br />
platting, <strong>and</strong> l<strong>and</strong> use regulations. Planning powers are either m<strong>and</strong>atory or optional<br />
depending on the classification of the city or borough. The Mat-Su Borough, as a second<br />
class borough, is required to provide for planning, platting, <strong>and</strong> l<strong>and</strong> use regulations on an<br />
area-wide basis (both inside <strong>and</strong> outside of cities) within the borough in accordance with<br />
AS § 29.40. The Borough may delegate these powers to a City within the borough<br />
(AS § 29.40.010). See Section 3.1.1.3 for the powers delegated to the three incorporated<br />
cities within the Mat-Su. Section 3.1.1.3, further discusses planning, platting, <strong>and</strong> l<strong>and</strong> use<br />
regulations in the Mat-Su.<br />
Anchorage, a unified home rule municipality, has planning, platting, <strong>and</strong> l<strong>and</strong> use regulation<br />
authority according to AS § 29.35. Anchorage 2020 is the comprehensive l<strong>and</strong> use policy<br />
plan; the LRTP is the transportation element of the comprehensive plan. Further, Title 21, of<br />
the Anchorage Municipal Code, is the regulatory ordinance that implements<br />
Anchorage 2020. Title 21 sets forth the requirements for planning, platting <strong>and</strong> zoning <strong>and</strong><br />
other development st<strong>and</strong>ards.<br />
AS § 35.30.020 states the relationship of the State with respect to compliance with municipal<br />
ordinances: “A department shall comply with local planning <strong>and</strong> zoning ordinances <strong>and</strong> other<br />
regulations in the same manner <strong>and</strong> to the same extent as other l<strong>and</strong>owners.” Public projects<br />
within cities or boroughs with planning, platting, <strong>and</strong> l<strong>and</strong> use regulations must comply the<br />
same as everyone else developing l<strong>and</strong> within those boundaries.<br />
When KABATA was formed under AS § 19.75, however, an exemption from local<br />
regulation was written into the statute. AS § 19.75.911 states, “Notwithst<strong>and</strong>ing any contrary<br />
provision of law, the activities of the authority are exempt from l<strong>and</strong> use planning, zoning,<br />
permitting, or other similar governmental powers of political subdivisions of the state.”<br />
While both state <strong>and</strong> federal regulations require transportation planning <strong>and</strong> project<br />
development at both regional <strong>and</strong> local levels; neither governmental entity has any l<strong>and</strong> use<br />
authority. Neither governmental entity has the authority to zone or otherwise implement any<br />
l<strong>and</strong> use control. 1 ADOT&PF <strong>and</strong> FHWA have no regulatory authority to develop l<strong>and</strong> use<br />
plans or implement zoning ordinances; this authority lies with the local government.<br />
1 FHWA <strong>and</strong> ADOT&PF do control right-of-way (ROW) access. Those wishing to gain access to a state-owned<br />
road from a driveway or subdivision road must apply for a permit from ADOT&PF. Higher classification<br />
roads, freeways, <strong>and</strong> major arterials have purchased controlled access through the ROW process, <strong>and</strong> access is<br />
allowed only at certain intersections.<br />
12/18/07 Page 3-5
<strong>Knik</strong> <strong>Arm</strong> Crossing DraftFinal EIS<br />
<strong>Affected</strong> <strong>Environment</strong><br />
3.1.1.2 Existing l<strong>and</strong> use<br />
3.1.1.2.1 The Mat–Su<br />
Existing public <strong>and</strong> private l<strong>and</strong> use in the Mat-Su is<br />
shown in Figure 3.2. Existing l<strong>and</strong> use is described in<br />
the Borough’s most recently adopted plan, the<br />
Matanuska-Susitna Borough-Wide Comprehensive<br />
Plan, <strong>and</strong> in all the associated plans adopted into the<br />
Comprehensive Plan by the Borough Assembly.<br />
The Mat-Su portion of the Study Area has a mix of<br />
public recreation uses <strong>and</strong> wildlife habitat on State<br />
l<strong>and</strong>s, low-density residential uses, light industrial<br />
uses, commercial enterprises, commercial <strong>and</strong><br />
noncommercial aviation uses, forestry, agriculture,<br />
<strong>and</strong> mineral resource development. L<strong>and</strong> in the Study<br />
Area is also commonly used for sport hunting <strong>and</strong><br />
fishing <strong>and</strong> for traditional hunting, fishing, <strong>and</strong><br />
gathering. Recreation is one of the area’s major l<strong>and</strong><br />
uses. Wildlife habitat <strong>and</strong> water features are extensive<br />
in the Mat-Su (38 percent of l<strong>and</strong> use), <strong>and</strong> the Study<br />
Area is the focus of high recreational use for Mat-Su<br />
<strong>and</strong> Anchorage residents <strong>and</strong> tourists. Figure 3.2<br />
compares l<strong>and</strong> ownership at three geographic levels.<br />
L<strong>and</strong> use in the Mat-Su portion of the Study Area is<br />
also shown in Table 3-1, <strong>and</strong> ownership is shown in<br />
Table 3-4).<br />
Figure 3.2. Area of indirect effects, l<strong>and</strong> distribution.<br />
This figure compares the existing distribution of l<strong>and</strong><br />
among several generalized use <strong>and</strong> ownership<br />
categories in the area of indirect effects with the state<br />
<strong>and</strong> the entire borough. Mat-Su Borough is about the<br />
size of West Virginia. The area of indirect effects, an<br />
area equal to 382 square miles (2 percent of the<br />
Mat-Su), is about the size of New York City. This figure<br />
shows that about 3 percent of the private l<strong>and</strong> in Alaska<br />
is found in this area of indirect effects.<br />
BLM, 31%<br />
National Wildlife<br />
Refuge, 19%<br />
State, 58%<br />
Private, 32%<br />
Alaska L<strong>and</strong> Distribution<br />
Native<br />
Corporation, 10%<br />
National Park,<br />
12%<br />
State, 21%<br />
Matanuska-Susitna Borough<br />
L<strong>and</strong> Distribution<br />
Refuge, 29%<br />
Private or<br />
Municipal, 8%<br />
National Park,<br />
10%<br />
Area of Indirect Effects<br />
L<strong>and</strong> Distribution<br />
State, 9%<br />
Water Features,<br />
9%<br />
Private or<br />
Municipal, 1%<br />
National Forest,<br />
6%<br />
BLM, 20%<br />
Native<br />
Corporation, 3%<br />
Borough, 15%<br />
No Data, 1%<br />
Native<br />
Corporation, 4%<br />
The distribution of l<strong>and</strong> in the area of indirect effects,<br />
described above as the area most likely to see<br />
increasing indirect effects of growth due to implementation of the proposed crossing, is in the<br />
Mat-Su <strong>and</strong> is shown in Figure 3.3. It is notable that 62 percent of the l<strong>and</strong> in the Mat-Su<br />
portion of the study area is either protected for wildlife (29 percent), water features<br />
(9 percent) or otherwise regulated by the state (9 percent) or the Borough (17 percent).<br />
Page 3-6 12/18/07
<strong>Knik</strong> <strong>Arm</strong> Crossing DraftFinal EIS<br />
<strong>Affected</strong> <strong>Environment</strong><br />
Table 3-1. Existing l<strong>and</strong> use in the Mat-Su portion of<br />
the Study Area<br />
L<strong>and</strong> use Acres Percentage<br />
Agricultural 3,953 8%<br />
Residential 15,708 29<br />
Commercial 1,039 2<br />
Community service 3,564 7<br />
Public service 701 1<br />
Industrial 1,811 3<br />
Undeveloped l<strong>and</strong> 26,735 50<br />
Total 53,101 100%<br />
Source: Calculated by HDR Alaska, Inc., from MSB GIS Data 2005<br />
3.1.1.2.2 Anchorage<br />
Existing l<strong>and</strong> use in Anchorage is described in Anchorage 2020 <strong>and</strong> shown in Table 3-2 <strong>and</strong><br />
Figure 3.3. The area of the Anchorage Bowl is shown in Figure 1.1, <strong>and</strong> the Anchorage Bowl<br />
Planning Areas are shown in Figure 3.1. L<strong>and</strong> use for developable vacant l<strong>and</strong> is shown in<br />
Table 3-3. Anchorage 2020 (2001a:44) describes the proposed KAC project broadly as “a<br />
connection across <strong>Knik</strong> <strong>Arm</strong> between Point MacKenzie <strong>and</strong> Anchorage, which would open<br />
up thous<strong>and</strong>s of acres to development ….”<br />
L<strong>and</strong> in Anchorage is a mix of low-density residential uses, commercial enterprises, park,<br />
<strong>and</strong> military uses. Fifty percent of the vacant l<strong>and</strong> in the Anchorage Bowl lies in the<br />
Southeast area; thus, most new residential development (5,447 acres) would occur in the<br />
Southeast area of the Anchorage Bowl. Existing l<strong>and</strong> use in Anchorage is shown in<br />
Figure 3.2.<br />
12/18/07 Page 3-7
<strong>Knik</strong> <strong>Arm</strong> Crossing DraftFinal EIS<br />
<strong>Affected</strong> <strong>Environment</strong><br />
Figure 3.3. Existing l<strong>and</strong> use<br />
Page 3-8 12/18/07
<strong>Knik</strong> <strong>Arm</strong> Crossing DraftFinal EIS<br />
<strong>Affected</strong> <strong>Environment</strong><br />
Table 3-2. Existing l<strong>and</strong> use in the Anchorage Bowl<br />
L<strong>and</strong> use Acres Percentage<br />
Residential 17,595 36%<br />
Commercial 2,731 5<br />
Industrial 2,581 5<br />
Transportation a 2,442 5<br />
Institutional 3,773 8<br />
Parks/open space 10,823 22<br />
Rights-of-way <strong>and</strong> miscellaneous b 9,454 19<br />
Total l<strong>and</strong> c 49,399 100%<br />
Source: Anchorage 2020: Anchorage Bowl Comprehensive Plan (2001a:23)<br />
a Includes Ted Stevens Anchorage International Airport, Alaska Railroad,<br />
<strong>and</strong> the POA<br />
b Includes roads rights-of-way<br />
c in use, not including vacant l<strong>and</strong><br />
Table 3-3. L<strong>and</strong> use of developable vacant l<strong>and</strong> in<br />
the Anchorage Bowl<br />
L<strong>and</strong> use Acres Percentage<br />
Residential 8,537 73%<br />
Commercial 421 4<br />
Industrial 934 8<br />
Public l<strong>and</strong>s/Institutions 846 7<br />
Other 993 8<br />
Total l<strong>and</strong> 11,731 100%<br />
Source: Anchorage 2020: Anchorage Bowl Comprehensive Plan<br />
(2001:24)<br />
3.1.1.2.3 Government Hill<br />
As shown in the inset on Figure 3.2, Government Hill has predominantly residential uses<br />
supported by a section of commercial uses <strong>and</strong> a large area of parkl<strong>and</strong>s. Government Hill is<br />
isolated from the rest of Anchorage by transportation <strong>and</strong> industrial uses located below the<br />
steep bluff leading to Ship Creek. The industrial uses at the POA <strong>and</strong> Alaska Railroad lease<br />
properties define Government Hill on the south, while it is constrained on the north by<br />
Elmendorf.<br />
Between Ship Creek <strong>and</strong> Third Avenue, which is the southern extent of the proposed project,<br />
Anchorage has a mix of vacant l<strong>and</strong> <strong>and</strong> commercial <strong>and</strong> institutional uses such as<br />
government buildings, with a small number of residential uses. This section of Anchorage is<br />
situated on a bluff overlooking Ship Creek <strong>and</strong> the POA. Farther south, the commercial <strong>and</strong><br />
institutional l<strong>and</strong> uses of Downtown Anchorage transition to more residential l<strong>and</strong> uses<br />
transected by parkl<strong>and</strong>s connected with trails leading to <strong>Knik</strong> <strong>Arm</strong> <strong>and</strong> the Chugach<br />
Mountains, east of the urban area.<br />
12/18/07 Page 3-9
<strong>Knik</strong> <strong>Arm</strong> Crossing DraftFinal EIS<br />
<strong>Affected</strong> <strong>Environment</strong><br />
3.1.1.3 L<strong>and</strong> ownership<br />
Generalized l<strong>and</strong> ownership types for the Mat-Su <strong>and</strong> Anchorage are shown in Figure 3.4.<br />
<strong>Affected</strong> l<strong>and</strong>s include private, Borough, Native Corporation, State, Public University,<br />
federal, Elmendorf, Fort Richardson, <strong>and</strong> City l<strong>and</strong>s as well as Alaska Mental Health Trust<br />
L<strong>and</strong>s. Figure 3.5 shows l<strong>and</strong> ownership in Government Hill.<br />
L<strong>and</strong> ownership types are more fully described below.<br />
3.1.1.3.1 Private l<strong>and</strong><br />
For the purposes of this Draft EIS, private l<strong>and</strong> holdings are properties owned by individuals<br />
or businesses, but not by Native Corporations, certified Alaska Native Allotments, municipal<br />
governments, or the state or federal governments. There are approximately 13 minority<br />
business owners in the Government Hill Commercial District.<br />
3.1.1.3.2 Borough l<strong>and</strong><br />
Borough-owned properties were conveyed by the State of Alaska as Municipal Entitlement<br />
L<strong>and</strong>s (MEL) <strong>and</strong> also were acquired through tax foreclosure, purchase, <strong>and</strong> donation. MEL<br />
l<strong>and</strong>s are used to generate revenue through sales, leases, <strong>and</strong> permits; to provide sites for<br />
public facilities; <strong>and</strong> to offer public recreational opportunities. (Note: The legislature created<br />
the “Greater Anchorage Area Borough” in 1964. In 1975, the Greater Anchorage Area<br />
Borough unified <strong>and</strong> became the Municipality of Anchorage with its boundary from near the<br />
first <strong>Knik</strong> River <strong>Bridge</strong> to Portage, in the south, which is well beyond <strong>and</strong> is not shown on<br />
any of the figures in this study.)<br />
3.1.1.3.3 Native corporation l<strong>and</strong><br />
Under the Alaska Native Claims Settlement Act of 1971, Native Corporations were allowed<br />
to select l<strong>and</strong>s from federal l<strong>and</strong> holdings. These selections were then adjudicated <strong>and</strong><br />
conveyed to the Native Regional <strong>and</strong> Village Corporations. Cook Inlet Region, Incorporated<br />
(CIRI), is the Native Regional Corporation for the Cook Inlet area. CIRI owns l<strong>and</strong> within<br />
the Study Area.<br />
Page 3-10 12/18/07
<strong>Knik</strong> <strong>Arm</strong> Crossing DraftFinal EIS<br />
<strong>Affected</strong> <strong>Environment</strong><br />
Figure 3.4. Existing l<strong>and</strong> ownership<br />
12/18/07 Page 3-11
<strong>Knik</strong> <strong>Arm</strong> Crossing DraftFinal EIS<br />
<strong>Affected</strong> <strong>Environment</strong><br />
Figure 3.5. Existing l<strong>and</strong> ownership – Government Hill<br />
Page 3-12 12/18/07
<strong>Knik</strong> <strong>Arm</strong> Crossing DraftFinal EIS<br />
<strong>Affected</strong> <strong>Environment</strong><br />
3.1.1.3.4 State l<strong>and</strong><br />
The State of Alaska was granted over 100 million acres of l<strong>and</strong> when it achieved statehood<br />
in 1959. The State owns l<strong>and</strong> in portions of the Study Area. State l<strong>and</strong>s include state parks<br />
<strong>and</strong> refuges, such as the Nancy Lake State Recreation Area, Susitna Flats State Game<br />
Refuge, Willow Creek State Recreation Area, Little Susitna State Recreation Area, Goose<br />
Bay State Game Refuge, <strong>and</strong> the Iditarod Trail route. State l<strong>and</strong> also includes submerged <strong>and</strong><br />
other l<strong>and</strong> within the KAC Study Area.<br />
3.1.1.3.5 Alaska Mental Health Trust L<strong>and</strong>s<br />
State of Alaska Mental Health Trust L<strong>and</strong>s were granted to the territory by the federal<br />
government prior to statehood to generate revenue to support Alaska’s mental health<br />
programs. In 1978, the State Legislature waived the trust status of these l<strong>and</strong>s, allowing l<strong>and</strong><br />
to be leased, sold, <strong>and</strong> transferred to municipalities. In the 1980s, mental health advocates<br />
sued, <strong>and</strong> the State was ordered to “reconstitute, as nearly as possible, the holdings which<br />
comprised the trust when the 1978 law became effective.” A new Mental Health Trust L<strong>and</strong><br />
Office under the Alaska Department of Natural Resources (ADNR) has been created to<br />
manage these trust l<strong>and</strong>s.<br />
3.1.1.3.6 Public university l<strong>and</strong><br />
L<strong>and</strong> owned <strong>and</strong> managed by the University of Alaska was originally granted to the<br />
University by the federal government in accordance with two Acts of Congress dated<br />
March 4, 1915, <strong>and</strong> January 21, 1929. This property <strong>and</strong> other trust l<strong>and</strong> that was<br />
subsequently deeded to the University by the State of Alaska are for the exclusive use <strong>and</strong><br />
benefit of the University of Alaska <strong>and</strong>, therefore, are not State public domain l<strong>and</strong>.<br />
3.1.1.3.7 Federal l<strong>and</strong><br />
Federal l<strong>and</strong>s include nationally designated l<strong>and</strong>s, such as wildlife refuges <strong>and</strong> national parks,<br />
as well as federal public l<strong>and</strong>s. As shown in Figure 3.3, about 30 percent of the l<strong>and</strong> in<br />
Mat-Su Borough is federal (national park <strong>and</strong> BLM), but there is no federal l<strong>and</strong> in the area<br />
of indirect effects.<br />
3.1.1.3.8 Elmendorf Air Force Base<br />
Elmendorf is a federal military installation covering approximately 21 square miles of l<strong>and</strong><br />
adjacent to the Anchorage Bowl.<br />
3.1.1.3.9 Fort Richardson Military Base<br />
Fort Richardson is a federal military installation covering approximately 96 square miles of<br />
l<strong>and</strong> adjacent to the Anchorage Bowl.<br />
3.1.1.3.10 City l<strong>and</strong><br />
City l<strong>and</strong>s include l<strong>and</strong> owned by the incorporated Cities of Houston, Palmer, <strong>and</strong> Wasilla.<br />
12/18/07 Page 3-13
<strong>Knik</strong> <strong>Arm</strong> Crossing DraftFinal EIS<br />
<strong>Affected</strong> <strong>Environment</strong><br />
3.1.1.3.11 Housing<br />
The Mat-Su <strong>and</strong> Anchorage share a common trait with regard to public <strong>and</strong> private l<strong>and</strong>s as<br />
shown in Figure 3-4: In both areas, the amount of public l<strong>and</strong> greatly exceeds the amount of<br />
privately owned l<strong>and</strong>. An important difference between the two communities, however, is<br />
that most of the suitable l<strong>and</strong> in the Anchorage Bowl is in committed uses <strong>and</strong> much of the<br />
remaining acreage is located in areas where development is expensive because of slope <strong>and</strong><br />
wetl<strong>and</strong>s. 2 Other l<strong>and</strong>s within the Anchorage Bowl could be redeveloped to higher densities<br />
to meet future housing dem<strong>and</strong>. The Municipality noted in its scoping comments for this<br />
Draft EIS that redevelopable <strong>and</strong> underdeveloped l<strong>and</strong> could add space for 8,150 housing<br />
units within the Anchorage Bowl <strong>and</strong> that Turnagain <strong>Arm</strong> communities could house another<br />
5,000 persons. In addition, the Municipality has 18,700 acres available in the Chugiak-Eagle<br />
River area, of which 7,000 acres are currently zoned for residential use. L<strong>and</strong> <strong>and</strong> housing<br />
prices in the Anchorage Bowl are higher than in the Mat-Su, <strong>and</strong>, as a result, an increasingly<br />
larger share of regional residential <strong>and</strong> commercial development has been occurring in the<br />
Mat-Su, <strong>and</strong> this trend is expected to continue (Table 3-4).<br />
Table 3-4. L<strong>and</strong> ownership in the Mat-Su <strong>and</strong> Anchorage, 1998<br />
Area<br />
Anchorage<br />
(percentage)<br />
Anchorage<br />
(square miles)<br />
Mat-Su<br />
(percentage)<br />
Mat-Su<br />
(square<br />
miles)<br />
Private l<strong>and</strong>s 10.4 203.8 1.4 332.8<br />
Public l<strong>and</strong>s 89.6 1,751.9 98.6 23,440.6<br />
Source: Calculated by HDR Alaska, Inc., from Municipality of Anchorage <strong>and</strong> Mat-Su Borough<br />
geographic information system (GIS) data.<br />
A comparison of the data for Anchorage <strong>and</strong> the Mat-Su between 1990 <strong>and</strong> 2000 indicates:<br />
• Multiunit buildings are less common in the Mat-Su than in Anchorage. In Anchorage,<br />
single-family units accounted for roughly 57 percent of all housing units in 2000, while<br />
they accounted for 82.5 percent of all units in the Mat-Su. Both communities contain<br />
areas with higher portions of multifamily housing. For example, multifamily units<br />
accounted for 40 percent of housing units in Wasilla in 2000, while this type accounted<br />
for 79 percent of Government Hill housing units in 2000.<br />
• Vacancy rates dropped significantly in all areas between 1990, when the Alaska economy<br />
was still recovering from the recession in the late 1980s, <strong>and</strong> 2000. Between 1990<br />
<strong>and</strong> 2000, vacancy rates dropped by more than half in Anchorage <strong>and</strong> by roughly onethird<br />
in the Mat-Su.<br />
• Sales prices in the Mat-Su are increasing more quickly than in Anchorage. The average<br />
sales price for Anchorage homes increased by 2.7 percent annually between 1992<br />
<strong>and</strong> 2004, while the average sales price for Mat-Su homes increased by 3.6 percent<br />
(Alaska Multiple Listing Service, Inc. 2005). On average, however, Mat-Su home prices<br />
have remained roughly 25 percent below Anchorage home prices (Alaska Housing<br />
2 Personal communication, P. Palmer, Property Specialist, Prudential Vista of Anchorage, with Northern<br />
Economics, Inc., on May 26, 2005.<br />
Page 3-14 12/18/07
<strong>Knik</strong> <strong>Arm</strong> Crossing DraftFinal EIS<br />
<strong>Affected</strong> <strong>Environment</strong><br />
Finance Corporation 2005). In the third quarter of 2005, the average house price in<br />
Anchorage was $264,300, as compared with $220,272 in the Mat-Su. The major reason<br />
for this pricing difference is lower l<strong>and</strong> costs in the Mat-Su because of the greater<br />
availability of l<strong>and</strong> for housing development.<br />
The number of housing units increased in both the Mat-Su <strong>and</strong> Anchorage between 1990<br />
<strong>and</strong> 2000. 3 However, both the growth rate <strong>and</strong> the total number of housing units added during<br />
the period were greater in the Mat-Su than in Anchorage (Table 3-5). The rapid growth in the<br />
Mat-Su reflects the relative availability of larger parcels of l<strong>and</strong> for residential development<br />
<strong>and</strong> lower costs of purchasing l<strong>and</strong> <strong>and</strong> constructing a new home.<br />
Table 3-5. Number of housing units in the affected area, 1990 <strong>and</strong> 2000<br />
Anchorage<br />
Mat-Su<br />
Category 1990 2000 1990 2000<br />
Total housing units (number) 94,153 100,368 20,953 27,329<br />
Annual change — 0.64% — 2.69%<br />
Vacant units (number) 11,451 5,546 7,559 6,773<br />
Single-family unit portion 52.1% 57.2% 79.6% 82.5%<br />
Vacancy rate 12.1% 5.5% 36.1% 24.8%<br />
Median housing value $139,703 $160,700 $116,072 $125,800<br />
Source: U.S. Census Bureau, 2005<br />
Both Anchorage <strong>and</strong> the Mat-Su have vibrant <strong>and</strong> thriving housing markets. These markets<br />
are, however, experiencing important changes. For example:<br />
• For years, Anchorage has seen more housing starts than the Mat-Su, but in 2004 the<br />
number of housing starts in the Mat-Su surpassed the number of starts in Anchorage for<br />
the first time. 4 For the past several years more multifamily housing has been developed in<br />
Anchorage than single-family housing. 5 In the Mat-Su, single-family home development<br />
is likely to remain the dominant housing product, but the number of multifamily homes is<br />
also expected to grow substantially. 6<br />
• Sales prices in Anchorage are increasing more slowly than in the Mat-Su. The average<br />
sales price for Anchorage homes increased by 2.7 percent annually between 1992<br />
<strong>and</strong> 2004, while the average sales price for Mat-Su homes increased by 3.6 percent<br />
(Alaska Multiple Listing Service, Inc. 2005).<br />
3 The U.S. Census Bureau defines a housing unit as a house, apartment, mobile home or trailer, or a group of<br />
rooms or a single room occupied as a separate living quarters.<br />
4 Personal communication, Kreiger, Alaska Department of Labor <strong>and</strong> Workforce Development, Research <strong>and</strong><br />
Analysis Section. Lender’s survey data requested by Northern Economics, Inc.<br />
5 Personal communication, Vicki Portwood, Anchorage Homebuilders Association, with Northern Economics,<br />
Inc., May 24, 2005<br />
6 Personal communication, P. Palmer, Property Specialist, Prudential Vista of Anchorage, with Northern<br />
Economics, Inc., May 26, 2005<br />
12/18/07 Page 3-15
<strong>Knik</strong> <strong>Arm</strong> Crossing DraftFinal EIS<br />
<strong>Affected</strong> <strong>Environment</strong><br />
• An Anchorage-based household needs 1.47 wage earners to afford the average<br />
Anchorage mortgage. A family in the Mat-Su needs 1.48 average wage earners to afford<br />
that mortgage if those jobs are located in the Mat-Su. However, the same family needs<br />
only 1.14 wage earners if one wage earner works in Anchorage (Krieger 2005b). Roughly<br />
35 percent of Mat-Su residents work in Anchorage (MSB 2003a).<br />
According to the U.S. Census Bureau, Government Hill had 967 housing units in 2000, of<br />
which 205 units were single-family <strong>and</strong> the remainder multifamily. The vacancy rate in the<br />
area was 4.3 percent, a rate less than the 5.5 percent average for all of Anchorage. The Point<br />
MacKenzie CDP had 94 housing units in 2000, of which 53 were vacant. Ten of these units<br />
were mobile homes or trailers <strong>and</strong> the remainder were single-family buildings.<br />
3.1.1.4 Existing zoning<br />
Figure 3.6 shows generalized zoning in the region. All l<strong>and</strong> development in the Mat-Su is<br />
subject to MSB 17.01 Acknowledgement of Existing L<strong>and</strong> Use Regulations. The<br />
Municipality of Anchorage’s zoning ordinances are found in Title 21. Title 21 is in the<br />
process of being rewritten to implement Anchorage 2020. The following discusses both the<br />
Mat-Su Borough <strong>and</strong> the Municipality of Anchorage’s zoning or development ordinances.<br />
3.1.1.4.1 Mat-Su Borough<br />
The Mat-Su Borough’s Planning Commission was established to perform the area-wide<br />
functions of planning, platting, <strong>and</strong> zoning. The Planning Commission’s recommendations<br />
are transmitted to the Assembly. According to MSB Chapter 15.24 Assembly, Zoning<br />
Functions, the Assembly has authority, with the Planning Commission’s recommendation, to<br />
establish building <strong>and</strong> l<strong>and</strong> use regulations <strong>and</strong> create districts (MSB 15.24.015). With the<br />
assistance of the Planning Commission, the Assembly prepares <strong>and</strong> revises a comprehensive<br />
borough-wide plan of development. The Borough also has broad powers pursuant to<br />
AS § 19.30.151(b).<br />
Mat-Su Borough uses both borough-wide <strong>and</strong> special use district (SpUD) ordinances.<br />
Borough-wide ordinances employ setback st<strong>and</strong>ards, including a 75-foot water-body setback<br />
adopted by voter initiative; sanitary solid waste disposal sites; <strong>and</strong> mobile home park<br />
st<strong>and</strong>ards. SpUDs are tailored to a local community’s special conditions <strong>and</strong> are unique to the<br />
geographic boundary of each community. Local communities have the ability to redefine a<br />
particular borough-wide measure through their SpUD ordinances (MSB 2005d).<br />
To improve the level of compliance with existing Borough code, the Borough provides<br />
regulatory information to persons proposing development. The owner or developer signs a<br />
Statement of Acknowledgement of Existing L<strong>and</strong> Use Regulations, as provided in<br />
MSB Title 17, prior to the development activity.<br />
Page 3-16 12/18/07
<strong>Knik</strong> <strong>Arm</strong> Crossing DraftFinal EIS<br />
<strong>Affected</strong> <strong>Environment</strong><br />
Figure 3.6. Existing zoning.<br />
12/18/07 Page 3-17
<strong>Knik</strong> <strong>Arm</strong> Crossing DraftFinal EIS<br />
<strong>Affected</strong> <strong>Environment</strong><br />
The Cities of Houston, Palmer <strong>and</strong> Wasilla, each in the Mat-Su, are exceptions to boroughwide<br />
powers regarding l<strong>and</strong> use regulations, planning, <strong>and</strong> zoning. The Borough has<br />
delegated these powers to the cities.<br />
3.1.1.4.2 The City of Houston<br />
The City of Houston is a second class city in the Mat-Su, <strong>and</strong> its responsibility for providing<br />
for planning, platting, <strong>and</strong> l<strong>and</strong> use regulations is optional. Through MSB 17.40, the Mat-Su<br />
Borough delegated to the Houston City Council the authority to act as the City zoning board<br />
<strong>and</strong> to hear <strong>and</strong> decide on variances <strong>and</strong> conditional uses in the city of Houston. Houston is<br />
primarily a residential community, with some commercial uses along the Parks Highway <strong>and</strong><br />
light industrial uses along the Alaska Railroad corridor. L<strong>and</strong>s classified as Public L<strong>and</strong>s <strong>and</strong><br />
Institutions are set aside for schools <strong>and</strong> other public uses. Existing l<strong>and</strong> uses in the city of<br />
Houston are described in the City of Houston L<strong>and</strong> Use Ordinance. Houston’s l<strong>and</strong> use<br />
districts were established by Matanuska-Susitna Borough Title 17 (17.40.405) on<br />
December 15, 1987, <strong>and</strong> amended by Houston Ordinance 90-032 on May 1, 1990,<br />
Ordinance 98-046 on June 2, 1998, <strong>and</strong> Ordinance 98-085 on July 21, 1998.<br />
3.1.1.4.3 The City of Palmer<br />
The City of Palmer, as a home rule city in the Mat-Su, has l<strong>and</strong> use regulatory powers for all<br />
areas within the city limits. Palmer is primarily a residential community, with some<br />
agricultural <strong>and</strong> commercial uses along the Glenn Highway <strong>and</strong> light industrial uses along<br />
the Alaska Railroad corridor. L<strong>and</strong>s classified as Public L<strong>and</strong>s <strong>and</strong> Institutions are set aside<br />
for schools <strong>and</strong> other public uses. Permissible types of l<strong>and</strong> uses in the city of Palmer are<br />
described in the City of Palmer L<strong>and</strong> Use Ordinance.<br />
3.1.1.4.4 The City of Wasilla<br />
The City of Wasilla is a first class city in the Mat-Su. The Wasilla Planning <strong>and</strong> Utilities<br />
Commission acts as the City planning <strong>and</strong> l<strong>and</strong> use regulatory authority, according to<br />
MSB 17.45. Wasilla is a residential community with strip commercial uses along the Parks<br />
Highway <strong>and</strong> cross streets. Some industrial uses occur along the Parks Highway <strong>and</strong> Alaska<br />
Railroad corridor as well. L<strong>and</strong>s classified as Public L<strong>and</strong>s <strong>and</strong> Institutions are set aside for<br />
schools <strong>and</strong> other public uses. Permissible types of l<strong>and</strong> uses in the city of Wasilla are<br />
described in the City of Wasilla L<strong>and</strong> Use Ordinance.<br />
3.1.1.4.5 Port MacKenzie District<br />
The Mat-Su Borough has plans for the 9,000-acre Port MacKenzie District to provide<br />
services for bulk commodity storage (fuel, timber, s<strong>and</strong> <strong>and</strong> gravel, peat, grain), a floatplane<br />
base to serve Anchorage air taxi <strong>and</strong> private pilots, a ferry terminal, <strong>and</strong> a public boat launch<br />
ramp for companies <strong>and</strong> individuals based in Anchorage <strong>and</strong> statewide. The Port MacKenzie<br />
District area provides l<strong>and</strong> for commercial, industrial, <strong>and</strong> recreational uses with lower l<strong>and</strong><br />
costs compared with the Anchorage Bowl.<br />
Page 3-18 12/18/07
<strong>Knik</strong> <strong>Arm</strong> Crossing DraftFinal EIS<br />
<strong>Affected</strong> <strong>Environment</strong><br />
3.1.1.4.6 Point MacKenzie Agricultural Area<br />
The Point MacKenzie Agricultural Area contains 14,893 acres, or 23 square miles, for the<br />
purpose of dairy farming <strong>and</strong> general agricultural use. The “Matanuska-Susitna Borough<br />
Agricultural L<strong>and</strong> Sale Programs Summary” updated August 24, 2004, describes the history<br />
<strong>and</strong> process for the conveyance of these l<strong>and</strong>s for agricultural purposes. L<strong>and</strong> titles are<br />
subject to a recorded Declaration of covenants, conditions, <strong>and</strong> restrictions (CCRs) to<br />
promote agricultural use. The CCRs limit improvement sites, residential locations, <strong>and</strong><br />
subdivision of the original farm unit. They also restrict use of some resources, such as gravel,<br />
to on-site development.<br />
3.1.1.4.7 Anchorage<br />
The majority of l<strong>and</strong> suitable for development in Anchorage has been developed, <strong>and</strong> the<br />
zoning of vacant l<strong>and</strong> must be used to guide future development. Anchorage 2020 defines<br />
areas for more intensive commercial development as Major Employment Centers (3);<br />
Redevelopment/Mixed Use Areas (3); Town Centers (7), <strong>and</strong> Neighborhood Commercial<br />
Centers (10). A natural Open Space has been added as a new l<strong>and</strong> use category to support a<br />
sustainable <strong>and</strong> accessible network of recreational facilities, parks, trails, <strong>and</strong> undeveloped<br />
l<strong>and</strong> for the purpose of “preserving <strong>and</strong> enhancing the scenic vistas, fish, wildlife, <strong>and</strong> plant<br />
habitats <strong>and</strong> their ecological functions <strong>and</strong> values.”<br />
The inset in Figure 3.6 shows that the Government Hill neighborhood is primarily zoned for<br />
residential uses. The commercial <strong>and</strong> industrial zones are at the intersection of East Loop <strong>and</strong><br />
East Bluff Roads. All of these are bordered on the south by a zone designated as “Public,”<br />
which corresponds to the location of the Government Hill Greenbelt, Harvard Park, <strong>and</strong><br />
Sunset Park.<br />
Conservation of residential l<strong>and</strong>s for housing is a high community priority, <strong>and</strong> the overall<br />
goal for residential development is “a variety of housing types <strong>and</strong> densities in safe, attractive<br />
neighborhoods that offer a choice of urban, suburban, <strong>and</strong> rural lifestyles ….” The zoning<br />
ordinance establishes residential development near the designated Redevelopment/Mixed<br />
Use area <strong>and</strong> the Town Centers with medium-to-high densities.<br />
A substantial amount of commercial <strong>and</strong> industrial l<strong>and</strong> in use within the Anchorage Bowl is<br />
underdeveloped. For several decades, the Central <strong>and</strong> Southwest Areas of Anchorage have<br />
been, <strong>and</strong> remain, the key areas of industrial development. The Central Planning Area <strong>and</strong><br />
Ship Creek Area contain a significant portion of the underutilized industrial property in<br />
Anchorage. Much of the existing industrial l<strong>and</strong> use, such as the tank farm, requires marine,<br />
railroad, <strong>and</strong> road access. This area is unique in that it has access to the various<br />
transportation modes <strong>and</strong> is zoned “marine industrial” <strong>and</strong> “heavy industrial.” There are three<br />
Industrial Reserve Areas to ensure that strategically located l<strong>and</strong> is predominantly used for<br />
industrial purposes.<br />
12/18/07 Page 3-19
<strong>Knik</strong> <strong>Arm</strong> Crossing DraftFinal EIS<br />
<strong>Affected</strong> <strong>Environment</strong><br />
3.1.1.5 Population density<br />
Population density in the region can be seen on Figure 3.7. The highest population densities<br />
occur in the Anchorage Bowl, Chugiak-Eagle River area, <strong>and</strong> the Mat-Su Core Area.<br />
By 2020, the population of the Anchorage Bowl is estimated to increase by 81,800, with a<br />
corresponding 31,600 additional housing units. By the year 2020, another 22,700 residents<br />
are forecast for the Chugiak-Eagle River area. This area is also expected to add another<br />
7,300 housing units (Anchorage 2020:58). The population in Anchorage is expected to<br />
reach 391,000 by 2030. Population in the Mat-Su is expected to reach 108,000 by 2030<br />
(ISER 2001). Anchorage 2020 (Table 8 of Anchorage 2020) overestimated the<br />
2005 population in the Anchorage Bowl at 238,300; actual 2005 Anchorage Bowl population<br />
was 229,400, a difference of 8,900 people, or about 4 percent lower than anticipated<br />
(KABATA 2006h).<br />
3.1.2 L<strong>and</strong> Use Plans <strong>and</strong> Policies<br />
The KAC project is currently not detailed in Anchorage 2020 or the Matanuska-Susitna<br />
Borough-Wide Comprehensive Plan. Each plan will require updating to recognize <strong>and</strong><br />
effectively manage the implementation of the project. On October 18, 2005, the Anchorage<br />
Municipal Assembly passed a resolution supporting the <strong>Knik</strong> <strong>Arm</strong> Crossing project in<br />
furtherance of the goals of Anchorage 2020, subject to the resolution of the required<br />
economic <strong>and</strong> environmental issues.<br />
3.1.2.1 Mat-Su Borough plans<br />
3.1.2.1.1 Matanuska-Susitna Borough-Wide Comprehensive Plan<br />
Matanuska-Susitna Borough-Wide Comprehensive Plan (1970) was originally adopted<br />
in 1970. Since then, the plan has been updated <strong>and</strong> amended through the adoption of<br />
community-based plans, specific plans such as the Mat-Su Borough Long-Range<br />
Transportation Plan <strong>and</strong> Big Lake, Lake Management Plan (Big Lake Citizen’s Advisory<br />
Committee, USKH, Dames & Moore 1988), <strong>and</strong> plans prepared by the State of Alaska.<br />
New growth has also brought new industries <strong>and</strong> technologies to the Mat-Su. Some of these<br />
new industries <strong>and</strong> technologies, such as communication towers, waste incinerators, <strong>and</strong> oil<br />
<strong>and</strong> gas development, have created compatibility issues in residential neighborhoods <strong>and</strong><br />
recreational areas. The Mat-Su Borough recently updated its comprehensive plan to address<br />
borough-wide population growth <strong>and</strong> development compatibility issues, as well as public <strong>and</strong><br />
private infrastructure. The Matanuska-Susitna Borough Comprehensive Plan 2005 Update<br />
was adopted by the Borough Assembly in January 2006. The updated comprehensive plan<br />
will help in managing these <strong>and</strong> other l<strong>and</strong> uses to enhance the quality of life of Mat-Su<br />
residents while also improving <strong>and</strong> diversifying the local economy.<br />
Page 3-20 12/18/07
<strong>Knik</strong> <strong>Arm</strong> Crossing DraftFinal EIS<br />
<strong>Affected</strong> <strong>Environment</strong><br />
Figure 3.7. Population density – 2000<br />
12/18/07 Page 3-21
<strong>Knik</strong> <strong>Arm</strong> Crossing DraftFinal EIS<br />
<strong>Affected</strong> <strong>Environment</strong><br />
AS § 29.40.030 requires that a local community’s comprehensive plan address, at a<br />
minimum, three issues: l<strong>and</strong> use, transportation, <strong>and</strong> public facilities. The Mat-Su subarea<br />
comprehensive plans within the affected environment of the KAC project are described<br />
below.<br />
3.1.2.1.2 The Matanuska-Susitna Borough: Core Area Comprehensive Plan<br />
This plan (MSB 2003a) is being updated <strong>and</strong> has yet to be approved by the Borough<br />
Assembly. Until the plan is adopted by the Borough Assembly, it could be changed at any<br />
time. The Core Area is essentially the unincorporated areas between the cities of Palmer <strong>and</strong><br />
Wasilla. Although the Core Area is outside of the KAC project’s Study Area it is useful to<br />
look at its l<strong>and</strong> use issues, goals, <strong>and</strong> implementation recommendations. The plan describes<br />
l<strong>and</strong> use issues, goals, <strong>and</strong> recommendations for implementation. It states that the diversity of<br />
the people living in the Core Area is recognized <strong>and</strong> should be addressed through<br />
encouraging a variety of residential opportunities, including housing types, densities, <strong>and</strong><br />
styles. The plan states that a variety of safe, convenient, attractive, <strong>and</strong> efficient commercial<br />
areas are desired, <strong>and</strong> that these areas should be encouraged in places that have good access<br />
<strong>and</strong> visibility. The plan encourages the use of existing infrastructure <strong>and</strong> services by new<br />
industrial development. It also encourages location of these improvements in areas that<br />
minimize negative environmental impacts. The plan encourages the upkeep <strong>and</strong> enhancement<br />
of existing parks <strong>and</strong> recreational areas, <strong>and</strong> the use of l<strong>and</strong>s for farming at a level<br />
determined by the marketplace <strong>and</strong> individual initiative.<br />
3.1.2.1.3 City of Houston Comprehensive Plan<br />
This plan (City of Houston 1999) presents existing conditions in Houston <strong>and</strong> specifically<br />
details how the residents <strong>and</strong> planners envision the city developing in the future. It outlines<br />
strategic implementation policies to guide development in the manner envisioned. The<br />
overall goal of development as defined by the City is to strive to encourage a moderate level<br />
of growth that will provide an economic base for employment opportunities, while becoming<br />
more independent of external governmental or economic factors <strong>and</strong> activities. To maintain a<br />
rural residential atmosphere, residential development is encouraged only in areas zoned for<br />
residential use. Low-density, large lot development would prevail, <strong>and</strong> specific areas are to<br />
be set aside for medium-density, affordable housing <strong>and</strong> rental property. To prevent strip<br />
malls, nonlinear patterns of development are encouraged, <strong>and</strong> commercial development is to<br />
occur only in designated commercial zones such as Neighborhood Commercial Zones; mixed<br />
commercial <strong>and</strong> residential l<strong>and</strong> uses are to be avoided. To ensure that l<strong>and</strong> is available for<br />
industrial development, but not adjacent to residential development, industrial l<strong>and</strong> uses are<br />
encouraged to be located in areas that complement business <strong>and</strong> commercial services. The<br />
plan encourages the preservation of geological hazard areas <strong>and</strong> promotes that marginal l<strong>and</strong>s<br />
with no existing development be converted to recreational uses or left undeveloped. In<br />
addition to exp<strong>and</strong>ing existing recreation areas, the development of more parks, greenbelts,<br />
<strong>and</strong> recreation areas is encouraged as part of the residential development process.<br />
Page 3-22 12/18/07
<strong>Knik</strong> <strong>Arm</strong> Crossing DraftFinal EIS<br />
<strong>Affected</strong> <strong>Environment</strong><br />
3.1.2.1.4 <strong>Knik</strong>-Fairview Comprehensive Plan<br />
This plan (MSB 1997a) is an outline to ensure that residents’ lives <strong>and</strong> natural <strong>and</strong> other<br />
environmental resources are not negatively affected by future growth. The plan encourages a<br />
minimum lot size of 1 acre for new development <strong>and</strong> infill of areas with vacant lots <strong>and</strong> roads<br />
<strong>and</strong> utilities. The overall goal is to maintain the existing pattern of low-density, rural<br />
residential settlement. The plan promotes commercial development around existing<br />
commercial uses, with conditional permitting on a limited basis outside these areas. It also<br />
notes that buffering should be used to minimize l<strong>and</strong> use conflicts between incompatible<br />
uses. The plan calls for light industrial uses to be permitted within established industrial use<br />
areas <strong>and</strong> to be considered for conditional permits in other areas. Heavy industrial uses would<br />
be conditionally permitted within industrial use areas <strong>and</strong> would not be allowed in any other<br />
areas. Hazardous waste sites are prohibited from the entire area. The Palmer Hay Flats State<br />
Game Refuge is the main focus of the plan. The plan encourages a variety of recreational,<br />
educational, <strong>and</strong> scientific uses of the area, while protecting, preserving, <strong>and</strong> enhancing its<br />
habitat, fish, <strong>and</strong> wildlife populations. The plan also considers education, public safety,<br />
cultural <strong>and</strong> recreational facilities, water <strong>and</strong> sewer services, <strong>and</strong> transportation networks.<br />
The plan points out that the <strong>Knik</strong>-Fairview area functions as a residential suburb of Wasilla<br />
<strong>and</strong> Anchorage <strong>and</strong> is heavily dependent on those areas for employment, goods, <strong>and</strong> services.<br />
3.1.2.1.5 Big Lake Comprehensive Plan<br />
This plan (MSB 1995b) outlines a vision to maintain the residential <strong>and</strong> recreational<br />
character of the Big Lake area. Any development within the community should be<br />
compatible with maintaining <strong>and</strong> conserving the natural environment. The plan encourages<br />
developers of residential uses to apply for designation as residential l<strong>and</strong> use districts <strong>and</strong><br />
encourages the location of commercial development within an appropriate community core,<br />
where commercial activity will not interfere with other uses <strong>and</strong> will be supported by existing<br />
infrastructure. The plan supports regional industrial development within appropriate areas,<br />
but prohibits heavy industrial activity. The railroad corridor would make industrial<br />
development more viable. The plan recognizes Big Lake as a hub of recreational activities<br />
for the area <strong>and</strong> recommends that an additional plan be written that specifically addresses the<br />
parks <strong>and</strong> recreational activities. Water <strong>and</strong> sewer, electric power, telephone, solid waste<br />
disposal, natural gas, postal service, transportation networks, <strong>and</strong> timber resources on public<br />
l<strong>and</strong>s are addressed.<br />
3.1.2.1.6 City of Palmer Comprehensive Plan<br />
This plan (City of Palmer 1993) concentrates on providing direction over a 5-year period,<br />
from 1993 to 1998 <strong>and</strong> provides general guidance beyond that time period. Palmer has<br />
continued to secure its position as the center for government in the Mat-Su. Both Palmer <strong>and</strong><br />
the surrounding area have experienced continued growth in the commuting population that<br />
has coincided with decreasing state <strong>and</strong> borough support for civic services. The City has<br />
taken on increased responsibilities <strong>and</strong> is attempting to fill the gap left by the downsizing of<br />
other government agencies. Recommendations in the plan include increased economic<br />
development, tourism, continued high quality of life, continued growth of the city,<br />
transportation, <strong>and</strong> improved government services.<br />
12/18/07 Page 3-23
<strong>Knik</strong> <strong>Arm</strong> Crossing DraftFinal EIS<br />
<strong>Affected</strong> <strong>Environment</strong><br />
3.1.2.1.7 City of Wasilla Comprehensive Plan<br />
This plan (City of Wasilla 1986) is a compilation of information, projections, <strong>and</strong> policies,<br />
which is intended to be a general guide for future growth <strong>and</strong> development of the city of<br />
Wasilla. Continued growth of the area has made Wasilla the ninth-largest city in Alaska. The<br />
City Council <strong>and</strong> Planning <strong>and</strong> Utilities Commission use this plan as a resource for decision<br />
making. The plan includes chapters on physical characteristics, population <strong>and</strong> the economy,<br />
l<strong>and</strong> use, public facilities <strong>and</strong> services, transportation, <strong>and</strong> implementation. Special emphasis<br />
was devoted to transportation planning for Wasilla’s new airport to <strong>and</strong> conceptual planning<br />
to prepare for the reuse of the town’s old airport.<br />
3.1.2.2 Plans in Anchorage<br />
Anchorage 2020 is extensively discussed throughout Section 3.1 as the current plan that<br />
influences l<strong>and</strong> use in the Anchorage portion of the Study Area. The Municipality of<br />
Anchorage’s LRTP <strong>and</strong> the plan’s relationship to the proposed KAC project are discussed in<br />
Section 3.1.1.1. Besides these two plans, the following plan also influences l<strong>and</strong> use in the<br />
Study Area:<br />
3.1.2.2.1 Port of Anchorage Intermodal Marine Facility (2002)<br />
This plan is an update to the Port of Anchorage Master Plan (POA 1999a) <strong>and</strong> calls for<br />
expansion of the port areas in phases to accommodate port users through 2020. The plans call<br />
for improving existing facilities, improving existing access, <strong>and</strong> exp<strong>and</strong>ing terminals<br />
dependent on actual versus forecast population increases. Two addenda to the master plan<br />
were prepared to consider ways to upgrade the port’s dock. They include the Intermodal<br />
Marine Facility <strong>and</strong> the Expansion Study under Phase I of the plan.<br />
3.1.2.2.2 Freight Mobility Study<br />
This study (MOA 2001b) provides insight into the physical <strong>and</strong> regulatory needs of the<br />
freight industry to promote reliable <strong>and</strong> cost effective means to circulate freight within the<br />
city <strong>and</strong> to other destinations served by the hub. The study presents the concept of developing<br />
a primary east-west corridor from the POA to a point on the Glenn Highway near Eagle<br />
River. The route would reduce some of the freight traffic going through the city. A general<br />
objective of the study is to support the coordination between transport modes to reduce<br />
conflicts <strong>and</strong> capital improvement costs. This study relates to freight movement within<br />
AMATS.<br />
3.1.2.2.3 Ship Creek Multi-Modal Transportation Plan<br />
This transportation plan for the Ship Creek area includes extension of the Ingra-Gambell<br />
Couplet, improved truck routing, <strong>and</strong> improved circulation. The plan (MOA 2000) includes<br />
protection of the livability of the Government Hill neighborhood. Further, the plan includes<br />
enhanced automobile circulation to benefit development <strong>and</strong> redevelopment of the area,<br />
maintenance of the integrity <strong>and</strong> operational effectiveness of the rail yard, <strong>and</strong> improvement<br />
of the pedestrian/recreational environment along Ship Creek.<br />
Page 3-24 12/18/07
<strong>Knik</strong> <strong>Arm</strong> Crossing DraftFinal EIS<br />
<strong>Affected</strong> <strong>Environment</strong><br />
3.1.2.2.4 Ship Creek Development Draft Master Plan<br />
The Ship Creek area has been the focus of several community improvement projects, as well<br />
as improvements by ARRC, which has its main yard facility in Ship Creek. The purpose of<br />
this plan (ARRC 1999) was to identify opportunities south of Ship Creek that could integrate<br />
this area into Downtown Anchorage. The plan proposes development of community<br />
apartments <strong>and</strong> condominiums, integration of retail <strong>and</strong> office development, <strong>and</strong> construction<br />
of a convention center <strong>and</strong> an intermodal transfer center. It also offers suggestions for<br />
pavilions <strong>and</strong> for a walking connection to Downtown.<br />
3.1.2.3 State <strong>and</strong> local management plans<br />
State <strong>and</strong> local l<strong>and</strong> management plans that might affect the planning area include the<br />
following. Each addresses allowable uses <strong>and</strong> provides guidance for future development<br />
projects.<br />
• Big Lake Management Plan (MSB 1998)<br />
• Point MacKenzie Area Which Merits Special Attention Plan (MSB 1995a)<br />
• Susitna Basin Recreation Rivers Management Plan (ADNR 1991)<br />
• Matanuska-Susitna Borough 1990 Solid Waste Management Plan Update (MSB 1990)<br />
• Matanuska-Susitna Borough Coastal Management Plan (MSB 1987)<br />
• Susitna Flats State Game Refuge Management Plan (ADF&G 1987)<br />
• Matanuska-Susitna Borough Comprehensive Development Plan: Public Facilities<br />
(MSB 1984b)<br />
• Matanuska-Susitna Borough Comprehensive Development Plan: Transportation<br />
(MSB 1984a)<br />
• Fish Creek Management Plan (ADNR 1984)<br />
• Willow Sub-Basin Area Plan (ADNR 1982)<br />
3.1.3 Farml<strong>and</strong><br />
The Farml<strong>and</strong> Protection Policy Act (7 United States Code [U.S.C.] § 4201) <strong>and</strong> the Food<br />
Security Act (16 U.S.C § 3811) require federal agencies to consider the adverse effects of<br />
their projects on farml<strong>and</strong>s (including the extent to which prime, unique, <strong>and</strong> other farml<strong>and</strong><br />
[of statewide or local importance] will be affected). As defined by the U.S. Department of<br />
Agriculture, there are no prime or unique farml<strong>and</strong>s in Alaska because soil temperatures do<br />
not meet the threshold established by Congress. No unique farml<strong>and</strong>s have been designated<br />
in Alaska, nor have any farml<strong>and</strong>s of statewide importance. The Palmer, Wasilla, <strong>and</strong> Upper<br />
Susitna Soil <strong>and</strong> Water Conservation Districts have adopted criteria for farml<strong>and</strong>s of local<br />
importance for l<strong>and</strong>s within their district boundaries. The Point MacKenzie Agricultural<br />
Area, in the Mat-Su, meets these criteria. The proposed project road would lie along the east<br />
side of this protected area, on the alignment of the existing Point MacKenzie Road.<br />
3.1.3.1 Existing agricultural l<strong>and</strong><br />
The Economic Development Plan, Matanuska-Susitna Borough, Alaska (2002) identifies<br />
agriculture as one of the strengths in the borough’s economy. The Matanuska-Susitna<br />
12/18/07 Page 3-25
<strong>Knik</strong> <strong>Arm</strong> Crossing DraftFinal EIS<br />
<strong>Affected</strong> <strong>Environment</strong><br />
Borough: Core Area Plan (2003a) encouraged the use of l<strong>and</strong>s for farming at a level<br />
determined by the marketplace <strong>and</strong> individual initiative.<br />
3.1.3.1.1 Point MacKenzie Agricultural Area<br />
Since Alaska’s early statehood, the Point MacKenzie Agricultural Area has been important in<br />
the Borough’s attempts to stimulate more local agricultural activity. The Point MacKenzie<br />
Agricultural Area (Figure 1.1) contains 14,893 acres (23.3 square miles) for dairy farming<br />
<strong>and</strong> general agricultural use. “Summary: Matanuska-Susitna Borough Agricultural L<strong>and</strong> Sale<br />
Programs” (2004) describes the history <strong>and</strong> process for the conveyance of these l<strong>and</strong>s for<br />
agricultural purposes. The Mat-Su Borough acquired l<strong>and</strong> from the State of Alaska as MEL,<br />
beginning with the borough’s formation in 1964. In 1970, a Borough ordinance provided for<br />
a Mat-Su Preferential Agricultural L<strong>and</strong> Program. This statute was repealed in 1974 <strong>and</strong> was<br />
replaced by one that provided for Agricultural L<strong>and</strong> Sales that had the effect of restricting<br />
future l<strong>and</strong> uses to agriculture. A farm unit buyer purchased the agricultural rights. Fee<br />
simple acquisition of the l<strong>and</strong> for a farm residence or other farm-related facility required an<br />
act of the Assembly. The Borough retained the development rights to the l<strong>and</strong> for residential,<br />
commercial, or industrial uses.<br />
In the 1990s, the Borough expended considerable time <strong>and</strong> other resources recovering<br />
agricultural parcels that had been sold to individuals who later defaulted under the Borough’s<br />
terms of sale or lease. The soils proved not as favorable to agriculture as original soil tests<br />
had suggested. The Point MacKenzie soils are much drier than anticipated; adequate crop<br />
yields require irrigation systems that are expensive <strong>and</strong>, therefore, have not been undertaken<br />
to any substantial degree. The productivity of the l<strong>and</strong> is also constrained by its low fertility,<br />
depth to s<strong>and</strong>, <strong>and</strong> relatively high late-summer precipitation (restricting access to fields <strong>and</strong><br />
delaying harvest, thereby negatively affecting the quality <strong>and</strong> yield of crops). Dominant crops<br />
included timothy grass, oats, <strong>and</strong> barley as forage. The l<strong>and</strong>s’ original primary agricultural<br />
use, dairy farming, has not provided farmers with a self-sufficient income. Damage from<br />
heavy snow loads on inadequately designed <strong>and</strong> constructed dairy buildings also has<br />
contributed to farm failures. 7 Because working dairy l<strong>and</strong> is not that profitable (there are still<br />
five dairies in the Area), most hay production is currently being sold as horse feed. 8<br />
In 1994, the Borough repealed <strong>and</strong> replaced the 1974 ordinance with one under which the<br />
Borough’s fee estate is conveyed by quitclaim deed <strong>and</strong> the title becomes subject to a<br />
recorded Declaration of CCRs to promote agriculture use. The CCRs, among other effects,<br />
limit improvement sites, residential locations, <strong>and</strong> subdivision of the original farm unit.<br />
In 1997, Alaska Statutes 38.05.321 was amended (Chapter 20, Session Laws of Alaska<br />
[SLA] 1997—originally known as Senate Bill [SB] 109) to ease restrictions on the<br />
subdivision of agricultural l<strong>and</strong>s. This served to allow farmers to subdivide their l<strong>and</strong> into<br />
smaller farm parcels so that the resultant lots could be sold with the right to construct<br />
7 Personal communication, Kirk McGee, Vice President for Real Estate at Cook Inlet Region, Inc., in personal<br />
interview with William Chopyk, April 4, 2005.<br />
8 Personal communication, Larry Devilbiss, Division Chief in the State Division of Agriculture, in personal<br />
interview with Marcus Hartley, April 4, 2005.<br />
Page 3-26 12/18/07
<strong>Knik</strong> <strong>Arm</strong> Crossing DraftFinal EIS<br />
<strong>Affected</strong> <strong>Environment</strong><br />
housing. For the Point MacKenzie Agricultural Area, an appraisal at the farmer’s expense is<br />
required to determine the price the farmer must pay the Borough to acquire house<br />
construction rights.<br />
Thus, over the past 35 years, while the Mat-Su Borough has retained jurisdiction over the<br />
Point MacKenzie Agricultural Area, the Borough has gradually loosened requirements<br />
regarding restrictions on the l<strong>and</strong>’s solitary use for agriculture. The anticipated economical<br />
feasibility of the l<strong>and</strong>’s productivity for agricultural pursuits has not been realized. As<br />
discussed in Section 3.5.3.2, soils on the west side of Burma <strong>and</strong> Point MacKenzie Roads,<br />
including those associated with the Point MacKenzie Agricultural Area, exhibit some of the<br />
best conditions for construction of homesites <strong>and</strong> small commercial buildings. In the future,<br />
the l<strong>and</strong> will likely be under continuing pressure to be designated for protection under its<br />
highest <strong>and</strong> best use, <strong>and</strong> agricultural applications may not be that use.<br />
3.2 Social <strong>Environment</strong><br />
3.2.1 Neighborhoods, Community Cohesion, <strong>and</strong> <strong>Environment</strong>al Justice<br />
This section provides a socioeconomic picture of communities, neighborhoods <strong>and</strong> tribes in<br />
the Mat-Su <strong>and</strong> Anchorage for the KAC project. The communities, neighborhoods <strong>and</strong> tribes<br />
in the Study Area include Point MacKenzie, <strong>Knik</strong> Tribal Council, Native Village of Eklutna,<br />
Government Hill, <strong>and</strong> Elmendorf. The information presented includes a written or graphical<br />
depiction of community or neighborhood boundaries, a summary of socioeconomic<br />
conditions within the communities <strong>and</strong> neighborhoods, <strong>and</strong> a brief description of residents’<br />
concerns <strong>and</strong> values within the different communities <strong>and</strong> neighborhoods. Executive Order<br />
(EO) 12898 requires federal agencies to incorporate consideration of environmental justice<br />
into the NEPA evaluation process. Therefore, this section also analyzes the demographics of<br />
those communities <strong>and</strong> neighborhoods in the Study Area for the KAC project that contain<br />
minority or low-income persons. Additional information about Point MacKenzie, <strong>Knik</strong> Tribal<br />
Council, Native Village of Eklutna, Government Hill, Elmendorf, <strong>and</strong> Anchorage can be<br />
found in other sections. Section 3.2.4 presents community facilities <strong>and</strong> public services,<br />
Section 3.2.5 presents population, <strong>and</strong> Section 3.4 presents the economic environment.<br />
3.2.1.1 Neighborhood <strong>and</strong> community characteristics<br />
3.2.1.1.1 Point MacKenzie<br />
Point MacKenzie has little residential or commercial development. As shown in Figure 3.7, it<br />
encompasses an area of about 148 square miles <strong>and</strong> has a population density of about<br />
1.4 people per square mile.<br />
In 2000, 56.4 percent of all housing units in the Point MacKenzie area were used mainly for<br />
recreational or seasonal purposes; no cohesive or well-defined neighborhoods, however,<br />
exist. Many of these seasonal-use homes are owned by Anchorage residents. Many of the<br />
year-round residents of the Point MacKenzie area were drawn to the area by the prospects of<br />
inexpensive l<strong>and</strong> <strong>and</strong> the possibility of living far away from population centers. In 2000,<br />
92 percent of the area’s residents were White. Their median household income of $23,250<br />
in 1999 was only 45 percent of the median income of all Mat-Su residents. The percentage of<br />
12/18/07 Page 3-27
<strong>Knik</strong> <strong>Arm</strong> Crossing DraftFinal EIS<br />
<strong>Affected</strong> <strong>Environment</strong><br />
Point MacKenzie residents with incomes below the poverty level decreased from<br />
34.1 percent in 1989 to 22.7 percent in 1999, but the percentage in 1999 was still twice that<br />
of the entire Mat-Su.<br />
Community surveys indicate that a major attraction for residents of the Mat-Su is the ability<br />
to experience the qualities of rural Alaska within easy driving distance of Anchorage.<br />
Preservation of the rural nature of communities <strong>and</strong> the associated lifestyle is a high priority,<br />
especially in low-density, small communities such as Houston, Meadow Lakes, <strong>and</strong> Big<br />
Lake. Community surveys, however, indicate that residents of the more densely populated<br />
Palmer-Wasilla Core Area also continue to place a high priority on maintaining low-density<br />
residential subdivisions interspersed with undeveloped l<strong>and</strong>s. Accompanying this desire to<br />
retain uncluttered l<strong>and</strong>scapes <strong>and</strong> a rural character is a perceived need by some residents to<br />
place limitations on l<strong>and</strong> development <strong>and</strong> population growth. One aspect of development<br />
that especially concerns Mat-Su residents is traffic congestion.<br />
3.2.1.1.2 <strong>Knik</strong> Tribal Council <strong>and</strong> Native Village of Eklutna<br />
Members of the <strong>Knik</strong> Tribal Council <strong>and</strong> the Native Village of Eklutna Tribes reside in <strong>Knik</strong>,<br />
Eklutna, Anchorage, the Mat-Su Valley, <strong>and</strong> elsewhere.<br />
<strong>Knik</strong> Tribal Council<br />
The <strong>Knik</strong> Tribal Council is a federally recognized tribe <strong>and</strong> its members are located on the<br />
northwest bank of <strong>Knik</strong> <strong>Arm</strong> northwest of Anchorage in the Mat-Su. By road, the <strong>Knik</strong><br />
Tribal Council is located south of Wasilla, Big Lake, <strong>and</strong> Meadow Lakes, off of <strong>Knik</strong>-Goose<br />
Bay Road <strong>and</strong> Fairview Loop Road (Figure 3.1), a distance of 37 miles. <strong>Knik</strong> has long been<br />
home to Tanaina Athabascans; 8.7 percent of the population is Alaska Native or part Native.<br />
This community is relatively large—over 2,600 homes—<strong>and</strong> supports a diverse population.<br />
The 2000 U.S. Census identified 2,593 total housing units. Of the 218 vacant housing units,<br />
61 are used only seasonally. Although 2,789 residents were employed, the unemployment<br />
rate at that time was 13.45 percent (44.38 percent of all adults were not in the work force).<br />
The median household income was $52,113, per capita income was $20,895, <strong>and</strong><br />
11.1 percent of residents were living below the poverty level (Alaska Division of Community<br />
Advocacy 2006). The low housing costs, the semirural lifestyle, <strong>and</strong> a tolerable commute to<br />
Anchorage have supported growth in the Mat-Su Valley.<br />
Native Village of Eklutna<br />
The Native Village of Eklutna is a federally recognized tribe located at the head of <strong>Knik</strong> <strong>Arm</strong><br />
of Cook Inlet, at the mouth of the Eklutna River, 25 miles northeast of Anchorage<br />
(Figure 3.1). It is within the boundaries of Anchorage. The Eklutna area was the site of many<br />
Athabascan Indian villages as long as 800 years ago. Today’s residents are descendants of<br />
the Dena’ina tribe <strong>and</strong> continue to value their traditional lifestyle. Approximately<br />
65 residents are members of the Eklutna Village. The Native Village of Eklutna will<br />
strengthen its Tribal Nation by exercising its inherent powers to protect the past, present, <strong>and</strong><br />
future of the Tribal membership.<br />
Page 3-28 12/18/07
<strong>Knik</strong> <strong>Arm</strong> Crossing DraftFinal EIS<br />
<strong>Affected</strong> <strong>Environment</strong><br />
The majority of non-Native residents are employed in Anchorage, with incomes averaging<br />
$31,679 per capita, according to the 2000 U.S. Census. Eklutna’s Dena’ina residents,<br />
however, have significantly lower incomes—averaging $19,494 per capita (Alaska Division<br />
of Community Advocacy 2006).<br />
3.2.1.1.3 Government Hill<br />
Established in 1915, Government Hill is the oldest of Anchorage’s 37 designated<br />
neighborhoods. As can be seen in Figure 3.8, it is a well-defined neighborhood because of its<br />
geographical isolation from most of Anchorage by Ship Creek. It is bounded by Elmendorf, a<br />
bluff overlooking the POA fuel tank farm along the <strong>Knik</strong> <strong>Arm</strong> shoreline, <strong>and</strong> the Alaska<br />
Railroad rail yard. The small commercial district in the vicinity of the Sourdough Visitors<br />
Lodge, a motel used for daily <strong>and</strong> short-term housing, is characterized by small, locally<br />
owned shops <strong>and</strong> eateries. The only gas station <strong>and</strong> convenience store in the neighborhood<br />
are also located in this commercial district. The locations of the hotel <strong>and</strong> other buildings in<br />
Government Hill are shown in Figure 3.8. Most residences <strong>and</strong> community facilities (parks,<br />
schools, houses of worship, neighborhood-serving businesses, etc.) are accessible by an easy<br />
walk, bicycle ride, or short drive. None of the students attending Government Hill<br />
Elementary School ride a school bus; all students either walk or arrange alternative<br />
transportation.<br />
12/18/07 Page 3-29
<strong>Knik</strong> <strong>Arm</strong> Crossing DraftFinal EIS<br />
<strong>Affected</strong> <strong>Environment</strong><br />
Figure 3.8. Government Hill neighborhood<br />
Page 3-30 12/18/07
<strong>Knik</strong> <strong>Arm</strong> Crossing DraftFinal EIS<br />
<strong>Affected</strong> <strong>Environment</strong><br />
A variety of nonprofit community organizations in Government Hill offer services <strong>and</strong><br />
programs to families residing in the immediate neighborhood or other areas of Anchorage. A<br />
listing of known facilities <strong>and</strong> services is provided in Table 3-6.<br />
Table 3-6. Nonprofit organizations in Government Hill offering social <strong>and</strong><br />
recreational services<br />
Facility<br />
Calvary Baptist Church<br />
Cornerstone Baptist Church<br />
Lighthouse Christian Fellowship<br />
Church<br />
Lighthouse Christian Fellowship<br />
Church Childcare <strong>and</strong> Education<br />
Center<br />
Anchorage Square & Round Dance<br />
Club<br />
Anchorage Curling Club<br />
Catholic Social Services’ Beyond<br />
Shelter Program<br />
Source: Northern Economics, Inc., 2005<br />
Religious services<br />
Religious services<br />
Services provided<br />
In addition to providing religious services, the nondenominational church<br />
offers a youth tutoring program <strong>and</strong> participates in food distribution<br />
programs organized by Food Bank of Alaska.<br />
The Christian-based childcare center offers a range of services, including<br />
infant/toddler care, preschool, after-school care, <strong>and</strong> summer programs<br />
(ages K-12 years).<br />
The dance facility is used by many dance organizations in Anchorage for<br />
classes.<br />
The club offers classes <strong>and</strong> provides teams to participate in events<br />
sponsored by state <strong>and</strong> national curling associations. Members are from<br />
the greater Anchorage area.<br />
The program assists people in the transition from homelessness to<br />
permanent, independent living by providing case management <strong>and</strong> other<br />
supportive services.<br />
As shown in the inset on Figure 3.3, the predominant l<strong>and</strong> use in this neighborhood is<br />
residential. According to U.S. Census Bureau data, residences in Government Hill were<br />
predominately renter-occupied, multifamily housing units in 2000; however, the<br />
development of single family housing increased between 1990 <strong>and</strong> 2000. In 1990, 86 percent<br />
of Government Hill housing was multifamily housing—particularly large apartment<br />
buildings. Figure 3.7 shows that the density of Government Hill is 476 to 719 persons per<br />
square mile, which is typical for the urbanized area of Anchorage <strong>and</strong> the Mat-Su. By 2000,<br />
79 percent of housing units were multifamily housing, while the number of single-family<br />
homes had increased 7 percent <strong>and</strong> the total number of units in large apartment buildings had<br />
fallen by roughly half.<br />
Figure 3.6 shows that the primary zoning district in Government Hill is residential.<br />
Redevelopment of lots in Government Hill (<strong>and</strong> other older Anchorage neighborhoods)<br />
occurred as people purchased lots with older, large buildings, tore down the buildings, <strong>and</strong><br />
built new single-family or smaller, multifamily housing units. 9<br />
9 Personal communication, Vicki Portwood, Anchorage Homebuilders Association, with Northern Economics,<br />
Inc., May 24, 2005.<br />
12/18/07 Page 3-31
<strong>Knik</strong> <strong>Arm</strong> Crossing DraftFinal EIS<br />
<strong>Affected</strong> <strong>Environment</strong><br />
The proposed redevelopment of the 15-acre Hollywood Vista site, located on the eastern<br />
edge of Government Hill on the bluff overlooking the Ship Creek valley will add 80 to<br />
100 attached <strong>and</strong> detached single-family residences, of which 90 percent will be priced at<br />
market value <strong>and</strong> 10 percent will be offered as affordable housing (Hollywood Vista was<br />
formerly all affordable housing). This redevelopment project will increase economic<br />
diversity on the east side of Government Hill by increasing the inventory of high-value,<br />
single-family homes in an area which has traditionally been dominated by high-density,<br />
affordable housing.<br />
In 2000, the median value of owner-occupied housing units in Government Hill<br />
was $142,500, as compared with $160,700 for all Anchorage owner-occupied housing units.<br />
Unlike most areas in Anchorage, Government Hill experienced a decrease in the value of<br />
housing in real dollars between 1990 <strong>and</strong> 2000. In recent years, however, housing values<br />
have likely increased substantially with the gentrification of areas of Government Hill,<br />
particularly at the west end where there are views of <strong>Knik</strong> <strong>Arm</strong>. 10 The proximity of<br />
Government Hill to downtown Anchorage contributes to the current appeal of the<br />
neighborhood.<br />
3.2.1.1.4 Elmendorf<br />
Elmendorf is the largest military installation in Alaska <strong>and</strong> is one of two major military bases<br />
in Anchorage, the other being Fort Richardson. About two-thirds of the military personnel at<br />
Elmendorf reside off-base in the communities of Anchorage, Eagle River, Wasilla, <strong>and</strong><br />
Palmer. However, there were 1,674 housing units at Elmendorf in 2000, <strong>and</strong> plans for<br />
Elmendorf housing include the renovation, demolition, <strong>and</strong> reconstruction of current housing<br />
stock, as well as the future construction of additional housing for the installation. Because of<br />
the frequent reassignment of military personnel to other duty stations, the average length of<br />
residency at Elmendorf is comparatively short.<br />
3.2.1.2 Community cohesion<br />
3.2.1.2.1 Point MacKenzie<br />
The geographic isolation <strong>and</strong> distance from neighbors have prevented a high degree of<br />
community cohesion among the few year-round residents of Point MacKenzie; however, it is<br />
likely that many residents have bonded over a shared appreciation of the natural beauty <strong>and</strong><br />
undeveloped character of the area.<br />
3.2.1.2.2 <strong>Knik</strong> Tribal Council <strong>and</strong> Native Village of Eklutna<br />
The <strong>Knik</strong> Tribal Council <strong>and</strong> the Native Village of Eklutna share cultural <strong>and</strong> traditional ties<br />
with one another through their family lineage <strong>and</strong> the use of the l<strong>and</strong>, water, <strong>and</strong> its<br />
resources. Although members of these two Tribes reside throughout Southcentral Alaska,<br />
geographically they are connected <strong>and</strong> have a historic practice of mutual respect for one<br />
10 Personal communication, Neil Thomas, Associate Broker, Coldwell Banker Fortune, with Donald Schug,<br />
September 16, 2005.<br />
Page 3-32 12/18/07
<strong>Knik</strong> <strong>Arm</strong> Crossing DraftFinal EIS<br />
<strong>Affected</strong> <strong>Environment</strong><br />
another’s ability to harvest for their families. Today these two Tribes are independently<br />
responsible for the wellness, education, <strong>and</strong> environmental health of their respective<br />
membership.<br />
Braund (KABATA 2004a) indicates that members of the <strong>Knik</strong> Tribal Council <strong>and</strong> Native<br />
Village of Eklutna Tribes place great value on maintaining cultural ties to traditional <strong>and</strong><br />
historic places <strong>and</strong> activities in <strong>Knik</strong> <strong>Arm</strong>. Grave sites <strong>and</strong> other traditional sites in the<br />
general Study Area continue to be of cultural significance to the Tribes. In addition, the <strong>Knik</strong><br />
Tribal Council <strong>and</strong> Native Village of Eklutna Tribes still consider the use of wild resources<br />
in the area to be of cultural, economic, <strong>and</strong> nutritional importance. Hunting, fishing, <strong>and</strong><br />
gathering activities continue, as they have for centuries.<br />
The <strong>Knik</strong> Tribal Council <strong>and</strong> the Native Village of Eklutna Tribes have a long history of<br />
hunting <strong>and</strong> gathering in the Upper Cook Inlet area. Throughout their history they have<br />
placed a great deal of value on their family ties <strong>and</strong> their ties to the l<strong>and</strong> <strong>and</strong> water where<br />
their traditional resources originate. To this day, fisheries, beluga whales, <strong>and</strong> the physical<br />
<strong>and</strong> natural environment remain highly valued.<br />
3.2.1.2.3 Government Hill<br />
Government Hill is a relatively small <strong>and</strong> isolated neighborhood, with a sizeable portion of<br />
its population consisting of long-time residents with a deep appreciation of the<br />
neighborhood’s historic significance. These <strong>and</strong> other factors have given rise to a high degree<br />
of community cohesion—that is, many residents have a “sense of belonging” to the<br />
neighborhood <strong>and</strong> have a high level of commitment to the community <strong>and</strong> a strong<br />
attachment to neighbors.<br />
A qualitative analysis of existing secondary data from community-level surveys was<br />
conducted in the affected area (Agnew::Beck Consulting 2004; Integra Realty<br />
Resources 2005; MOA 2001a; Smith 2005; University of Washington 2005). Characteristics<br />
valued by Anchorage residents include the natural beauty <strong>and</strong> setting; trails, parks,<br />
greenbelts, <strong>and</strong> undeveloped areas; cultural facilities <strong>and</strong> events; small-town “feel” with bigcity<br />
amenities; friendly, caring people; educational facilities <strong>and</strong> programs; <strong>and</strong> economic<br />
development/employment opportunities. Traffic congestion was an expressed concern, along<br />
with the need to become a more pedestrian-friendly city. In addition, many residents<br />
expressed the view that if housing prices increased, they would consider moving.<br />
No specific information was found on the level of community cohesion at Elmendorf.<br />
However, more general studies have remarked on the high priority that the U.S. military<br />
places on fostering community cohesion among military personnel <strong>and</strong> their families.<br />
Van Laar (1999) noted that a sense of community is perceived as being especially important<br />
in the military because of the extra pressures the military way of life places on military<br />
members <strong>and</strong> their dependents. On-base housing is one important way to enhance a sense of<br />
community; proximity facilitates social interaction, <strong>and</strong> the more people interact, the more<br />
likely they are to feel attached to one another (Van Laar 1999). In addition, offering the Base<br />
as a place for social gatherings, community meetings, <strong>and</strong> support groups helps to bring<br />
family <strong>and</strong> community members together. Even people who do not live on Base are<br />
12/18/07 Page 3-33
<strong>Knik</strong> <strong>Arm</strong> Crossing DraftFinal EIS<br />
<strong>Affected</strong> <strong>Environment</strong><br />
encouraged to participate in on-base programs, particularly those involving family members,<br />
<strong>and</strong> to take advantage of on-base services, such as the commissary <strong>and</strong> Base exchange,<br />
although they may be redundant with programs <strong>and</strong> facilities off-base (Van Laar 1999).<br />
3.2.1.3 <strong>Environment</strong>al justice<br />
EO 12898 11 states:<br />
Each federal agency shall make achieving environmental justice part of its mission<br />
by identifying <strong>and</strong> addressing, as appropriate, disproportionately high <strong>and</strong> adverse<br />
human health or environmental effects of its programs, policies, <strong>and</strong> activities on<br />
minority populations <strong>and</strong> low-income populations.<br />
The FHWA order “FHWA Actions to Address <strong>Environment</strong>al Justice in Minority<br />
Populations <strong>and</strong> Low-Income Populations” 12 contains the following definitions:<br />
• Low-Income: A household income at or below the poverty guidelines of the U.S.<br />
Department of Health <strong>and</strong> Human Services<br />
• Minorities:<br />
o Black (having origins in any of the black racial groups of Africa)<br />
o Hispanic (of Mexican, Puerto Rican, Cuban, Central or South American, or other<br />
Spanish culture or origin, regardless of race)<br />
o Asian-American (having origins in any of the original peoples of the Far East,<br />
Southeast Asia, the Indian subcontinent, or the Pacific Isl<strong>and</strong>s)<br />
o American Indian or Alaskan Native (having origins in any of the original people<br />
of North America <strong>and</strong> who maintain cultural identification through tribal<br />
affiliation or community recognition)<br />
EO 12898 also defines a “disproportionately high <strong>and</strong> adverse effect on minority <strong>and</strong> lowincome<br />
populations” as:<br />
An adverse effect that is predominantly borne by a minority population <strong>and</strong>/or a lowincome<br />
population; or will be suffered by the minority population <strong>and</strong>/or low-income<br />
population, <strong>and</strong> is appreciably more severe or greater in magnitude than the adverse<br />
effect that will be suffered by the non-minority population <strong>and</strong>/or non-low-income<br />
population.<br />
Note that “Hispanic” is not a race, but an ethnicity <strong>and</strong> is self-reported on Census forms.<br />
Hispanics, as defined above, are included as minorities for environmental justice purposes.<br />
Any disproportionately high <strong>and</strong> adverse effects on minority <strong>and</strong> low-income populations—<br />
environmental justice impacts—are identified in Section 4.2.1.<br />
11 Federal Register, February 11, 1994 [59(32):7629].<br />
12 FHWA, Order on FHWA Actions to Address <strong>Environment</strong>al Justice in Minority Populations <strong>and</strong><br />
Low-Income Populations, December 2, 1980.<br />
Page 3-34 12/18/07
<strong>Knik</strong> <strong>Arm</strong> Crossing DraftFinal EIS<br />
<strong>Affected</strong> <strong>Environment</strong><br />
3.2.1.3.1 Point MacKenzie<br />
No minority or low-income populations were identified in the Point MacKenzie portion of<br />
the Study Area.<br />
3.2.1.3.2 <strong>Knik</strong> Tribal Council <strong>and</strong> Native Village of Eklutna<br />
<strong>Environment</strong>al justice is not solely about disparate health or economic effects—it also<br />
applies when the cultural <strong>and</strong> historic resources of minority <strong>and</strong> low-income populations may<br />
be affected by a project (FHWA 2005c). Braund (KABATA 2004a) notes that prior to the<br />
arrival of the first Europeans in the Anchorage area in the late 1700s, the indigenous<br />
Dena’ina Athabascans (Dena’ina) resided in fish camps <strong>and</strong> winter villages that dotted both<br />
shores of <strong>Knik</strong> <strong>Arm</strong>. The development of Anchorage since its inception in 1915 resulted in<br />
the displacement of Dena’ina from traditional camps <strong>and</strong> harvest locations. Throughout the<br />
history of development, non-Natives expended little effort to consult with tribal members<br />
about impacts to Dena'ina traditional uses of the area.<br />
Although, the <strong>Knik</strong> Tribal Council <strong>and</strong> Native Village of Eklutna Tribes do not qualify under<br />
federal or state regulations as subsistence users because the greater Anchorage-Matanuska<br />
Valley region developed around their traditional l<strong>and</strong>s, <strong>and</strong> current federal <strong>and</strong> state<br />
regulations do not recognize “subsistence” in <strong>Knik</strong> <strong>Arm</strong> (KABATA 2004a). 13 The two<br />
Tribes, continue to participate in subsistence practices through the means of the State<br />
Educational Fish Permit program, “educational fisheries” permits with the Alaska<br />
Department of Fish <strong>and</strong> Game to gain access to saltwater salmon. 14 According to the<br />
ADF&G “Policy & Requirements for Fish Resource Permits” (2004), a permit shall expire<br />
no later than December 31 of the year in which it is issued. A fish resource permit authorizes<br />
only the activities specified in the permit. See Section 3.2.5 for further details about the <strong>Knik</strong><br />
Tribal Council <strong>and</strong> Native Village of Eklutna Tribes.<br />
13 Under federal regulation, an area has to be “rural” to qualify for subsistence. <strong>Knik</strong> <strong>Arm</strong> is not “rural” under<br />
federal regulations. Similarly, state regulations do not allow subsistence fishing or hunting in “nonsubsistence<br />
areas.” State “nonsubsistence areas” include the Cook Inlet basin, with exception of communities such as<br />
Tyonek, Nanwalek, <strong>and</strong> Port Graham. There is no official category in Alaska for tribes that became<br />
“engulfed” by urban development <strong>and</strong> growth (KABATA 2004a).<br />
14 The educational fishery may take place in the following locations: 1) in waters of <strong>Knik</strong> <strong>Arm</strong> immediately<br />
adjacent to the village site; 2) in waters of the Northern District between Point MacKenzie <strong>and</strong> the Little<br />
Susitna River <strong>and</strong> adjacent to Fire Isl<strong>and</strong> (no fishing on Mondays or Thursdays during commercial openings);<br />
<strong>and</strong>, 3) in waters within the Fish Creek Terminal Harvest Area, described in 5 AAC 21.364 as those waters<br />
within 1 mile of mean high water on the western shore of <strong>Knik</strong> <strong>Arm</strong> from a regulatory marker on the north<br />
shore of Goose Bay to Fish Creek. The educational fishery shall not take place in the tidal channel of Fish<br />
Creek at any stage of the tide or in Fish Creek (ADF&G 2004).<br />
12/18/07 Page 3-35
<strong>Knik</strong> <strong>Arm</strong> Crossing DraftFinal EIS<br />
<strong>Affected</strong> <strong>Environment</strong><br />
3.2.1.3.3 Government Hill<br />
Government Hill is home for an ethnically <strong>and</strong> economically diverse group of residents,<br />
many of whom work in Downtown Anchorage or on adjacent Elmendorf. The neighborhood<br />
has a minority population percentage greater than the minority population percentage in the<br />
Anchorage general population. One of Anchorage’s pockets of low-rent housing where these<br />
families settled was Government Hill (Blankenship 2002). In particular, the east side of<br />
Government Hill was dominated by high-density affordable housing. For example, North<br />
Pointe Apartments along Richardson Vista Road is the largest apartment complex in Alaska.<br />
The complex consists of 19 buildings, with a total of 406 apartments on 33 acres of l<strong>and</strong>. The<br />
complex is part of the federal low-income housing tax credit program, <strong>and</strong> a percentage of<br />
the apartments are certified low-income units. Located near North Pointe Apartments is<br />
Panoramic View Apartments, a 268-unit apartment building that also offers low cost housing.<br />
As described in Section 3.2.4, based on 2000 U.S. Census data, 53.2 percent of Government<br />
Hill residents are White, 8.7 percent are Alaska Native or American Indian, 7.0 percent are<br />
African American, <strong>and</strong> 12.5 percent are Asian. Individuals of Hispanic origin account for<br />
11.4 percent of the neighborhood’s residents. According to the Census, 46.8 percent of<br />
individuals in Government Hill indicate that they belong to a minority population; that is,<br />
they identified themselves as being all or part Alaska Native or American Indian, Black or<br />
African American, Asian, Hawaiian Native or Pacific Isl<strong>and</strong>er, or Hispanic.<br />
Block-level data from the U.S. Census indicate that the minority population of Government<br />
Hill is concentrated in the east end of the neighborhood (Figure 3.9). The block in which the<br />
North Pointe Apartments is located has a high minority percentage (62 percent) <strong>and</strong> is<br />
densely populated. The exception is the block between Bilbo <strong>and</strong> Erickson Streets, in which<br />
the Sourdough Visitors Lodge is located; 64 percent of this block’s residents belong to a<br />
minority population. However, the number of individuals living on the block is low.<br />
Page 3-36 12/18/07
<strong>Knik</strong> <strong>Arm</strong> Crossing DraftFinal EIS<br />
<strong>Affected</strong> <strong>Environment</strong><br />
Figure 3.9. Block-level percentage non-White population – Government Hill<br />
12/18/07 Page 3-37
<strong>Knik</strong> <strong>Arm</strong> Crossing DraftFinal EIS<br />
<strong>Affected</strong> <strong>Environment</strong><br />
Median income in Government Hill is relatively low—$30,825 in 1999 as compared<br />
with $55,546 for all of Anchorage (Figure 3.9). The low income may be related to the<br />
comparatively low education level of many residents—16.8 percent of residents 25 years of<br />
age or older have not completed high school (as compared with 9.7 percent for all Anchorage<br />
residents). In 1989, the number of Government Hill residents living in poverty was<br />
21.8 percent; by 1999, however, that number had dropped to 9.2 percent, which, while more<br />
than the Anchorage poverty rate of 7.4 percent, is closer to the statewide poverty rate of<br />
9.4 percent. A high percentage of the members of some minority populations in Government<br />
Hill also had incomes below the poverty level in 1999. For example, 100 percent of the<br />
Hispanic children 2 to 11 years old were living in households with incomes below the<br />
poverty level. Just under half of the students enrolled at Government Hill Elementary School<br />
receive free or reduced-priced meals under the National School Lunch/School Breakfast<br />
Program. An estimated 42 percent of the students are economically disadvantaged<br />
(Anchorage School District [ASD] 2005).<br />
In addressing potential environmental justice issues, one needs to consider minority or lowincome<br />
populations who use the affected area as well as those who reside in the affected<br />
area. Government Hill Elementary School, because of the Spanish two-way partial<br />
immersion program the school established in 1996, is attended by many members of<br />
Anchorage’s Hispanic community who reside outside of Government Hill. About half of the<br />
483 students attending Government Hill Elementary School are enrolled in the immersion<br />
program; only about 10 percent of the students enrolled in the program reside in Government<br />
Hill.<br />
3.2.1.3.4 Elmendorf<br />
In 2000, the racial/ethnic composition of the population residing at Elmendorf was similar to<br />
that of the entire Anchorage area. The median household income of Elmendorf residents<br />
($41,161) was lower than that of all Anchorage residents ($55,546), but the proportion of<br />
individuals residing at Elmendorf with incomes below the poverty level (3.5 percent) was<br />
lower than that of all Anchorage residents (7.3 percent).<br />
3.2.2 Transportation, Travel Patterns, Accessibility, <strong>and</strong> Highway <strong>and</strong> Traffic Safety<br />
Anchorage is a regional transportation center for Southcentral Alaska, <strong>and</strong>, as such,<br />
transportation services between Anchorage <strong>and</strong> communities within <strong>and</strong> outside of the region<br />
have an important economic influence on Anchorage. The Study Area’s transportation<br />
system includes road, rail, air, marine, transit, bicycle, <strong>and</strong> pedestrian facilities. The system<br />
has been shaped not only by development <strong>and</strong> settlement patterns, but also by the physical<br />
constraints imposed by Cook Inlet, <strong>Knik</strong> <strong>Arm</strong>, Turnagain <strong>Arm</strong>, mountains, lakes, wetl<strong>and</strong>s,<br />
<strong>and</strong> other topographic <strong>and</strong> environmental features.<br />
As much as natural <strong>and</strong> geographic features have shaped transportation in Anchorage, so<br />
have the federal requirements for transportation planning. On April 8, 1976, the Municipality<br />
of Anchorage became a Metropolitan Planning Organization (MPO) under 23 U.S.C. § 134.<br />
With its status as an MPO, an urban area with a population of more than 50,000 individuals,<br />
Page 3-38 12/18/07
<strong>Knik</strong> <strong>Arm</strong> Crossing DraftFinal EIS<br />
<strong>Affected</strong> <strong>Environment</strong><br />
the Municipality of Anchorage created the Anchorage Metropolitan Area Transportation<br />
Study (now called Anchorage Metropolitan Area Transportation Solutions) (AMATS),<br />
whose responsibility is to carry out transportation planning <strong>and</strong> programming <strong>and</strong> air quality<br />
conformity in Anchorage. AMATS is required, under the Transportation Equity Act for the<br />
21st Century (TEA21), to develop <strong>and</strong> update an LRTP every 3 years <strong>and</strong> a transportation<br />
improvement program (TIP) every 2 years. The LRTP includes major roads, transit,<br />
multimodal, <strong>and</strong> intermodal facilities that operate as an integrated metropolitan transportation<br />
system. The Anchorage LRTP was adopted in December 2005, <strong>and</strong> some of the projects in<br />
the plan are discussed in this section. More information about AMATS can be found in<br />
Section 3.1.<br />
Natural resources <strong>and</strong> geographic features have required integration of the region’s various<br />
transportation modes to meet the transportation needs of businesses <strong>and</strong> residents of<br />
Southcentral Alaska. Because Anchorage is distant from the contiguous 48 states,<br />
transportation to <strong>and</strong> from the Study Area is based as much on water <strong>and</strong> air transportation as<br />
it is on l<strong>and</strong>-based transportation. Within the boundaries of the area for which AMATS is<br />
responsible, transportation planning plays a major role in effecting successful<br />
implementation of a safe, efficient transportation system that can support the future economic<br />
vitality of the metropolitan area; increase accessibility <strong>and</strong> mobility options; protect <strong>and</strong><br />
enhance the environment; <strong>and</strong> enhance the integration <strong>and</strong> connectivity of the transportation<br />
system, across <strong>and</strong> between modes, for both people <strong>and</strong> freight.<br />
Although Anchorage <strong>and</strong> the Mat-Su support transit <strong>and</strong> other transportation modes, the<br />
private automobile is the primary mode for day-to-day transportation. Figure 3.10 shows the<br />
regional transportation system, including rail lines, ports, major airports, <strong>and</strong> the regional<br />
highway network. Marine vessel routes are shown in Figure 3.11.<br />
3.2.2.1 Vehicular travel<br />
Roadways in the Study Area serve local, regional, <strong>and</strong> statewide traffic. The system is made<br />
up of both urban <strong>and</strong> rural roads. Traffic volumes range from very low on local <strong>and</strong> rural<br />
roads to very high on major highways <strong>and</strong> some urban roads. Performance ranges from<br />
excellent to unacceptable, with at-grade intersections generally contributing to the greatest<br />
congestion-related problems.<br />
Roadway <strong>and</strong> intersection performance <strong>and</strong> congestion can be measured 1) by the average<br />
daily traffic (ADT), a measure of the number of vehicles using the facility, which can then be<br />
compared to the lane-miles available to yield a volume-to-capacity ratio (“V/C,” the ratio of<br />
the volume of traffic using a facility in a given time period to the capacity of the facility) or<br />
2) by level of service (LOS). LOS is a term used to qualitatively describe the operating<br />
conditions of a roadway or intersection based on the ratio of traffic volume to the design<br />
capacity of the facility in consideration of a variety of factors such as speed, travel time,<br />
maneuverability, delay, <strong>and</strong> safety.<br />
12/18/07 Page 3-39
<strong>Knik</strong> <strong>Arm</strong> Crossing DraftFinal EIS<br />
<strong>Affected</strong> <strong>Environment</strong><br />
Figure 3.10. Regional transportation facilities in the Study Area<br />
Page 3-40 12/18/07
<strong>Knik</strong> <strong>Arm</strong> Crossing DraftFinal EIS<br />
<strong>Affected</strong> <strong>Environment</strong><br />
Figure 3.11. Anchorage transportation facilities<br />
12/18/07 Page 3-41
<strong>Knik</strong> <strong>Arm</strong> Crossing DraftFinal EIS<br />
<strong>Affected</strong> <strong>Environment</strong><br />
In 2002, 64 percent of all traffic collisions <strong>and</strong> 41 percent of all fatal crashes that occurred<br />
statewide took place in Anchorage, which has about 42 percent of the Alaska’s population<br />
(ADOT&PF 2002a). The percentage of collisions that resulted in fatalities (0.37 percent) was<br />
lower than the statewide percentage (0.58 percent). The Mat-Su, with about 10 percent of the<br />
state’s population, accounted for 14 percent of fatal crashes. The percentage of traffic<br />
collisions that resulted in fatalities decreased from the previous year (0.78 percent in 2002,<br />
1.12 percent in 2001) but remained higher than the statewide average (0.6 percent in 2002,<br />
0.5 percent in 2001) (ADOT&PF 2002a). Motor vehicle accident information in the affected<br />
area is provided in Appendix B of the L<strong>and</strong> Use <strong>and</strong> Transportation Forecasting Technical<br />
Report (KABATA 2006b).<br />
3.2.2.1.1 Mat-Su road system<br />
The Parks <strong>and</strong> Glenn Highways serve as the backbone of the Mat-Su vehicular transportation<br />
system. The Mat-Su road network includes a limited number of other arterial or collector<br />
roads. Generally, the urbanized area is served by paved local roadways <strong>and</strong> short<br />
discontinuous segments of paved collector roads because of the irregular <strong>and</strong> narrow pattern<br />
of urbanization along the Parks <strong>and</strong> Glenn Highways corridors <strong>and</strong> the large number of<br />
interspersed lakes <strong>and</strong> wetl<strong>and</strong>s.<br />
The arterial <strong>and</strong> collector road network in the Mat-Su includes the Glenn Highway, the Parks<br />
Highway, the Palmer-Wasilla Highway, Point MacKenzie Road, <strong>Knik</strong>-Goose Bay Road,<br />
Palmer-Fishhook Road, the Old Glenn Highway, Wasilla-Fishhook Road, <strong>and</strong> Big Lake<br />
Road. The southern portion of the Mat-Su that is within the Study Area for the KAC project<br />
has a limited system of secondary <strong>and</strong> local roads. Mat-Su Borough <strong>and</strong> ADOT&PF are<br />
planning a substantial number of new <strong>and</strong> upgraded collector <strong>and</strong> arterial roads to serve the<br />
rapidly growing area.<br />
During a 4-year period, from 1999 through 2002, vehicular accidents ranged from 1,290 in<br />
1999 to 1,611 in 2001. On average, 68 percent of the accidents involved property damage<br />
only, 26 percent involved minor injuries, 5 percent involved major injuries <strong>and</strong> 1 percent<br />
involved fatalities. The city of Wasilla’s lowest accident numbers were 236 in 1999 <strong>and</strong><br />
396 in 2001. On average, 69 percent of the accidents involved property damage only,<br />
27 percent involved minor injuries, 4 percent involved major injuries, <strong>and</strong> less than<br />
1 percent involved fatalities. Table 55 in the Socioeconomic <strong>Affected</strong> <strong>Environment</strong> Technical<br />
Report (KABATA 2006a) provides more information on accidents in the Mat-Su.<br />
The following sections provide a general description of the major facilities within the Study<br />
Area <strong>and</strong> important planned improvements to the vehicular transportation system. The<br />
roadways described can be seen on Figure 3.10.<br />
Specific facilities<br />
Parks Highway<br />
The Parks Highway is located in the northern portion of the Study Area. A segment of the<br />
National Highway System (NHS), it connects the state’s two largest population centers<br />
(Anchorage/Mat-Su <strong>and</strong> Fairbanks) <strong>and</strong> serves Denali National Park <strong>and</strong> Preserve. The Parks<br />
Page 3-42 12/18/07
<strong>Knik</strong> <strong>Arm</strong> Crossing DraftFinal EIS<br />
<strong>Affected</strong> <strong>Environment</strong><br />
Highway heads west <strong>and</strong> north from the Glenn/Parks Highway Interchange as a four-lane,<br />
paved, limited-access expressway. At Seward Meridian Road it becomes a four-lane<br />
highway, <strong>and</strong> at the west end of the city of Wasilla, the Parks Highway becomes a two-lane<br />
highway <strong>and</strong> continues north through the communities of Houston <strong>and</strong> Willow. The Parks<br />
Highway serves as the major commercial trucking route between Southcentral Alaska <strong>and</strong><br />
Interior Alaska. The spring <strong>and</strong> summer months bring a high volume of recreational vehicles<br />
heading to <strong>and</strong> from Denali National Park <strong>and</strong> Preserve <strong>and</strong> other public l<strong>and</strong>s. The Parks<br />
Highway, along with the Palmer-Wasilla Highway, also serves as the major commercial<br />
corridor within the Mat-Su. The 2004 ADT levels range from 29,200 on the Parks Highway<br />
at <strong>Knik</strong>-Goose Bay Road at the center of the city of Wasilla to 20,000 on the Parks Highway<br />
at the Glenn/Parks Highway Interchange. The high ADT in Wasilla is in large part because of<br />
the traffic dem<strong>and</strong> created by commercial uses lining the Parks Highway near <strong>and</strong> within<br />
Wasilla. The section between Palmer/Wasilla Highway <strong>and</strong> Crusey Street had the highest<br />
ADT, at 33,270, <strong>and</strong> the second highest number of crashes. The highest incidence of<br />
accidents occurred between Church Road <strong>and</strong> Pitman Road, with an ADT of only 16,850<br />
(ADOT&PF 2002a).<br />
Point MacKenzie Road<br />
Point MacKenzie Road is a Mat-Su Borough major collector with paved <strong>and</strong> gravel surfacing<br />
that is designated as part of the Alaska Highway System. The road provides access to Point<br />
MacKenzie from the Parks Highway by way of <strong>Knik</strong>-Goose Bay Road. This road is primarily<br />
used by industrial users of Port MacKenzie, Mat-Su residents living along the road traveling<br />
to <strong>and</strong> from homes <strong>and</strong> work, <strong>and</strong> by recreational users of the Point MacKenzie area.<br />
<strong>Knik</strong>-Goose Bay Road<br />
<strong>Knik</strong>-Goose Bay Road is a two-lane, paved minor arterial with 4-foot shoulders operated <strong>and</strong><br />
maintained by the ADOT&PF as part of the Alaska Highway System. The route provides<br />
connections from the rural areas to the south of the city of Wasilla to the Parks Highway.<br />
Average daily traffic counts on <strong>Knik</strong>-Goose Bay Road range from 5,700 in the sparsely<br />
populated area near Settler’s Bay Drive to 13,300 near the more populated area near the<br />
junction with the Parks Highway (ADOT&PF 2004a).<br />
Burma Road<br />
Burma Road, which connects Big Lake Road <strong>and</strong> Point MacKenzie Road, is a two-lane<br />
gravel facility with very low traffic volumes. Some road segments are subst<strong>and</strong>ard, <strong>and</strong> the<br />
southern segments of the road are little more than a pioneer track. Existing ADT on Burma<br />
Road is less than 500 vehicles (ADOT&PF 2004a).<br />
Big Lake Road<br />
Big Lake Road, which serves the residential <strong>and</strong> vacation home development in the Big Lake<br />
area <strong>and</strong> connects Burma Road to the Parks Highway, is a two-lane paved road with low<br />
traffic volumes. The 2004 ADT is less than about 5,500 at the north end, diminishing to less<br />
than 1,300 at the south end near its connection to Burma Road (ADOT&PF 2004a). Burma-<br />
Big Lake Road is on the Alaska Highway System.<br />
12/18/07 Page 3-43
<strong>Knik</strong> <strong>Arm</strong> Crossing DraftFinal EIS<br />
<strong>Affected</strong> <strong>Environment</strong><br />
Transit service<br />
Established on March 3, 1999, as a private nonprofit corporation, Matanuska-Susitna<br />
Community Transit (MASCOT) operates fixed-route service <strong>and</strong> flexible routes that meet<br />
specific needs (paratransit service) in the Mat-Su Borough. Local <strong>and</strong> commuter fixed-route<br />
service is provided in the Palmer/Wasilla area, with limited commuter service provided from<br />
the Mat-Su to the Anchorage Transit Center. In addition to the fixed-route <strong>and</strong> paratransit<br />
services, MASCOT provides trips to Medicaid clients, transportation to the Boy’s <strong>and</strong> Girl’s<br />
Club, <strong>and</strong> other transportation services for nonprofit agencies. No transit service is provided<br />
in the vicinity of Burma Road or Point MacKenzie.<br />
Mat-Su planned roadway system<br />
Future planned roadway improvements in the Mat-Su portion of the Study Area extend to a<br />
number of improvements to arterial <strong>and</strong> collector-level roads <strong>and</strong> are described in the Mat-Su<br />
Borough’s LRTP. Most of the improvements are in the Wasilla area. Improvements listed in<br />
the KAC project area are:<br />
• upgrading Burma <strong>and</strong> Point MacKenzie Roads, as described earlier<br />
• extending a new road west across Little Susitna River (West Mat-Su Access Road or<br />
Little Susitna Crossing) to access Borough l<strong>and</strong>s as cited in the Matanuska-Susitna<br />
Borough Rail Corridor Study (MSB 2003d).<br />
3.2.2.1.2 Anchorage roadway system<br />
The Anchorage roadway system in the Study Area is a more complete urban roadway<br />
network than the rural network of the Mat-Su side of the affected environment. The road<br />
network LOS, as defined in Section 3.2.2.2, is generally good, with some key transportation<br />
system links in the network performing at fair-to-poor LOS, including portions of the Glenn<br />
Highway <strong>and</strong> Seward Highway. Anchorage has plans to make improvements that would<br />
result in enhancing the performance of these facilities. Based on analysis conducted for the<br />
Anchorage roadway system, intersection LOS appears to be the key determinant of<br />
congestion in Anchorage. Intersections at various critical locations along the Anchorage<br />
transportation network are often the cause of bottlenecks or delays. Many of the congested<br />
intersections are concentrated in the central part of the Anchorage Bowl where major eastwest<br />
<strong>and</strong> north-south arterial street segments are missing or cross each other. Intersection<br />
congestion is generally worse during the evening peak period (4:00 p.m.–6:00 p.m.).<br />
According to the 2005 Anchorage LRTP, traffic crashes increase with more vehicle miles<br />
traveled: “Roads <strong>and</strong> intersections with the highest traffic volumes <strong>and</strong> level of service<br />
(LOS) D, E, or F tend to be locations with the most crashes” (MOA 2005a:36). ADOT&PF<br />
reports that in 2002, three-quarters of all traffic collisions in Alaska occurred on urban roads.<br />
Fatal crashes were nearly equal between urban <strong>and</strong> rural locations. In 2002, Anchorage had<br />
the following percentages of statewide motor vehicle collisions:<br />
all collisions 64.0 involving moose 30.7<br />
fatal collisions 41.0 involving alcohol 62.3<br />
involving pedestrians 70.4 involving speeding 64.9<br />
involving bicyclists 75.8<br />
Page 3-44 12/18/07
<strong>Knik</strong> <strong>Arm</strong> Crossing DraftFinal EIS<br />
<strong>Affected</strong> <strong>Environment</strong><br />
ADOT&PF is compiling comparable data for 2003 <strong>and</strong> 2004 <strong>and</strong> reports that preliminary<br />
findings reveal essentially the same general patterns as recorded in 2002 (Alaska Traffic<br />
Collisions, ADOT&PF, 2002a).<br />
The Anchorage Traffic department produces an annual traffic report that lists the previous<br />
year’s total number of accidents by the top 50 locations (intersections). The Study Team<br />
reviewed 8 years of data, <strong>and</strong> the results as they relate to the Study Area in the specific<br />
facilities are included below (MOA 2004c).<br />
The following sections provide a general description of the major facilities within the Study<br />
Area <strong>and</strong> important planned improvements to the vehicular transportation system. These<br />
facilities can be seen in Figure 3.11.<br />
Specific facilities<br />
Glenn Highway/5th <strong>and</strong> 6th Avenue<br />
From Downtown heading toward Wasilla, the 5th/6th Avenue/Glenn Highway corridor is the<br />
primary vehicular transportation route. The 5th/6th Avenue/Glenn Highway heads northeast<br />
from Downtown Anchorage, carrying commuter traffic to <strong>and</strong> from Eagle River, Eklutna,<br />
<strong>and</strong> the Mat-Su. The route is on the NHS <strong>and</strong> operated <strong>and</strong> maintained by ADOT&PF.<br />
Between Downtown <strong>and</strong> Merrill Field, 5th <strong>and</strong> 6th Avenues operate as a couplet. From there,<br />
the couplet joins <strong>and</strong> operates as a four-lane arterial with a center turn lane (denoted East<br />
5th Avenue). The highway segment starts east of Merrill Field <strong>and</strong> is six lanes to Eagle River<br />
<strong>and</strong> four lanes from Eagle River to the junction with the Parks Highway near Wasilla. From<br />
the Parks Highway interchange, the Glenn Highway continues east to Palmer <strong>and</strong> beyond as<br />
a two-lane paved roadway.<br />
In 2004, ADT on the Glenn Highway east of Muldoon was 50,100 vehicles. On 5th <strong>and</strong><br />
6th Avenues near Gambell Street, ADT was over 22,000. The portion of the corridor near<br />
Merrill Field carries over 47,000 ADT <strong>and</strong> is one of the most congested sections of roadway<br />
in Anchorage during peak periods (because of a current bottleneck condition where the lanes<br />
constrict from six to four, coupled with high commuting volumes from Eagle River <strong>and</strong> the<br />
Mat-Su) (ADOT&PF 2004a).<br />
There were 3,686 auto accidents, involving 5,499 vehicles, with 31 fatalities, 193 major<br />
injuries, <strong>and</strong> 1,658 minor injuries for the 10-year period from 1994 to 2003 on the Glenn<br />
Highway from Bragaw Street in Anchorage to the Palmer-Wasilla Interchange in the Mat-Su.<br />
This does not include accidents at the controlled intersections on either end. This is an<br />
average of one accident per day—resulting in a minor injury once every 2 days, <strong>and</strong> a death<br />
or major injury every 2-3 weeks. The accidents typically result in lane closures. 15<br />
15 Personal communication, Ron Martindale, ADOT&PF, e-mail of highway safety data spreadsheet specific to<br />
Glenn Highway, to John McPherson, 2005.<br />
12/18/07 Page 3-45
<strong>Knik</strong> <strong>Arm</strong> Crossing DraftFinal EIS<br />
<strong>Affected</strong> <strong>Environment</strong><br />
Seward Highway<br />
The Ingra-Gambell/Seward Highway corridor, operated by ADOT&PF, is a major northsouth<br />
route, on the NHS <strong>and</strong> serves the Anchorage Bowl as a continuous north-south<br />
connection down the center of the urbanized area of Anchorage. At its northern end, the<br />
corridor consists of the Ingra-Gambell Couplet. Between 3rd Avenue <strong>and</strong> Midtown, the<br />
corridor operates as a controlled access highway. Traffic volumes are very high. Average<br />
daily traffic on the Seward Highway has been recorded at 54,000 in Midtown<br />
(ADOT&PF 2004a). Most crashes on the Seward Highway take place in at-grade<br />
intersections <strong>and</strong> on the ramps of interchanges between Fireweed Lane <strong>and</strong> De<strong>Arm</strong>oun Road.<br />
The Seward Highway is on the “Top 50 Locations” list from 1997 through 2004<br />
(MOA 2004c). The majority of crashes occur in the urban section between Fireweed Lane<br />
<strong>and</strong> 36th Avenue.<br />
A-C Couplet/Port Access Road<br />
A <strong>and</strong> C Streets form a couplet that functions as a major arterial running north-south from the<br />
southern edge of Government Hill, through Downtown Anchorage <strong>and</strong> Midtown. The<br />
couplet becomes a single roadway (C Street) south of Midtown. A Street is the northbound<br />
roadway <strong>and</strong> C Street is the southbound roadway. Both A <strong>and</strong> C Streets are three-lane roads<br />
south of 3rd Avenue. North of 3rd Avenue, A <strong>and</strong> C Streets join to become a two-way, fourlane<br />
facility that crosses Ship Creek on a viaduct. The A-C Viaduct connects to Loop <strong>and</strong><br />
Ocean Dock Roads at the north end <strong>and</strong> is commonly referred to as the Port Access Road.<br />
Most vehicles <strong>and</strong> trucks originating at or bound for the POA or Government Hill/Elmendorf<br />
area use this access route. Vehicles bound for Ship Creek businesses, the Alaska Railroad, or<br />
Ship Creek Point use either the A-C Viaduct/Port Access Road or E Street. ADT has been<br />
reported at 16,600 on the A-C Viaduct <strong>and</strong> 28,000 between 5th <strong>and</strong> 6th Streets (16,600 on<br />
C Street <strong>and</strong> 11,400 on A Street) (ADOT&PF 2004a). A <strong>and</strong> C Streets are constructed to<br />
accommodate four lanes in each direction. C Street between 5th <strong>and</strong> 6th Avenues has been<br />
consistently on the “Top 50 Locations” list from 1997 through 2004. The highest number of<br />
crashes, 46, occurred at the intersection of C Street <strong>and</strong> 6th Avenue in 2004 (MOA 2004c).<br />
The configuration of the intersection was changed in 2003 at the time of the construction of<br />
the National Parks building. In 2005, the intersection of C Street at 6th Avenue was<br />
improved. Parking was removed along with the dual left turns, <strong>and</strong> the parking lane became a<br />
left turn lane. A <strong>and</strong> C Streets are constructed to eventually accommodate four lanes in each<br />
direction. The 2005 Anchorage LRTP mentions an expansion to four lanes to accommodate<br />
expected growth in traffic dem<strong>and</strong> (MOA 2005a). A-C Streets are operated <strong>and</strong> maintained<br />
by the ADOT&PF <strong>and</strong> are part of the NHS.<br />
Ingra <strong>and</strong> Gambell Streets<br />
Ingra <strong>and</strong> Gambell Streets are one-way major arterials running north (Ingra)-south (Gambell)<br />
from 3rd Avenue to the Seward Highway. They function in a manner similar to A <strong>and</strong><br />
C Streets. Both Ingra <strong>and</strong> Gambell Streets are three-lane roads connecting Seward Highway<br />
to the eastern edge of Downtown Anchorage. They join south of 15th Avenue <strong>and</strong> become<br />
Seward Highway. Ingra <strong>and</strong> Gambell Streets at the intersections of 5th <strong>and</strong> 6th Avenues were<br />
consistently on the “Top 50 Locations” list between 1997 <strong>and</strong> 2004 (MOA 2004c).<br />
Page 3-46 12/18/07
<strong>Knik</strong> <strong>Arm</strong> Crossing DraftFinal EIS<br />
<strong>Affected</strong> <strong>Environment</strong><br />
Ocean Dock <strong>and</strong> Loop Roads<br />
Ocean Dock <strong>and</strong> Loop Roads are minor arterial roadways located north of Downtown<br />
Anchorage. Loop Road runs northeast <strong>and</strong> southwest from the A-C Viaduct to provide access<br />
to Elmendorf <strong>and</strong> the Government Hill neighborhood. Ocean Dock Road connects North<br />
C Street across the Ship Creek area <strong>and</strong> is the main road in <strong>and</strong> out of the POA. Ocean Dock<br />
Road is connected to the A-C Viaduct <strong>and</strong> Loop Road through a series of on- <strong>and</strong> off-ramps.<br />
Ocean Dock Road is on the NHS. Trucks use Ocean Dock <strong>and</strong> Loop Roads for access to the<br />
POA. An ADT of 2,400 has been recorded near the entrance to the POA (ADOT&PF 2004a).<br />
Whitney Road<br />
Whitney Road is a two-lane, east-west collector road located north of Ship Creek. It serves<br />
the Ship Creek industrial area <strong>and</strong> the Alaska Railroad rail yard. Fishermen <strong>and</strong> vehicles<br />
going to the Ship Creek area also use this road, which extends east from North C Street,<br />
under the A-C Viaduct.<br />
3rd Avenue<br />
3rd Avenue is an east-west minor arterial traversing the northern edge of Downtown<br />
Anchorage. West 3rd Avenue is a four-lane roadway between E <strong>and</strong> A Streets <strong>and</strong> a two-lane<br />
roadway west of E Street, with on-street parking <strong>and</strong> sidewalks on both sides. In 2004, ADT<br />
was 7,600 at A Street <strong>and</strong> 11,200 between Gambell <strong>and</strong> Ingra Streets (ADOT&PF 2004a).<br />
Ingra Street at the 3rd Avenue intersection was on the “Top 50 Locations” list only in 2003<br />
<strong>and</strong> 2004 (MOA 2004c).<br />
Erickson Street<br />
Erickson Street is a two-lane municipal collector road that provides access into the western<br />
portion of Government Hill by way of Loop Road. Government Hill is discussed in<br />
Sections 3.2.1, 3.2.3 <strong>and</strong> 3.2.4. Figures 3.3 <strong>and</strong> 3.8 show details of the l<strong>and</strong> uses <strong>and</strong> facilities<br />
along Erickson Street.<br />
Degan Street<br />
Degan Street is a two-lane municipal road with low ADT that serves local neighborhood l<strong>and</strong><br />
uses. Government Hill is discussed in Sections 3.2.1, 3.2.3, <strong>and</strong> 3.2.4. Figures 3.3 <strong>and</strong> 3.8<br />
show details of the l<strong>and</strong> uses <strong>and</strong> facilities along Degan Street.<br />
Transit services<br />
The Anchorage People Mover bus system provides fixed-route service for about threequarters<br />
of the area in the Anchorage Bowl. Ridership on the bus system has remained<br />
relatively stable, although in recent years has increased from about 10,000 to 12,000 riders<br />
per weekday. The People Mover is operated using 55 40-passenger buses on 3 express bus<br />
routes <strong>and</strong> 15 urban fixed routes. Service is provided for approximately 18 hours per<br />
weekday on most routes, with reduced hours on weekends. Other existing transit services<br />
within Anchorage include school district buses <strong>and</strong> the Anchorage-operated AnchorRIDES<br />
system for seniors <strong>and</strong> those with disabilities (MOA 2005a).<br />
12/18/07 Page 3-47
<strong>Knik</strong> <strong>Arm</strong> Crossing DraftFinal EIS<br />
<strong>Affected</strong> <strong>Environment</strong><br />
The People Mover’s Route 14—Government Hill—provides daily service from the Transit<br />
Center in Downtown Anchorage across the A-C Viaduct to Government Hill <strong>and</strong> Elmendorf<br />
(see Figure 3.11). In addition, the Ship Creek Shuttle provides public transportation to the<br />
Ship Creek waterfront area. The shuttle operates on a 30-minute schedule <strong>and</strong> serves various<br />
destinations in the Downtown Anchorage <strong>and</strong> Ship Creek areas.<br />
Anchorage planned roadway system<br />
A number of transportation studies <strong>and</strong> plans have been conducted during the last 10 years to<br />
assess the transportation system in Anchorage, including the 2005 Anchorage LRTP. These<br />
studies have suggested many modifications to improve traffic flow within Anchorage <strong>and</strong> in<br />
the vicinity of the Study Area. Specific issues addressed by the LRTP within the Study Area<br />
include congestion on primary roadways. The following paragraphs describe plans that are<br />
relevant to the KAC project. These plans are included in the transportation system used to<br />
develop transportation models.<br />
• The Whitney/Ocean Dock Road intersection, Downtown Anchorage, A-C Viaduct ramps,<br />
<strong>and</strong> the planned Highway-to-Highway Connection were areas of special system planning<br />
focus of the 2005 Anchorage LRTP.<br />
• The Ingra-Gambell Extension project is a planned project into which the proposed KAC<br />
project would tie. The Ingra-Gambell Extension is a new facility that would extend Ingra<br />
<strong>and</strong> Gambell Streets from 3rd Avenue to Whitney Road to provide circulation <strong>and</strong> access<br />
for freight movement in particular. Refer to the Anchorage LRTP for more information.<br />
• Long-range plans call for a connection of the Glenn Highway to the Seward Highway to<br />
meet travel needs in the corridor (Highway-to-Highway Connection project). Refer to the<br />
Anchorage LRTP for more information.<br />
• The 2003 Anchorage LRTP mentions an expansion of the A-C Viaduct to four lanes to<br />
accommodate expected growth in traffic dem<strong>and</strong>. Refer to the Anchorage LRTP for more<br />
information.<br />
Congestion<br />
For the purposes of this Study for the proposed KAC project, roadway congestion has been<br />
characterized by ADT, as shown on Figure 3.12. Congestion levels are defined on the map<br />
using V/C, the number of vehicle trips per unit time compared with the capacity of each<br />
segment of roadway. Traffic levels for V/Cs are:<br />
• V/C greater than 1.0 = heavy congestion—traffic volume on the roadway is over capacity<br />
• V/C of 0.75–1.0 = traffic flow is approaching capacity, but not over<br />
• V/C of 0.5–0.74 = moderate traffic loads, given the capacity of the road<br />
• V/C of less than 0.5 = low or no congestion<br />
Page 3-48 12/18/07
<strong>Knik</strong> <strong>Arm</strong> Crossing DraftFinal EIS<br />
<strong>Affected</strong> <strong>Environment</strong><br />
3.2.2.2 Marine transportation<br />
Navigation routes in <strong>Knik</strong> <strong>Arm</strong>, as shown in Figure 3.11, connect Cook Inlet to the POA <strong>and</strong><br />
Port MacKenzie. Lower <strong>Knik</strong> <strong>Arm</strong> is considered a major North American shipping channel.<br />
Vessel traffic heading north toward the <strong>Knik</strong> River is primarily composed of recreational<br />
boats, fishing boats, <strong>and</strong> personal watercraft. Although the settlement of <strong>Knik</strong> once served as<br />
the head of navigation in <strong>Knik</strong> <strong>Arm</strong>, there is now little commercial navigation north of Port<br />
MacKenzie apart from some barge traffic in <strong>and</strong> out of Anderson Dock, just north of Port<br />
MacKenzie.<br />
Marine traffic in <strong>Knik</strong> <strong>Arm</strong> consists primarily of ships <strong>and</strong> barges traveling to <strong>and</strong> from the<br />
POA <strong>and</strong> Port MacKenzie. Typically, during a 1-week period, this traffic consists of about<br />
seven vessels (four or five deep-draft container or roll on/roll off (RO/RO) trailer ships, two<br />
barges, <strong>and</strong> one deep-draft fuel barge) <strong>and</strong> tugs assisting the vessels’ travel to <strong>and</strong> from POA<br />
<strong>and</strong> Port MacKenzie. Commercial fishermen <strong>and</strong> recreational boaters use a small public boat<br />
launch ramp located at Ship Creek Point from May–October (weather permitting). The ramp<br />
is closed in the winter. Boats of all types, up to about 40 feet in length, use the launch area.<br />
Because of strong currents <strong>and</strong> cold, turbid waters, recreational boating is not common on<br />
<strong>Knik</strong> <strong>Arm</strong>. Of the estimated 4,515 vessels traveling <strong>Knik</strong> <strong>Arm</strong> annually, 511 are ship <strong>and</strong><br />
barge calls to the POA <strong>and</strong> Port of MacKenzie. For more information, please refer to the<br />
Marine Navigation Technical Report (KABATA 2006i).<br />
All tidal waters are considered navigable by the U.S. <strong>Arm</strong>y Corps of Engineers (USACE).<br />
Navigable waters are defined as waters that have been used in the past, are now used, or are<br />
susceptible to use as a means to transport interstate or foreign commerce up to the head of<br />
navigation (33 C.F.R. § 329). Section 10 of the Rivers <strong>and</strong> Harbors Act of 1899 <strong>and</strong> Clean<br />
Water Act Section 404 permits require approval from USACE prior to any work in, over, or<br />
under navigable waters of the United States, or which would affect the course, location,<br />
condition, or capacity of such waters.<br />
12/18/07 Page 3-49
<strong>Knik</strong> <strong>Arm</strong> Crossing DraftFinal EIS<br />
<strong>Affected</strong> <strong>Environment</strong><br />
Figure 3.12. V/Cs <strong>and</strong> travel volumes – Base Year.<br />
Page 3-50 12/18/07
<strong>Knik</strong> <strong>Arm</strong> Crossing DraftFinal EIS<br />
<strong>Affected</strong> <strong>Environment</strong><br />
3.2.2.2.1 Specific facilities<br />
Port MacKenzie<br />
Existing facilities<br />
As shown in Figures 3.10 <strong>and</strong> 3.11, Port MacKenzie is northwest of Downtown Anchorage<br />
across the <strong>Knik</strong> <strong>Arm</strong> in the southern Mat-Su near Point MacKenzie. The port is being<br />
developed as an intermodal freight facility with road <strong>and</strong> potential rail links to the north. Port<br />
MacKenzie consists of a 500-foot partition dock located 850 feet from shore with 9,000 acres<br />
of adjacent upl<strong>and</strong>s that are available for commercial lease. A filter rock ramp adjacent to the<br />
north wing wall is useable 2 hours before high tide until 2 hours after high tide for vessels<br />
with ramps. This ramp allows heavy port equipment to be driven on <strong>and</strong> off the dock, which<br />
has a gravel surface with a load capacity of 1,000 pounds per square foot. In 2005, a deepdraft<br />
dock was constructed to accommodate Panamax-class ships to facilitate the export of<br />
bulk commodities such as wood chips. A conveyor system was built from the upl<strong>and</strong>s to the<br />
deep water dock as a public-private partnership. It is being used to load wood chips on bulk<br />
carriers <strong>and</strong> is available to move other commodities.<br />
Planned improvements<br />
The Port MacKenzie District has received $6.75 million of federal, state, <strong>and</strong> borough<br />
funding to provide port offices <strong>and</strong> a ferry terminal, with commercial <strong>and</strong> work camp l<strong>and</strong>s.<br />
A master planning effort has been initiated to identify how the port l<strong>and</strong>s should be<br />
subdivided <strong>and</strong> parcels allocated by industry <strong>and</strong> use. Improvements are expected to attract<br />
increased use by cargo vessels. In 2006, POA estimates that the facility would serve eight<br />
Panamax-class cargo ships carrying wood chips <strong>and</strong> up to 100 barges carrying s<strong>and</strong> <strong>and</strong><br />
gravel.<br />
Port of Anchorage<br />
The POA, shown in Figures 3.10 <strong>and</strong> 3.11, is located in Upper Cook Inlet <strong>and</strong> occupies<br />
approximately 129 acres. Immediately south of the POA are other port-related commercial<br />
activities that occur on about 111 acres of l<strong>and</strong> predominantly owned by ARRC in the Ship<br />
Creek industrial area. The POA represents the major gateway for Alaska’s waterborne<br />
commerce <strong>and</strong> plays a vital role in the regional economy.<br />
Vessels can freely navigate up <strong>Knik</strong> <strong>Arm</strong> to dock at the POA. Ships berth at the POA during<br />
high tide, unload <strong>and</strong> load their cargo, <strong>and</strong> then typically sail at high tide. The POA supports<br />
load-on/load-off (LO/LO) container operations <strong>and</strong> roll-on/roll-off (RO/RO) operations in<br />
addition to h<strong>and</strong>ling petroleum products, cement, <strong>and</strong> other bulk carriers. In addition, the<br />
POA receives anywhere from one cruise ship (during the 2006 summer tourist season) to<br />
eight cruise ships (2003) per year. The number <strong>and</strong> frequency of cruise ship calls at the POA<br />
are expected to increase.<br />
The POA’s influence is felt throughout the region. The need for expansion has led to the<br />
development of a Marine Terminal Redevelopment project. When completed, the project<br />
would increase the POA’s capacity, efficiency, <strong>and</strong> security; provide capacity for<br />
transportation of goods through the port to Anchorage <strong>and</strong> Alaska through 2025; <strong>and</strong> allow<br />
12/18/07 Page 3-51
<strong>Knik</strong> <strong>Arm</strong> Crossing DraftFinal EIS<br />
<strong>Affected</strong> <strong>Environment</strong><br />
POA to meet its mission <strong>and</strong> goals. Construction activities for the proposed bridge <strong>and</strong><br />
approach roads would have to be coordinated with construction activities for the POA.<br />
Cook Inlet Ferry<br />
Planned improvements<br />
The Cook Inlet Ferry is a programmed improvement anticipated to be operated by the<br />
Mat-Su Borough or a regional organization starting in 2008. As currently planned, the Cook<br />
Inlet Ferry system will include a terminal building, parking, <strong>and</strong> ferry l<strong>and</strong>ing at Port<br />
MacKenzie <strong>and</strong> parking, a ferry l<strong>and</strong>ing, <strong>and</strong> a small terminal facility in Anchorage. The<br />
Cook Inlet Ferry will be a Small Waterplane Area Twin Hull (SWATH) vessel. The vessel<br />
will have unique loading/unloading capabilities, which will provide greater service<br />
flexibility, shorter loading/unloading times, <strong>and</strong> faster transit times than traditional point-topoint<br />
ferries. The SWATH is slated to have the capacity of 135 passengers <strong>and</strong> 26-28<br />
passenger vehicles/light trucks or four semitrailer trucks. The SWATH is capable of<br />
operating in both “barge” <strong>and</strong> “high-speed” modes. The ferry is expected to complete one<br />
round-trip in an hour <strong>and</strong> make approximately16 round trips a day, although service will<br />
begin with only several trips per day <strong>and</strong> increase as dem<strong>and</strong> builds.<br />
3.2.2.3 Rail transportation<br />
Anchorage <strong>and</strong> the Mat-Su are served by the Alaska Railroad, which provides an important<br />
rail link throughout Southcentral Alaska <strong>and</strong> into Interior Alaska. The Alaska Railroad lines<br />
within the Study Area are shown in Figures 3.10 <strong>and</strong> 3.11.<br />
3.2.2.3.1 The Mat-Su<br />
Existing facilities<br />
No rail line is available in the Point MacKenzie area. The existing rail line parallels the Parks<br />
Highway <strong>and</strong> passes through the cities of Wasilla <strong>and</strong> Houston. Alaska Railroad passenger<br />
services between Anchorage <strong>and</strong> Fairbanks pass through the Mat-Su <strong>and</strong> consist of one<br />
northbound <strong>and</strong> one southbound trip daily in summer, <strong>and</strong> weekly in winter. There are also<br />
special trains that pass through the area, such as trains that carry cruise ship passengers<br />
between Talkeetna <strong>and</strong> Whittier without stopping in Anchorage.<br />
Planned improvements<br />
ARRC is improving the safety <strong>and</strong> efficiency of its operations by upgrading <strong>and</strong> realigning<br />
its track between Anchorage <strong>and</strong> Wasilla. This project would reduce the severity of<br />
approximately 70 sharp curves <strong>and</strong> would decrease running time between Anchorage <strong>and</strong><br />
Wasilla to under an hour.<br />
Mat-Su Borough, in cooperation with ARRC, has completed a feasibility study for extending<br />
rail service to Port MacKenzie. The recommended rail access would extend from Port<br />
MacKenzie north to intersect the Alaska Railroad mainline tracks north of Willow Creek, a<br />
distance of approximately 44 miles. The proposed route lies east of <strong>and</strong> parallel to Point<br />
MacKenzie Road. ARRC <strong>and</strong> Mat-Su Borough have indicated that they do not anticipate the<br />
Page 3-52 12/18/07
<strong>Knik</strong> <strong>Arm</strong> Crossing DraftFinal EIS<br />
<strong>Affected</strong> <strong>Environment</strong><br />
spur line to be operating by 2030.<br />
3.2.2.3.2 Anchorage<br />
Existing facilities<br />
The main ARRC freight yard is located adjacent to Whitney Road in the Ship Creek area,<br />
southeast of the POA (see Figure 3.11). The freight main runs through the area <strong>and</strong> is used by<br />
all freight traffic running between Anchorage <strong>and</strong> points south, <strong>and</strong> for daily switching<br />
operations. A single rail spur leads from the ARRC operations center into the POA. Trains<br />
run through the yard at restricted speeds, between 5 <strong>and</strong> 15 mph. ARRC recently built a new<br />
operations center on Whitney Road <strong>and</strong> has plans for a new car shop. The main passenger<br />
line traverses the southern portion of the Ship Creek valley, serving all passenger trains <strong>and</strong><br />
freight trains bypassing the freight yard. The Alaska Railroad mainline to points north out of<br />
Anchorage roughly parallels the Glenn Highway. The Alaska Railroad also transports<br />
passengers south to Whittier <strong>and</strong> Seward. A new intermodal transportation center (depot) is<br />
planned adjacent to the existing railroad depot. The railroad transports freight, jet fuel,<br />
gravel, coal, <strong>and</strong> other resources. The Alaska Railroad also transports a substantial numbers<br />
of passengers in the summer months through Wasilla to points north.<br />
ARRC’s Anchorage Terminal Reserve, which covers about 600 acres, includes a rail yard<br />
<strong>and</strong> other properties leased to tenants. It is bordered by Cook Inlet to the west, the<br />
Government Hill community <strong>and</strong> Elmendorf Air Force Base to the north, the Mountain View<br />
community to the east, <strong>and</strong> downtown Anchorage to the south. Much of the l<strong>and</strong> including<br />
the rail yard, is near Ship Creek.<br />
The rail yard includes a track system, repair buildings, fueling area, steaming rack,<br />
warehouses, <strong>and</strong> office buildings. In 2005, ARRC completed construction of its Operations<br />
Center in the freight yard area. This state-of-the-art facility serves as the nerve center of the<br />
Alaska Railroad, bringing dispatch, transportation, safety, <strong>and</strong> operations together under one<br />
roof. The track network includes an estimated 170,000 linear feet of track, the most<br />
concentrated of which is north of Ship Creek in the main freight yard area located adjacent to<br />
Whitney Road, southeast of the POA (see Figure 3.11). In addition to the passenger main <strong>and</strong><br />
freight main, which merge at the south end near Elderberry Park, there are more than 60<br />
tracks in the yard <strong>and</strong> surrounding area that are used for loading <strong>and</strong> offloading of freight,<br />
serving customers, switching cars <strong>and</strong> assembling trains. There are more than 15 additional<br />
tracks that serve maintenance <strong>and</strong> operations buildings. Two rail spurs lead from the ARRC<br />
Operations Center into the POA, along with other industrial spur tracks. The freight main is<br />
used by freight trains running between Anchorage <strong>and</strong> points north <strong>and</strong> south transporting<br />
freight, jet fuel, gravel, coal, <strong>and</strong> other resources. Trains run through the yard at restricted<br />
speeds (5 to 15 mph).<br />
The main passenger line traverses the southern portion of the Ship Creek valley <strong>and</strong> serves<br />
all passenger trains <strong>and</strong> fright trains, bypassing the freight yard. The Alaska Railroad<br />
transports a substantial number of passengers in the summer months through Wasilla to<br />
points north, <strong>and</strong> south to Whittier <strong>and</strong> Seward.<br />
12/18/07 Page 3-53
<strong>Knik</strong> <strong>Arm</strong> Crossing DraftFinal EIS<br />
<strong>Affected</strong> <strong>Environment</strong><br />
Planned improvements<br />
ARRC is in the design <strong>and</strong> engineering phase of an Intermodal Transportation Center (ITC)<br />
<strong>and</strong> associated improvements in the Ship Creek area adjacent to the POA. Planned<br />
improvements also include construction of additional tracks in the Ship Creek area <strong>and</strong> a new<br />
car shop in Anchorage. The purpose of the project is to facilitate connections from one<br />
transportation mode to another—rail, public transit, air, marine, bus, taxi, private vehicle,<br />
bicycle, <strong>and</strong> pedestrian—<strong>and</strong> to improve links to the central business district to meet<br />
passenger transit needs over the next 30 years.<br />
3.2.2.4 Air transportation<br />
There are five airports relevant to the Study Area: Sleepers Strip Airport at Point MacKenzie,<br />
Elmendorf, Sixmile Lake, Merrill Field, <strong>and</strong> Ted Stevens Anchorage International Airport.<br />
Airport approaches <strong>and</strong> facilities in the Study Area that must be avoided are shown in<br />
Figure 3.11.<br />
3.2.2.4.1 Sleepers Strip<br />
Sleepers Strip l<strong>and</strong>ing area is located at Point MacKenzie, 46 miles south of the Parks<br />
Highway. Road. Access to the airport is by way of Point MacKenzie Road, which ends at a<br />
gravel four-wheel drive road heading into Sleepers Strip Airport. The airport is at an<br />
elevation of 125 feet. The single gravel runway is 1,600 feet long <strong>and</strong> 60 feet wide. Average<br />
annual flights are 110 aircraft per year, 91 percent of which are air taxis <strong>and</strong> the remainder,<br />
transient general aviation.<br />
3.2.2.4.2 Ted Stevens Anchorage International Airport<br />
By the virtue of Alaska’s geographic position, Ted Stevens Anchorage International Airport<br />
is a national <strong>and</strong> international transfer point for the movement of goods <strong>and</strong> people. In 2004,<br />
Anchorage was the number one cargo airport in the United States in terms of l<strong>and</strong>ed weight,<br />
exceeding the number two facility, which is in Memphis, by over 11 percent <strong>and</strong> all other<br />
U.S. airports by more than 100 percent. The airport is 4 miles southwest of Downtown<br />
Anchorage, at the entrance to <strong>Knik</strong> <strong>Arm</strong>. According to the Federal Aviation Administration<br />
(FAA), as of May 12, 2005, Ted Stevens Anchorage International Airport was<br />
accommodating 793 aircraft per day. The airfield capacity from the current runway<br />
configuration <strong>and</strong> operations is approximately 363,000 annual aircraft operations (995 per<br />
day).<br />
In addition to serving large international <strong>and</strong> domestic aircraft, the airport is also home to the<br />
Lake Hood Seaplane Base, which is the largest <strong>and</strong> busiest seaplane base in the world. It<br />
averages approximately 40,000 aircraft operations per year, with up to 600 aircraft operations<br />
per day in the summer. There are 500 float plane berths at Lake Hood, <strong>and</strong> a waitlist of 230,<br />
which is estimated to be 6 years.<br />
Many aircraft flying from/to the Ted Stevens Anchorage International Airport complex<br />
traverse the area just west of Point MacKenzie. In 1969, the Division of Aviation submitted a<br />
quitclaim deed to the Division of L<strong>and</strong>s to reserve airport l<strong>and</strong>s in this area. Between 1969<br />
<strong>and</strong> 1980, quantities changed <strong>and</strong> quitclaim deeds were resubmitted for approval, but were<br />
Page 3-54 12/18/07
<strong>Knik</strong> <strong>Arm</strong> Crossing DraftFinal EIS<br />
<strong>Affected</strong> <strong>Environment</strong><br />
never approved. In 1980, the Department of Natural Resources wanted to have an<br />
Agriculture L<strong>and</strong> Sale on the same parcels, so the case was closed. Although the aviation<br />
reserve was on plat maps, case ADL 51589 verifies that—although widely believed—an<br />
aviation reserve was never approved <strong>and</strong> does not exist in the Mat-Su.<br />
3.2.2.4.3 Elmendorf<br />
Elmendorf, located a mile north of Downtown Anchorage, is responsible for protecting the<br />
northern U.S. border. Equipped with 75 aircraft, Elmendorf is the largest Alaska Air Force<br />
Base. Elmendorf has two runways, a 10,000-foot-long by 200-foot-wide east-west runway<br />
<strong>and</strong> a 7,500-foot-long by 150-foot north-south runway, designed <strong>and</strong> built for sustained<br />
aircraft l<strong>and</strong>ings <strong>and</strong> takeoffs. The primary runway orientation <strong>and</strong> flight patterns place<br />
aircraft directly over Point MacKenzie <strong>and</strong> approximately perpendicular to <strong>Knik</strong> <strong>Arm</strong> on<br />
their approach to the east-west runway.<br />
3.2.2.4.4 Sixmile Lake<br />
The Sixmile Lake l<strong>and</strong>ing area is located near the shore of <strong>Knik</strong> <strong>Arm</strong> just north of the<br />
Elmendorf runway. The lake is designated for floatplane use. The water operating area is<br />
oriented northwest-southeast <strong>and</strong> is approximately 3,600 feet long by 300 feet wide. There is<br />
a floatplane dock <strong>and</strong> vehicle parking. In addition, there is a 1,600-foot by 50-foot gravel<br />
airstrip. There are approximately 20 float planes <strong>and</strong> 10 wheeled aircraft based at the<br />
facilities. Approaches <strong>and</strong> departures take planes over <strong>Knik</strong> <strong>Arm</strong>, north of the proposed<br />
crossing location.<br />
3.2.2.4.5 Merrill Field<br />
Merrill Field is a municipal general aviation airport located in north Anchorage along<br />
5th Avenue east of Gambell <strong>and</strong> Ingra Streets. Merrill Field has three runways, a north-south<br />
crosswind runway that is 2,640 feet long by 75 feet wide, a primary east-west runway that is<br />
4,000 feet long by 100 feet wide, <strong>and</strong> a 2,000-foot by 60-foot wide gravel runway. With<br />
around 900 based aircraft, Merrill Field is one of the busiest general aviation airports in the<br />
United States, <strong>and</strong> also has a 2,000-foot long by 60-foot wide gravel runway oriented<br />
northeast/southwest. Because of Merrill Field’s location in the complex airspace in the<br />
Anchorage vicinity, the primary routing of flights in <strong>and</strong> out of the Merrill Field takes planes<br />
through an airspace corridor that is just south of the proposed crossing location.<br />
3.2.2.5 Pedestrians <strong>and</strong> bicyclists<br />
3.2.2.5.1 The Mat-Su<br />
The Mat-Su has a large network of recreational trails to support dog sledding, skiing,<br />
skijoring (skiing while pulled by a dog), snowmachining, all-terrain vehicle (ATV) riding,<br />
biking, hiking, canoeing, <strong>and</strong> equestrian riding. These trails include the Iditarod Trail, Nancy<br />
Lake Canoeing Trail, <strong>and</strong> bicycle/pedestrian paths including a paved bike-pedestrian path<br />
that runs from the Parks Highway approximately 9 miles along the <strong>Knik</strong>-Goose Bay Road to<br />
West Carmel Road. A paved path also follows the Big Lake Road for 4 miles, from the Parks<br />
Highway to Hollywood Road, <strong>and</strong> a paved trail runs along the north side of the Parks<br />
Highway from Lucas Road to Willow for a length of approximately 26 miles. Other trails,<br />
12/18/07 Page 3-55
<strong>Knik</strong> <strong>Arm</strong> Crossing DraftFinal EIS<br />
<strong>Affected</strong> <strong>Environment</strong><br />
including ab<strong>and</strong>oned trading routes, old mining routes, <strong>and</strong> logging roads, are now used for<br />
recreation. Figure 3.13 shows trails within the Study Area. The Iditarod Trail, now a National<br />
Historic Trail, started as a mail <strong>and</strong> supply route from the coastal towns of Seward <strong>and</strong> <strong>Knik</strong><br />
to the Interior Alaska mining camps. A portion of the Iditarod Trail from Wasilla to <strong>Knik</strong><br />
enters the Study Area south of Wasilla <strong>and</strong> parallels <strong>Knik</strong>-Goose Bay Road.<br />
3.2.2.5.2 Anchorage<br />
Existing facilities<br />
The Anchorage trail system offers more than 400 miles of trails. The trails offer a<br />
recreational <strong>and</strong> transportation opportunity to all residents. Within the Study Area, the Ship<br />
Creek Trail runs along Ship Creek, through the Alaska Railroad rail yard. The Municipality<br />
of Anchorage began an expansion of the trail through the Ship Creek area in 1999,<br />
constructing a pathway from the CEA Dam to Post Road. Over the intervening years,<br />
construction of the trail has continued in segments, with a tunnel built under Post Road <strong>and</strong><br />
an extension to William Tyson School in Mountain View. At its west end, the trail was<br />
constructed from North C Street, east to a bridge over Ship Creek. Pedestrians <strong>and</strong> bicycles<br />
are accommodated on most local roads in the Anchorage portion of the Study Area <strong>and</strong> on<br />
the A-C Viaduct.<br />
Planned improvements<br />
To avoid an at-grade crossing of the mainline Alaska Railroad track, a concept is being<br />
explored to route the trail on fill across the tidal flats, thereby creating a marsh with elevated<br />
boardwalks for viewing areas.<br />
According to the design study report (Corps of Engineers January 2006), the Port of<br />
Anchorage Marsh Project came out of the ARRC's Ship Creek Development Master Plan,<br />
which included the concept of creating a vegetated marsh area behind an extension of the<br />
Tony Knowles Coastal Trail, along the Anchorage shoreline south of the existing public boat<br />
launch ramp at Ship Creek Point. The trail is currently in the project development process.<br />
The Ship Creek Fishing Access project is part of the Municipality’s “Salmon in the City”<br />
initiative focused on sustaining the fishing experience near downtown Anchorage. Salmon<br />
restoration funds were used to remove the existing culverts <strong>and</strong> channel obstructions <strong>and</strong> to<br />
restore the open channel habitat, improve fish passage in Ship Creek <strong>and</strong> angler safety.<br />
Additional improvements will provide safe public access to this heavily used creek, while<br />
rejuvenating <strong>and</strong> rehabilitating critical stream banks.<br />
Page 3-56 12/18/07
<strong>Knik</strong> <strong>Arm</strong> Crossing DraftFinal EIS<br />
<strong>Affected</strong> <strong>Environment</strong><br />
Figure 3.13. Study Area trails<br />
12/18/07 Page 3-57
<strong>Knik</strong> <strong>Arm</strong> Crossing DraftFinal EIS<br />
<strong>Affected</strong> <strong>Environment</strong><br />
3.2.3 Community Facilities, Public Services, <strong>and</strong> Fiscal Conditions<br />
This section covers the major public facilities <strong>and</strong> services that might be affected by<br />
implementation of the KAC project <strong>and</strong> summarizes the fiscal condition of the local<br />
governments that might be affected by the project.<br />
Neighborhood <strong>and</strong> community cohesion, including environmental justice, is discussed in<br />
Section 3.2.1, <strong>and</strong> population <strong>and</strong> social groups are discussed in Section 3.2.5. The<br />
governments considered in this section include the Municipality of Anchorage; Matanuska-<br />
Susitna Borough; the Cities of Wasilla, Palmer, <strong>and</strong> Houston; <strong>and</strong> the State of Alaska.<br />
3.2.3.1 Provision of community facilities <strong>and</strong> public services<br />
A large number of community facilities <strong>and</strong> public services in the Mat-Su <strong>and</strong> Anchorage are<br />
provided by federal, state, <strong>and</strong> local governments in the affected area. This section focuses on<br />
some of the major facilities <strong>and</strong> services that could experience indirect effects from the<br />
project <strong>and</strong> includes education, emergency services, highway <strong>and</strong> road services, <strong>and</strong> public<br />
utilities, such as water, wastewater treatment, electrical utilities, <strong>and</strong> solid waste disposal.<br />
3.2.3.1.1 Educational services<br />
Educational services include the provision of primary <strong>and</strong> secondary education to area<br />
residents. Two public school districts operate in the affected area—Anchorage School<br />
District (ASD) <strong>and</strong> Matanuska-Susitna Borough School District (MSBSD); each provides<br />
prekindergarten through twelfth-grade education services. The largest single revenue source<br />
to the districts from the State is the Alaska Public School Funding Program. Revenue from<br />
this program is based on the number of students enrolled in the district <strong>and</strong> the type of<br />
educational services delivered. Local property taxes provide the other major revenue source<br />
for the districts.<br />
The Mat-Su<br />
MSBSD has been growing by an average of nearly 450 students a year for the past 5 years—<br />
the equivalent of one new school per year (Komarnitsky 2005). This growth has placed a<br />
significant strain on existing school facilities. No schools are located in the Point MacKenzie<br />
area <strong>and</strong> the anticipated growth area. The nearest elementary schools within the MSBSD are<br />
Big Lake Elementary <strong>and</strong> Goose Bay Elementary. The nearest junior <strong>and</strong> senior high schools<br />
are Houston Junior/Senior High <strong>and</strong> the junior <strong>and</strong> senior high schools in Wasilla<br />
(MSBSD 2005a).<br />
MSBSD manages 20 elementary schools, 5 middle schools <strong>and</strong> 5 high schools,<br />
1 junior/senior high school, 1 K–12 school, <strong>and</strong> 3 charter schools. Schools in Palmer <strong>and</strong><br />
Wasilla had 5,468 <strong>and</strong> 6,677 students in prekindergarten through twelfth grade, respectively,<br />
<strong>and</strong> Houston had 837 middle <strong>and</strong> high school students.<br />
Page 3-58 12/18/07
<strong>Knik</strong> <strong>Arm</strong> Crossing DraftFinal EIS<br />
<strong>Affected</strong> <strong>Environment</strong><br />
Anchorage<br />
ASD manages 58 elementary schools, 9 middle schools, 8 senior high schools, <strong>and</strong> 5 charter<br />
schools (ASD 2005). The District has 4 schools on Elmendorf <strong>and</strong> 2 schools on Fort<br />
Richardson. During the 2003–2004 school year, ASD had an enrollment of 49,722, <strong>and</strong><br />
MSBSD had an enrollment of 14,372.<br />
Government Hill<br />
Government Hill Elementary school had 480 students, <strong>and</strong> schools on Elmendorf had<br />
1,215 students. The location of Government Hill Elementary School is shown in<br />
Figure 3.6 (Section 3.2.1).<br />
Other than Government Hill Elementary, the nearest schools to the Government Hill area are<br />
Aurora <strong>and</strong> Orion Elementary Schools (located on Elmendorf), Denali Elementary<br />
(Montessori) School in Downtown Anchorage, Clark Middle School, <strong>and</strong> West High School.<br />
In the 2003–2004 school year, the elementary schools <strong>and</strong> West High School were under<br />
capacity. Clark Middle School was overcapacity.<br />
No children attending Government Hill Elementary School are bused to school. ASD policy<br />
states that students who live 1.5 miles or less from school must walk or arrange alternative<br />
transportation on their own. Government Hill middle school- children attend Central Middle<br />
School, <strong>and</strong> high school-age children attend West High School. These students are provided<br />
bus transportation or arrange alternative transportation.<br />
3.2.3.1.2 Emergency services<br />
This section describes the provision of police, fire, <strong>and</strong> emergency medical response services<br />
in the Study Area.<br />
The Mat-Su’s Department of Emergency Services began its Enhanced 911 system in 1993—<br />
in cooperation with Houston, Wasilla, <strong>and</strong> Palmer. The Borough now contracts with Palmer<br />
to provide the primary public safety answering point. 16<br />
A central 911-dispatch system serves all of Anchorage <strong>and</strong> coordinates police, fire, <strong>and</strong><br />
emergency medical services responses to all areas of the municipality (MOA 2005d).<br />
Police services<br />
Law enforcement services in the affected area are generally provided by either city/municipal<br />
police departments or the Alaska State Troopers.<br />
16 According to the Palmer Police Department (City of Palmer 2005), the Palmer Police Emergency Dispatch<br />
Center (EDC) is the central dispatch facility for the Mat-Su <strong>and</strong> is staffed by 12 Police/Emergency<br />
Dispatchers <strong>and</strong> 1 Communications Supervisor. The Palmer EDC assists11 fire departments in a fire service<br />
area that covers approximately 625 square miles; 12 ambulance service departments, with 425 volunteers,<br />
covering an area of approximately 25,232 square miles; <strong>and</strong> 3 law enforcement agencies—the Palmer Police<br />
Department, the Wasilla Police Department, <strong>and</strong> back-up for “B” Detachment of the Alaska State Troopers<br />
working the Mat-Su.<br />
12/18/07 Page 3-59
<strong>Knik</strong> <strong>Arm</strong> Crossing DraftFinal EIS<br />
<strong>Affected</strong> <strong>Environment</strong><br />
The Mat-Su<br />
The Palmer Police Department has a Chief of Police <strong>and</strong> 10 sworn officers (City of<br />
Palmer 2005). The Wasilla Police Department has 19 commissioned officers (City of<br />
Wasilla 2005). As a second-class borough, the Mat-Su Borough has the authority to provide<br />
policing services within its boundary. Because it has not exercised this power, the area is,<br />
instead, policed by the Alaska State Troopers.<br />
The Alaska State Troopers consist of approximately 240 commissioned <strong>and</strong> 190 civilian<br />
personnel organized into five Detachments <strong>and</strong> a Criminal Investigation Bureau. The Alaska<br />
State Troopers’ “B” Detachment (Southcentral Alaska) is headquartered in Palmer, <strong>and</strong><br />
“C” Detachment (Western Alaska) is headquartered in Anchorage. The State Troopers<br />
provide police services in the Mat-Su outside of Palmer <strong>and</strong> Wasilla <strong>and</strong> also provide<br />
assistance to Anchorage, Palmer, <strong>and</strong> Wasilla police departments.<br />
Anchorage<br />
The Anchorage Police Department provides law enforcement services in the municipality.<br />
The Anchorage Police Department has about 332 sworn personnel (MOA 2005d). The<br />
Department’s facilities include the headquarters building, 11 substations, <strong>and</strong> a regional<br />
training center. Exp<strong>and</strong>ed police headquarters <strong>and</strong> a Hillside substation are planned within<br />
10 years. By 2020, another substation may be needed in South Anchorage (MOA 2001a).<br />
There is only one full-time police station, which is at 4501 South Bragaw Street (south of the<br />
Tudor <strong>and</strong> Bragaw intersection). A substation is located in the 6th Avenue Parking Garage,<br />
but it is not open 24 hours <strong>and</strong> the facility is very limited.<br />
Fire protection <strong>and</strong> emergency medical response services<br />
The Mat-Su<br />
Fire protection in the Mat-Su is provided by eight fire service areas: Sutton, Butte, Greater<br />
Palmer, Wasilla-Lakes, Meadow Lakes, Big Lake, Willow, <strong>and</strong> Talkeetna. These are funded<br />
through taxes collected from property owners in these respective areas. Palmer <strong>and</strong> Houston<br />
have separate City-operated <strong>and</strong> -funded services. The nearest fire station to the Point<br />
MacKenzie area, Fire Station 64, is on Point MacKenzie Road near its intersection with<br />
Goose Creek Road. The station is approximately 10 miles north of Port MacKenzie (along a<br />
straight line).<br />
The Mat-Su Department of Emergency Services provides borough-wide emergency medical<br />
services through eight divisions of ambulance operations: District #1: Central; District #2:<br />
Big Lake <strong>and</strong> Meadow Lakes; District #3: Palmer; District #4: Talkeetna, Sunshine <strong>and</strong><br />
Trapper Creek; District #5: Willow <strong>and</strong> Houston; District #6: Sutton; District #7: Butte; <strong>and</strong><br />
Valley Transport (MSB 2005 1). The nearest station to Point MacKenzie is Station 61 (the<br />
Lucille <strong>and</strong> Seldon station), approximately 30 miles away. Some emergency medical services<br />
are provided by Fire Station 64, which is closer. The Mat-Su’s FY 2003 budget added<br />
over $925,000 to emergency response services, primarily for ambulance on-call responders<br />
to address the Borough’s increased dem<strong>and</strong> for emergency medical services. There are no<br />
planned expansions. Any expansions will take place as needed to meet dem<strong>and</strong>.<br />
Page 3-60 12/18/07
<strong>Knik</strong> <strong>Arm</strong> Crossing DraftFinal EIS<br />
<strong>Affected</strong> <strong>Environment</strong><br />
Anchorage<br />
The fire service area of the Anchorage Fire Department (AFD) covers the immediate<br />
100 square miles of the Anchorage Bowl. EMS coverage extends throughout the<br />
1,980 square miles of the entire municipality. The AFD Operations Division consists of over<br />
280 personnel covering three rotating 24-hour shifts in 13 fire stations (MOA 2005d). There<br />
are no known expansion plans.<br />
The nearest fire station to Government Hill is Fire Station 1 at 4th Avenue <strong>and</strong> Barrow<br />
Street, in Downtown Anchorage. The station is 1–2 miles away from all areas of Government<br />
Hill. Fire response vehicles use the A-C Couplet, but could wind through the Ship Creek<br />
roads if the primary access were not available. Fire response data are not readily available<br />
from the Anchorage Fire Department. However, a telephone survey conducted in late<br />
spring 2003 indicated that residents in the Government Hill area were very satisfied with the<br />
EMS, based on a sample of 7 respondents (Justice Center 2003).<br />
3.2.3.1.3 Highway <strong>and</strong> road services<br />
This section covers highway <strong>and</strong> road services in the Study Area <strong>and</strong> discusses the entities<br />
responsible for maintaining them.<br />
The Mat-Su<br />
The Mat-Su Department of Public Works maintains over 985 miles of roads within the<br />
borough (MSB 2005e).<br />
Anchorage<br />
Anchorage has several road service districts with different levels of service <strong>and</strong> different tax<br />
rates. The Municipality administers the Anchorage Roads <strong>and</strong> Drainage Service Area<br />
(ARDSA), which covers over two-thirds of the Anchorage Bowl. The ARDSA does not<br />
include the Chugiak-Eagle River area, Girdwood, <strong>and</strong> some areas in South Anchorage. In<br />
general, the State maintains freeways, expressways, most arterials, <strong>and</strong> some collectors,<br />
while the Municipality maintains all remaining public streets. Other roads are in Limited<br />
Road Service Areas or are privately maintained. 17 Streets in Chugiak-Eagle River are<br />
maintained through the Chugiak, Birchwood, Eagle River, Rural Road Service Area<br />
(CBERRRSA). In total, the Anchorage Maintenance & Operations Department, Street<br />
Maintenance Division, maintains over 1,250 lane-miles of roadway (MOA 2005e).<br />
State of Alaska<br />
ADOT&PF owns, maintains <strong>and</strong> operates the NHS, including the Parks, Glenn, <strong>and</strong> Seward<br />
Highways. The state also owns, maintains, <strong>and</strong> operates many arterials <strong>and</strong> some collectors<br />
within the Mat-Su <strong>and</strong> Anchorage.<br />
17 Limited Road Service Areas are service areas established by the Anchorage Assembly under Anchorage<br />
Municipal Code Title 27 to provide limited road maintenance services for rural roads on the Anchorage<br />
Hillside. There are 21 individual services areas serving Hillside.<br />
12/18/07 Page 3-61
<strong>Knik</strong> <strong>Arm</strong> Crossing DraftFinal EIS<br />
<strong>Affected</strong> <strong>Environment</strong><br />
3.2.3.1.4 Public utilities<br />
Public utilities include water, wastewater, electricity, <strong>and</strong> solid waste disposal services. This<br />
section discusses the availability of these services in the Study Area <strong>and</strong> the capacity of the<br />
existing infrastructure.<br />
Water supply<br />
The Mat-Su<br />
In Palmer, water is provided by three deep wells <strong>and</strong> is treated <strong>and</strong> stored in a million-gallon<br />
reservoir (Mat-Su Borough Rural Healthcare Network 2005a). Local schools <strong>and</strong> the Palmer<br />
Correctional Center operate individual well systems. The City is currently undertaking a<br />
water/sewer extension to the Palmer-Wasilla trunk line. In addition to serving a new 75-bed<br />
Matanuska Valley Medical Center with public water <strong>and</strong> sewer, several subdivisions along<br />
the alignment will also be served.<br />
The majority of homes in Wasilla use individual water wells, although the City operates a<br />
piped water <strong>and</strong> sewer system (Mat-Su Borough Rural Healthcare Network 2005b). Water is<br />
provided by a well at Spruce Avenue <strong>and</strong> two wells at Iditarod School, with a 2.3 milliongallon<br />
storage capacity. The public water system serves about 746 customers. Funds have<br />
been requested to develop an additional water source. Wasilla is also undertaking continued<br />
extension of water <strong>and</strong> sewer lines toward the Palmer-Wasilla trunk line. Construction of<br />
utilities along the Palmer-Wasilla Highway extension is intended to encourage development<br />
of the corridor between the Parks Highway <strong>and</strong> <strong>Knik</strong>-Goose Bay Road.<br />
Houston has no public water distribution system. About 60 percent of the city’s residents<br />
have individual wells <strong>and</strong> complete plumbing; other residents haul water (Mat-Su Borough<br />
Rural Healthcare Network 2005c). The school uses its own well water system. In the Port<br />
MacKenzie District there is also no public water distribution system. Most year-round homes<br />
in Point MacKenzie have individual water wells or catchment systems, with complete<br />
plumbing, while others haul water (Mat-Su Borough Rural Healthcare Network 2005d).<br />
Anchorage<br />
The Municipality owns <strong>and</strong> operates the Anchorage Water <strong>and</strong> Wastewater Utility (AWWU),<br />
the largest water utility in Alaska, serving Anchorage, Chugiak-Eagle River, Peters Creek,<br />
Eklutna, <strong>and</strong> Girdwood (MOA 2005e). AWWU collects water from two major surface<br />
watersheds, Eklutna Lake (35 million gallons per day [mgd]) <strong>and</strong> Ship Creek (24 mgd), <strong>and</strong><br />
several deep underground wells (20 mgd). Elmendorf currently supplements the water<br />
produced by its own network of wells with a water transmission main from Fort Richardson<br />
<strong>and</strong> purchased water from AWWU. Government Hill is on the AWWU water system. There<br />
are no wells in the Government Hill area. Although some private wells are still in use in<br />
Anchorage, the nearest active wells are located near the Mountain View area to the east <strong>and</strong><br />
in Midtown to the south (Steckel 2005).<br />
Water is treated <strong>and</strong> piped throughout the municipality through 670 miles of transmission<br />
<strong>and</strong> distribution lines. AWWU has over 52,000 water customer accounts, which equate to an<br />
Page 3-62 12/18/07
<strong>Knik</strong> <strong>Arm</strong> Crossing DraftFinal EIS<br />
<strong>Affected</strong> <strong>Environment</strong><br />
approximate population base of 216,800 residents. It is estimated that the AWWU delivers<br />
water to about 80 percent of the population in the Anchorage Bowl (MOA 2005e).<br />
Treated water production capacity exceeds 80 mgd <strong>and</strong> treated water storage exceeds<br />
67 mgd, while average daily dem<strong>and</strong> is 26 mgd (Anchorage Economic Development<br />
Corporation 2002). Existing capacity is expected to meet dem<strong>and</strong> through 2020<br />
(MOA 2001a). The population threshold past which additional capacity would be needed is<br />
approximately 400,000 persons. 18 If needed, the Eklutna Water Facility could be exp<strong>and</strong>ed to<br />
supply additional water.<br />
Wastewater treatment<br />
The Mat-Su<br />
Palmer owns <strong>and</strong> operates a municipal wastewater treatment plant that began operations<br />
in 1972. The facility’s average design flow is 0.75 mgd <strong>and</strong> is currently discharging at a flow<br />
rate of 0.45 mgd. In 2002, the City received a U.S. Department of Agriculture (USDA) Rural<br />
Development Water <strong>and</strong> Waste Disposal Grant that the Mat-Su Borough will use for sewer<br />
system upgrades.<br />
The majority of homes in Wasilla use individual septic systems, although the City operates a<br />
piped water <strong>and</strong> sewer system (Mat-Su Borough Rural Healthcare Network 2005b). The<br />
public sewer system serves about 523 customers. Wasilla is exp<strong>and</strong>ing its water <strong>and</strong> sewer<br />
system west towards the Wasilla Municipal Airport, <strong>and</strong> east along Bogard Road, the<br />
Palmer-Wasilla Highway, <strong>and</strong> the Parks Highway.<br />
Houston does not have a public wastewater treatment system. About 60 percent of the city’s<br />
residents have septic tanks <strong>and</strong> complete plumbing; other residents use outhouses (Mat-Su<br />
Borough Rural Healthcare Network 2005c).<br />
The Port MacKenzie District does not have a public wastewater collection system. Most<br />
year-round homes in Point MacKenzie have private septic systems, with complete plumbing,<br />
while others use outhouses (Mat-Su Borough Rural Healthcare Network 2005d).<br />
Anchorage<br />
Anchorage’s wastewater treatment system is well-developed <strong>and</strong> available throughout the<br />
municipality. AWWU’s three wastewater facilities serve approximately 52,500 residential,<br />
commercial, <strong>and</strong> military accounts in Anchorage. Wastewater service is provided by<br />
750 miles of pipe, 30 lift/pump stations, <strong>and</strong> three wastewater treatment plants (Anchorage<br />
Economic Development Corporation 2002). The John M. Asplund Wastewater Treatment<br />
Facility, built in 1972, is Alaska’s largest wastewater treatment facility (MOA 2005e). The<br />
facility provides primary treatment of 35 million gallons of wastewater each day. The<br />
capacity is 58 mgd following an upgrade in 1989. Wastewater from Elmendorf <strong>and</strong> Fort<br />
Richardson is discharged to the AWWU sewer system.<br />
18 Personal communication, Kris Warren, with Northern Economics, Inc., September 29, 2005.<br />
12/18/07 Page 3-63
<strong>Knik</strong> <strong>Arm</strong> Crossing DraftFinal EIS<br />
<strong>Affected</strong> <strong>Environment</strong><br />
The collection system <strong>and</strong> treatment plant have adequate capacity through 2020<br />
(MOA 2001a). Future expansion into Southwest Anchorage is planned.<br />
Eagle River <strong>and</strong> Girdwood are served by tertiary treatment facilities. The Eagle River<br />
Wastewater Treatment Plant (ERWTP) was exp<strong>and</strong>ed in 1991 to 2.5 mgd, which was<br />
planned at that time for enough capacity to 2005. Operators of the ERWTP are working with<br />
an engineering group to decide if <strong>and</strong> when expansion would be necessary. The facility is<br />
reaching the high end of mid-capacity, but it still has the capacity to h<strong>and</strong>le some additional<br />
growth (Womak 2005).<br />
Electric utilities<br />
The Mat-Su<br />
The Palmer-based Matanuska Electric Association (MEA) is the second-largest electric<br />
cooperative in Alaska (MEA 2005), serving nearly 50,000 retail customers in the Point<br />
MacKenzie, Eagle River, Chugiak, Palmer, Wasilla, Big Lake, Houston, Willow, Talkeetna,<br />
<strong>and</strong> Trapper Creek areas. It is currently an all-requirements wholesale customer of CEA,<br />
obligated to purchase all its power needs from CEA through the end of 2014. MEA is CEA’s<br />
largest customer, purchasing 25 percent of power sold. Power generation at the Eklutna <strong>and</strong><br />
Bradley Lake hydroelectric facilities is assigned by contract to Chugach to manage on<br />
MEA’s behalf. MEA’s peak load in 2004 was 120 megawatts (MW).<br />
In 2004, MEA gave notice that it would not renew the all-requirements contract with CEA<br />
(MEA 2005). Negotiations between MEA <strong>and</strong> Usibelli Coal Company <strong>and</strong> other firms could<br />
lead to the construction of a gas- or coal-fired generation plant in the Mat-Su as early<br />
as 2015.<br />
Anchorage<br />
In Anchorage, electric power is provided by either Municipal Light & Power (ML&P) or<br />
CEA, depending on location. ML&P is owned by the Municipality <strong>and</strong> provides electrical<br />
power to approximately 30,000 residential <strong>and</strong> commercial customers in a service area of<br />
20 square miles in the northern portion of the municipality (MOA 2003). Within this service<br />
area is Alaska’s commercial, industrial, <strong>and</strong> transportation center as well as more than half<br />
the city’s residential population. It also provides power to Fort Richardson <strong>and</strong> sells<br />
electricity to other utilities for resale outside its service area. ML&P operates two power<br />
plants <strong>and</strong> 20 substations <strong>and</strong> is the south end controller of the Anchorage-Fairbanks Intertie,<br />
a high-voltage transmission line that electrically links the Anchorage area with the Fairbanks<br />
area. ML&P is the majority shareholder (53.3 percent) of the Eklutna power plant, a<br />
hydroelectric facility. In total, ML&P has 350 MW of installed generation capacity<br />
(MOA 2005f). In addition to its own generation, ML&P purchases power from the stateowned<br />
Bradley Lake hydroelectric facility near Homer. Peak dem<strong>and</strong> is 152 MW in winter<br />
<strong>and</strong> 142 MW in summer.<br />
Anchorage-based CEA is a member-owned electric cooperative <strong>and</strong> the largest electric utility<br />
in Alaska. CEA owns 17 power generating facilities in the Cook Inlet area <strong>and</strong> owns a<br />
Page 3-64 12/18/07
<strong>Knik</strong> <strong>Arm</strong> Crossing DraftFinal EIS<br />
<strong>Affected</strong> <strong>Environment</strong><br />
30 percent share of the Eklutna hydroelectric facility (CEA 2005). The cooperative has<br />
527 MW of installed generation capacity. CEA also purchases power from the Bradley Lake<br />
hydroelectric facility.<br />
The combined capacity of ML&P <strong>and</strong> CEA is adequate to meet near-term peak dem<strong>and</strong>s of<br />
Anchorage (MOA 2005f <strong>and</strong> CEA 2005). Additional capacity may be needed by 2015<br />
to 2020.<br />
Solid waste disposal<br />
The Mat-Su<br />
The Mat-Su Borough operates the Central L<strong>and</strong>fill, a Class 1 l<strong>and</strong>fill located between<br />
Wasilla <strong>and</strong> Palmer. The Central L<strong>and</strong>fill serves businesses <strong>and</strong> approximately<br />
55,000 residents of the borough. The area designated for waste disposal is 620 acres in size.<br />
Existing municipal waste l<strong>and</strong>fill cells are expected to reach design capacity around 2010<br />
(ADOT&PF 2002b). Additional l<strong>and</strong>fill cells are planned.<br />
Three privately owned refuse collection companies (Raven Refuse, Valley Refuse, <strong>and</strong><br />
Wasilla Refuse) operate in the Mat-Su’s Core Area. Palmer owns <strong>and</strong> operates a collection<br />
service (ADOT&PF 2002b). These companies provide residential <strong>and</strong> commercial service to<br />
a substantial portion of the borough’s businesses <strong>and</strong> residents.<br />
Anchorage<br />
The Anchorage Regional L<strong>and</strong>fill (ARL) near Eagle River is operated by the Anchorage<br />
Solid Waste Services Department <strong>and</strong> is the deposition point for collected municipal solid<br />
waste within the Anchorage municipal boundaries. The yearly intake rate is about<br />
350,000 tons. The l<strong>and</strong>fill capacity is approximately 42.3 million cubic yards (about<br />
19.8 million tons). The facility is expected to provide for the disposal needs of the<br />
municipality through 2043 (MOA 2001a). The Municipality’s Solid Waste Services provides<br />
waste pickup in the original Anchorage boundaries (before the municipality was formed),<br />
including the Government Hill neighborhood. Other areas are served by privately owned<br />
refuse companies.<br />
Hazardous waste sites<br />
Known <strong>and</strong> potential hazardous waste sites in the Study Area were identified through review<br />
of federal <strong>and</strong> state databases <strong>and</strong> site reconnaissance. The database search included sites<br />
regulated by the Resource Conservation <strong>and</strong> Recovery Act (RCRA) <strong>and</strong> the Comprehensive<br />
<strong>Environment</strong>al Response, Compensation, <strong>and</strong> Liability Act (CERCLA); state-listed spill sites<br />
<strong>and</strong> contaminated sites; <strong>and</strong> sites with leaking underground storage tanks (LUSTs).<br />
Contaminated sites <strong>and</strong> hazardous wastes in the Study Area are discussed in detail in Section<br />
3.5.4.<br />
3.2.3.1.5 Health care services<br />
Health care is provided by a number of hospitals located in the Mat-Su <strong>and</strong> Anchorage:<br />
12/18/07 Page 3-65
<strong>Knik</strong> <strong>Arm</strong> Crossing DraftFinal EIS<br />
<strong>Affected</strong> <strong>Environment</strong><br />
The Mat-Su<br />
Medical care in the Mat-Su is provided primarily by Valley Hospital, which has a hospital in<br />
Palmer, a medical center in Wasilla, <strong>and</strong> a newly opened regional hospital between Palmer<br />
<strong>and</strong> Wasilla near the Parks Highway. Most of the medical care services in the Mat-Su are<br />
located in the Core Area, about 40 miles’ driving distance from Port MacKenzie.<br />
Anchorage<br />
Hospitals that serve the Anchorage area include Providence Alaska Medical Center, Alaska<br />
Native Medical Center, <strong>and</strong> Alaska Regional Hospital for medical care, <strong>and</strong> Alaska<br />
Psychiatric Institute <strong>and</strong> North Star Behavioral Health System for psychiatric care. Numerous<br />
medical clinics, doctor offices, <strong>and</strong> related services are located throughout the municipality.<br />
The hospitals are located east of the Seward Highway. Closest to Government Hill is the<br />
Alaska Regional Hospital, located near the intersection of Airport Heights Drive <strong>and</strong> DeBarr<br />
Road. The driving distance from Government Hill to the hospital is approximately 4–5 miles.<br />
3.2.3.2 Fiscal conditions<br />
This section considers the fiscal conditions of the Study Area’s local government entities that<br />
could be affected by implementation of the proposed project. Entities anticipated to be<br />
affected are the Matanuska-Susitna Borough; the Cities of Palmer, Wasilla, <strong>and</strong> Houston; the<br />
Municipality of Anchorage; <strong>and</strong> the State of Alaska.<br />
The Mat-Su is one of seven, second-class boroughs in the state <strong>and</strong> was incorporated<br />
in 1964. 19 Within the Mat-Su are three incorporated cities, several unincorporated<br />
communities, <strong>and</strong> 25 borough-recognized community councils. Community councils<br />
basically operate without any funding <strong>and</strong> depend on volunteer efforts <strong>and</strong> donations.<br />
Anchorage, with 45 community councils, is the most populous borough in Alaska <strong>and</strong> a<br />
home-rule borough. 20<br />
To a large extent, the Mat-Su is a bedroom community for employees who work in<br />
Anchorage (a substantial portion of the working population in Mat-Su commutes to<br />
Anchorage). Some of the reasons for this commute are that property in Mat-Su has<br />
historically been priced lower than comparable properties in Anchorage, especially in the<br />
Anchorage Bowl, <strong>and</strong> employment opportunities <strong>and</strong> salaries in Anchorage are much greater.<br />
3.2.3.2.1 Mat-Su Borough revenue sources <strong>and</strong> major expenditure categories<br />
The Mat-Su’s fiscal year (FY) 2005 approved budget is based on total revenues of over<br />
$200 million. Funding for education makes up more than 50 percent of the budget. Areawide<br />
general taxation is the largest noneducation revenue source.<br />
19 A second-class borough is similar to a first-class borough in its authority <strong>and</strong> powers, except that it requires<br />
voter approval for the authority to exercise many non-areawide powers.<br />
20 A home-rule municipality adopts a charter subject to voter approval <strong>and</strong> has all powers not prohibited by law<br />
or charter.<br />
Page 3-66 12/18/07
<strong>Knik</strong> <strong>Arm</strong> Crossing DraftFinal EIS<br />
<strong>Affected</strong> <strong>Environment</strong><br />
The Mat-Su’s average property tax rate, based on 27 service areas, is 11.483 mills. The<br />
Borough does not have a sales tax, but it collects a 5 percent tax on accommodations. The<br />
Mat-Su collected $55.5 million in local property taxes in 2004. Additional revenues were<br />
collected from oil <strong>and</strong> gas properties, which make up a small portion of the Borough’s<br />
property base.<br />
L<strong>and</strong> values in the Mat-Su have steadily increased over the last decade, causing property tax<br />
payments to increase. The mill rate has been decreasing, but not enough to offset increasing<br />
real estate values. To provide property owners in the Mat-Su some tax relief, the Mat-Su<br />
Borough Assembly approved a tax cap ordinance in August 2005 that mirrors the Anchorage<br />
tax cap described below. The tax cap does not apply to taxes on new construction or property<br />
improvements made during the current fiscal year; taxes required to fund additional services<br />
m<strong>and</strong>ated by voter-approved ballot issues; special taxes authorized by voter-approved ballot<br />
issues; taxes required to fund the costs of judgments entered against the Borough or to pay<br />
principal or interest on bonds, including revenue bonds; <strong>and</strong> additional taxes collected in<br />
service areas under mill rates specifically approved by service-area residents.<br />
The Borough’s tax cap will go into effect with the 2007 Borough budget, which will be<br />
adopted in May 2006. After a 2-year period, the tax cap can be revoked by the Assembly or<br />
repealed by voter initiative.<br />
Fiscal year 2005 operating expenditures for the Borough are allocated to Borough operations<br />
($45.4 million), enterprise funds ($4.5 million), education operations ($148.9 million), <strong>and</strong><br />
general operations ($7.4 million).<br />
The Borough’s capital improvement budget in FY 2005 consists of about $6.98 million.<br />
Selected budget items include: area-wide road program ($1.2 million), fire service areas<br />
capital projects ($1.1 million), road service area capital projects ($1.8 million), <strong>and</strong> solid<br />
waste capital projects ($450,000).<br />
Port MacKenzie’s FY 2006 budget includes projected revenues of $2.494 million <strong>and</strong><br />
expenditures of $2.493 million (MSB 2005e). As of this writing, the budget for the port is<br />
break-even, but it is anticipated that with port growth, funding will become available for<br />
further port development.<br />
3.2.3.2.2 Palmer revenue sources <strong>and</strong> major expenditure categories<br />
The City of Palmer’s FY 2005 budget is based on total revenues of about $6.4 million. Sales<br />
taxes are responsible for a little more than half ($3.8 million) of the budgeted revenues.<br />
Palmer levies a 2.557 mill tax on properties located inside its boundary. It also charges a<br />
3 percent sales tax. Total property tax revenues for Palmer were $622,879 in 2004. During<br />
the 1998–2004 period, collections grew from $378,000 to nearly $623,000.<br />
Palmer’s expenditures for FY 2005 are $6 million. The Police ($2.5 million) <strong>and</strong> Public<br />
Works Departments ($1.3 million) are the two largest expenditure items, accounting for a<br />
12/18/07 Page 3-67
<strong>Knik</strong> <strong>Arm</strong> Crossing DraftFinal EIS<br />
<strong>Affected</strong> <strong>Environment</strong><br />
little more than half of the FY 2005 operating budget. The Fire Department is budgeted to<br />
receive $477,000.<br />
Palmer’s capital improvement budget for FY 2005 is $9.5 million, with nearly all of this<br />
amount ($8 million) targeted to the water <strong>and</strong> sewer fund. The airport fund <strong>and</strong> Palmer Ice<br />
Arena account for most of the balance of the budget.<br />
3.2.3.2.3 Wasilla revenue sources <strong>and</strong> major expenditure categories<br />
The City of Wasilla’s FY 2005 budget is based on total revenues of about $15 million. Sales<br />
taxes are responsible for more than half ($9.9 million) of the budgeted revenues. The general<br />
fund contributes nearly $10 million to the budget, which represents over half of the total<br />
revenues.<br />
Wasilla levies a 0.4 mill tax on properties located inside its boundary. It also charges a<br />
2.5 percent sales tax. The City’s property tax rate is being adjusted downward to 0.3 mills in<br />
the next budget, with the goal of keeping property taxes at an annual collection of about<br />
$200,000. The City levies a 2 percent sales tax that goes to the General Fund; the additional<br />
0.5 percent was adopted at the start of FY 2003 to fund the Multi-Use Sports Complex. The<br />
0.5 percent tax will sunset after 10 years, on June 30, 2012.<br />
Total property tax revenues for Wasilla were $273,619 in FY 2004. From 1998 to 2004,<br />
collections declined from over $455,000 to under $275,000. The decrease reflects the efforts<br />
of the City to keep property tax rates low while assessed property values have continued to<br />
grow.<br />
Wasilla’s FY 2005 budget shows total operating expenditures of $13.2 million. The budget<br />
has grown steadily over the last 4 years, increasing by a little under $2 million each year.<br />
In FY 2005, Wasilla’s budget allocates over $3.5 million to public safety, followed by<br />
$2.9 million for public works <strong>and</strong> $2.6 million for debt service. The capital improvement<br />
budget shows a beginning fund balance for the Capital Improvement Program (CIP) <strong>and</strong><br />
Enterprise Funds of $3.3 million, revenues of $11.6 million, <strong>and</strong> total available funds of<br />
$14.8 million. Capital outlays of $13.7 million are budgeted, including $7.4 million from the<br />
CIP <strong>and</strong> $6.2 million from the Enterprise Funds.<br />
3.2.3.2.4 Houston revenue sources <strong>and</strong> major expenditure categories<br />
The City of Houston’s FY 2005 budget is based on total revenues of $986,000. A 2.5 mill<br />
roads tax levied on properties is responsible for 28 percent of the revenues, followed by the<br />
sales tax, which accounts for 24 percent.<br />
Houston levies a 2.557 mill tax on properties located inside its boundary. It also charges a<br />
2 percent sales tax that was implemented in 2004. Houston’s property tax revenues for 2004<br />
were $189,000. From 1998 to 2004, total tax collections doubled from $89,500.<br />
Page 3-68 12/18/07
<strong>Knik</strong> <strong>Arm</strong> Crossing DraftFinal EIS<br />
<strong>Affected</strong> <strong>Environment</strong><br />
Houston’s expenditures in FY 2005 are $481,000, up from $325,000 in FY 2004. Gross<br />
wages account for about one-half of the expenditures. Capital budget expenditures are not<br />
available as of this writing.<br />
3.2.3.2.5 Anchorage revenue sources <strong>and</strong> major expenditure categories<br />
Anchorage’s FY 2005 approved budget is based on total revenues of nearly $308 million, of<br />
which $189 million (61.4 percent) is generated from property taxes. About 21.2 percent of<br />
revenues is generated from other local taxes, interest, <strong>and</strong> a category termed “other,” <strong>and</strong><br />
16.7 percent is from local programs. Combined federal <strong>and</strong> state revenues contribute the<br />
remaining 0.7 percent of projected revenues. Revenues to Anchorage from the State have<br />
fallen from $11.8 million in 2002 to less than $2 million in the FY 2004 <strong>and</strong> FY 2005<br />
budgets.<br />
The average property tax rate in Anchorage is 16.37 mills, based on an average of 44 service<br />
areas. There is an 8 percent bed tax, 8 percent car rental tax, a $1.30 tax on cigarette packs,<br />
<strong>and</strong> a 45 percent tax on the wholesale price of other tobacco products. To fund a new<br />
convention center, Anchorage voters recently approved a 4 percent increase in the bed tax,<br />
effective in 2006. Anchorage has no sales tax.<br />
Of the $189 million in total property taxes collected in 2005, just under $180 million came<br />
from the Municipality’s property tax. Property taxes collected from specific areas provide the<br />
other $9 million. There is a cap on property taxes, based on revenues from the preceding<br />
fiscal year plus the average percentage growth or loss in Anchorage population over the<br />
proceeding 5 fiscal years.<br />
Personal services (wages for Anchorage employees) are anticipated to grow 5.8 percent<br />
annually over the next 5 years. This is the largest category of expenditures shown. Set<br />
increases for public safety are anticipated to be $2.5 million per year for 2006 through 2008.<br />
Debt service expenditures are anticipated to increase 2.5 percent annually, <strong>and</strong> other<br />
expenditures are expected to grow 3 percent annually.<br />
The ASD budget for FY 2006 has revenues <strong>and</strong> expenditures at $569,588,806, an increase of<br />
8.29 percent over the prior fiscal year (ASD 2005). The revenues come from local taxes <strong>and</strong><br />
other funds ($200.5 million), the State of Alaska ($300.6 million), <strong>and</strong> the federal<br />
government ($68.4 million). State funding amounts to $4,955 per student, <strong>and</strong> local property<br />
taxes provide $2,938 per student.<br />
The Municipality’s capital improvement budget spending is expected to be just over<br />
$97 million in FY 2005. Capital expenditures for the Anchorage Roads <strong>and</strong> Drainage Service<br />
Area are nearly $60 million. Ongoing projects in the budget are expected to require nearly<br />
$160 million of funding in 2006, followed by declining amounts through 2010.<br />
Project management <strong>and</strong> engineering funding accounts for over 75 percent of the capital<br />
improvement budget, followed by maintenance <strong>and</strong> operations (9 percent), <strong>and</strong> parks <strong>and</strong><br />
recreation, library, <strong>and</strong> museum (5.5 percent).<br />
12/18/07 Page 3-69
<strong>Knik</strong> <strong>Arm</strong> Crossing DraftFinal EIS<br />
<strong>Affected</strong> <strong>Environment</strong><br />
The POA has 528 acres of developed or economically developable upl<strong>and</strong>s <strong>and</strong> 1,000 acres<br />
of tidel<strong>and</strong>s. Its 2004 Operating Budget included revenues of $9.8 million <strong>and</strong> expenses of<br />
$7.9 million.<br />
3.2.3.2.6 State of Alaska<br />
The State of Alaska’s FY 2006 Enacted Budget has projected revenues of $7.119.4 billion.<br />
Total authorized spending is $7.079.6 billion. Education funding is $887.4 million <strong>and</strong> the<br />
Alaska State Troopers are budgeted to receive $85.5 million (State of Alaska 2005).<br />
ARRC had revenues of $116 million in 2004, net income of $15.4 million, <strong>and</strong> an end-ofyear<br />
fund equity of $150 million.<br />
3.2.4 Population <strong>and</strong> Social Groups<br />
This section describes the demographic characteristics of the Study Area, including<br />
population size, ethnicity <strong>and</strong> race, <strong>and</strong> income, as well as the changing social <strong>and</strong> economic<br />
relationships of its communities.<br />
Any disproportionately high <strong>and</strong> adverse effects on minority <strong>and</strong> low-income populations—<br />
environmental justice impacts—are discussed in Section 4.3.6.<br />
3.2.4.1 Population size<br />
In 1975, the City of Anchorage merged with the Greater Anchorage Area Borough to form<br />
the Municipality of Anchorage (Anchorage). Although almost half of Alaska’s residents<br />
reside in Anchorage, only about 10 percent of the municipality’s 1,961 square miles is<br />
inhabited (ISER 2005). The population in 2004 was 277,498 (Figure 3.14).<br />
The Mat-Su is a second class borough 21 incorporated in 1964. It is the third-largest borough<br />
in the state, both physically <strong>and</strong> in terms of population. The borough is about 25,000 square<br />
miles, more than 12 times the size of Anchorage. Approximately 11 percent of that l<strong>and</strong> is in<br />
private (including Native Corporation l<strong>and</strong>) or municipal ownership <strong>and</strong> could be<br />
developed. 22 The Mat-Su is the fastest growing region of the state, largely because of its<br />
proximity to Anchorage. Most of the population resides in the Core Area, around the cities of<br />
Palmer <strong>and</strong> Wasilla, <strong>and</strong> within the three incorporated cities of Houston, Palmer, <strong>and</strong> Wasilla<br />
(MSB 2003a). The estimated population in 2004 was 70,148 (Figure 3.14).<br />
21 All boroughs in Alaska must provide educational services, levy taxes, <strong>and</strong> exercise their l<strong>and</strong> use regulatory<br />
powers. A second-class borough has the option of providing transportation <strong>and</strong> road services, water <strong>and</strong> air<br />
pollution control, solid <strong>and</strong> septic waste regulation, <strong>and</strong> of exercising several other governmental powers.<br />
22 Data were calculated by HDR Alaska, Inc., from Mat-Su Borough geographic information system data.<br />
Page 3-70 12/18/07
<strong>Knik</strong> <strong>Arm</strong> Crossing DraftFinal EIS<br />
<strong>Affected</strong> <strong>Environment</strong><br />
Population<br />
(000s)<br />
400<br />
350<br />
300<br />
Matanuska-<br />
Susitna<br />
Borough<br />
250<br />
200<br />
150<br />
Municipality of<br />
Anchorage<br />
100<br />
50<br />
0<br />
1980 1984 1988 1992 1996 2000 2004<br />
Year<br />
Figure 3.14. Population of Municipality of Anchorage <strong>and</strong> Matanuska-Susitna<br />
Borough – 1980–2004. The Mat-Su share of the regional population has increased<br />
steadily over the past several decades. (Source: U.S. Census Bureau 2005; Alaska<br />
Department of Labor 2005a)<br />
Recent migration data show that Anchorage continues to be the state’s major hub of<br />
migration movement, both within Alaska, <strong>and</strong> to <strong>and</strong> from other states (Williams 2004).<br />
Shifting regional settlement patterns are changing the Anchorage Bowl’s relationship with<br />
outlying areas of the municipality <strong>and</strong> the Mat-Su. Between 1990 <strong>and</strong> 1998, the proportion of<br />
Anchorage residents living in satellite communities in the Chugiak-Eagle River area rose<br />
from about 7 percent to 12 percent. Since 1980, all areas within the Anchorage Bowl have<br />
experienced growth. The rate of growth, however, has been slower in Northeast <strong>and</strong><br />
Northwest Anchorage (MOA 2001a).<br />
In recent years, no other area of Alaska has come close to the Mat-Su’s population growth<br />
rate (Fried 2003). During the 1990s, the movement of people from Anchorage to the Mat-Su<br />
was the largest single net migration flow in Alaska, accounting for about 1,000 persons a<br />
year. By 2004, the Mat-Su was home to 11 percent of Alaska’s population, up from 7 percent<br />
in 1990.<br />
3.2.4.2 Race<br />
Anchorage’s population is only slightly less racially <strong>and</strong> ethnically diverse than the state’s—<br />
70 percent White in 2000 versus 69 percent statewide (Table 3-7). A growing population of<br />
residents of Asian descent is a major contributor to the increased diversity in Anchorage.<br />
12/18/07 Page 3-71
<strong>Knik</strong> <strong>Arm</strong> Crossing DraftFinal EIS<br />
<strong>Affected</strong> <strong>Environment</strong><br />
Table 3-7. Racial/ethnic composition of the Study Area, 2000 <strong>and</strong> 1990 (%)<br />
Race/Ethnic group<br />
White (alone, non-<br />
Hispanic)<br />
Alaska Native or<br />
American Indian<br />
(alone, non-Hispanic)<br />
Black or African<br />
American (alone, non-<br />
Hispanic)<br />
Asian (alone, non-<br />
Hispanic)<br />
Hawaiian Native or<br />
Pacific Isl<strong>and</strong>er (alone,<br />
non-Hispanic)<br />
Anchorage<br />
Total<br />
Anchorage<br />
Government<br />
Hill (Census<br />
Tract 5)<br />
Mat–Su total<br />
Mat–Su Study<br />
Area<br />
Point<br />
MacKenzie<br />
Mat-Su<br />
City of<br />
Palmer<br />
Places<br />
City of<br />
Wasilla<br />
City of<br />
Houston<br />
69.92 53.18 86.27 86.55 91.89 79.31 83.85 82.86<br />
7.04 8.73 5.34 5.17 3.60 7.96 5.05 7.82<br />
5.64 7.03 0.67 0.59 0.90 2.01 0.46 0.33<br />
5.46 12.53 0.68 0.68 1.80 0.99 1.28 0.67<br />
0.90 0.77 0.11 0.11 0 0.26 0.13 0.33<br />
Other race 0.22 0.26 0.27 0.26 0 0.24 0.40 0.58<br />
Two or more races 5.14 6.11 4.16 4.05 1.80 5.71 5.16 5.07<br />
Hispanic origin (any race) 5.69 11.40 2.50 2.59 0 3.51 3.68 2.33<br />
Minority a 30.08 46.82 13.73 13.45 8.11 20.69 16.15 17.14<br />
White, 1990 80.74 58.02 93.11 93.28 93.86 88.59 92.55 95.12<br />
Source: U.S. Census Bureau 2005<br />
Note: All values are for 2000 except for those in the last row<br />
a<br />
Includes all individuals who self-reported as being all or part Alaska Native or American Indian, Black or African<br />
American, Asian, Hawaiian Native or Pacific Isl<strong>and</strong>er, or Hispanic.<br />
In the 2003–2004 school year, 43 percent of the students enrolled in the Anchorage School<br />
District were non-White (Alaska Department of Education <strong>and</strong> Early Development 2005),<br />
suggesting that the minority population will continue to grow in Anchorage. As a result of<br />
the rural-to-urban movement of Alaska’s Native population (Williams 2005), the Mat-Su saw<br />
a substantial increase in its Native population through in-migration from other parts of<br />
Alaska. In 2000, however, the Mat-Su’s population was still 86 percent White. In the 2003–<br />
2004 school year, only 18 percent of the students enrolled in the Mat-Su school district were<br />
non-White (Alaska Department of Education <strong>and</strong> Early Development 2005), suggesting that<br />
the Mat-Su’s population will continue to be predominantly White for a number of years.<br />
Page 3-72 12/18/07
<strong>Knik</strong> <strong>Arm</strong> Crossing DraftFinal EIS<br />
<strong>Affected</strong> <strong>Environment</strong><br />
3.2.4.3 Income characteristics<br />
Since 1969, per capita incomes in Alaska, Anchorage, <strong>and</strong> the Mat-Su were higher than the<br />
U.S. per capita income until the recessionary period experienced by Alaska in the 1980s.<br />
After the recession, per capita income in Anchorage <strong>and</strong> Alaska remained above the<br />
U.S. level, but per capita income in the Mat-Su fell below it (Figure 3.15).<br />
Per capita<br />
income (as<br />
percentage of<br />
U.S. income)<br />
Alaska Anchorage Mat-Su<br />
190<br />
180<br />
170<br />
160<br />
150<br />
140<br />
130<br />
120<br />
110<br />
100<br />
90<br />
80<br />
70<br />
1969 1972 1975 1978 1981 1984 1987 1990 1993 1996 1999 2002<br />
Year<br />
Figure 3.15. Alaskan <strong>and</strong> regional personal per capita incomes as percentages of<br />
U.S. personal per capita income – 1969–2003. Over the past 25 years, personal<br />
income in Anchorage has consistently outpaced national, state, <strong>and</strong> regional incomes.<br />
State <strong>and</strong> regional incomes are no longer substantially above national income levels.<br />
(Source: U.S. Department of Commerce 2005)<br />
12/18/07 Page 3-73
<strong>Knik</strong> <strong>Arm</strong> Crossing DraftFinal EIS<br />
<strong>Affected</strong> <strong>Environment</strong><br />
As shown in Figure 3.16, the distribution of income is similar in Anchorage, the Mat-Su, <strong>and</strong><br />
the state of Alaska, but there are distinctions. Anchorage has a higher percentage of<br />
households in the income categories above $75,000, while the Mat-Su has a greater<br />
proportion of households in the lower income categories, particularly in the less-than-<br />
$25,000 category.<br />
Households<br />
(percentage) Anchorage Mat-Su Alaska<br />
30<br />
25<br />
20<br />
15<br />
10<br />
5<br />
0<br />
Less<br />
than 25<br />
25 to 50 50 to 75 75 to<br />
100<br />
100 to<br />
125<br />
125 to<br />
150<br />
150 to<br />
200<br />
More<br />
than<br />
200<br />
Income level ($000s)<br />
Figure 3.16. Income distribution in Alaska, Anchorage, <strong>and</strong> the Mat-Su – 1999.<br />
(Source: U.S. Census Bureau 2005)<br />
3.2.4.4 Poverty rate<br />
To determine who is considered poor, the U.S. Census Bureau uses a set of money income<br />
thresholds that vary by family size <strong>and</strong> composition. Poverty thresholds do not vary<br />
geographically, but are updated annually for inflation using the consumer price index.<br />
The percentage of people living below the poverty level increased in Anchorage <strong>and</strong> the<br />
Mat-Su between 1989 <strong>and</strong> 1999 (Table 3-8). However, certain areas, such as Government<br />
Hill, showed a substantial decrease. This decrease coincides with the demolition of the<br />
Hollywood Vista Apartments in 1996, which displaced 360 households from this highdensity<br />
housing complex.<br />
Page 3-74 12/18/07
<strong>Knik</strong> <strong>Arm</strong> Crossing DraftFinal EIS<br />
<strong>Affected</strong> <strong>Environment</strong><br />
Table 3-8. Percentage of individuals below the<br />
poverty level in the Study Area, 1999 <strong>and</strong> 1989<br />
Area 1999 1989<br />
Municipality of Anchorage 7.35 7.07<br />
Government Hill 9.16 21.84<br />
Matanuska-Susitna Borough 11.01 9.39<br />
Mat-Su Study Area 10.43 8.43<br />
Point MacKenzie 22.67 34.09<br />
City of Palmer 12.66 6.21<br />
City of Wasilla 9.59 10.85<br />
City of Houston 17.09 9.78<br />
Source: U.S. Census Bureau 2005<br />
3.2.4.5 Educational attainment<br />
Educational attainment is one indicator of the human resources available in a community <strong>and</strong><br />
the level of labor force preparation. In general, income increases with advancing educational<br />
attainment. In 2000, just over 90 percent of Anchorage residents 25 years <strong>and</strong> older were<br />
high school graduates or higher, placing Anchorage among the top metropolitan areas in the<br />
nation in educational attainment. Educational levels at the bachelor’s degree level are lower<br />
in the Mat-Su than in Anchorage (18.3 percent compared with 28.9 percent) <strong>and</strong> have not<br />
changed significantly since 1990. Over 88 percent of residents, however, had earned a high<br />
school degree or higher degree. In Anchorage <strong>and</strong> the Mat-Su, approximately 3 percent of the<br />
population had less than a ninth-grade education.<br />
3.2.5 Subsistence<br />
Prior to the arrival of the first Europeans in the Upper Cook Inlet area in the late 1700s, the<br />
indigenous Dena’ina resided in fish camps <strong>and</strong> winter villages along both shores of the <strong>Knik</strong><br />
<strong>Arm</strong>. The Dena’ina harvested local resources from the l<strong>and</strong>s <strong>and</strong> waters within the Upper<br />
Cook Inlet basin. With the development of Anchorage since its inception in 1915 <strong>and</strong><br />
population growth within the region, the Dena’ina have been displaced from traditional<br />
camps <strong>and</strong> harvest locations. Historic subsistence <strong>and</strong> cultural sites along <strong>Knik</strong> <strong>Arm</strong>, known<br />
to date are described in Section 3.6. Although some Dena’ina moved further from the<br />
Anchorage area (Tyonek <strong>and</strong> the Kenai Peninsula) in response to ongoing development,<br />
descendents of the Upper Inlet Dena’ina now live in Eklutna, <strong>Knik</strong>, Chickaloon, Anchorage,<br />
<strong>and</strong> portions of the Mat-Su. Cultural attachments to traditional <strong>and</strong> historic places <strong>and</strong><br />
activities endure, <strong>and</strong> the Dena’ina continue to harvest local resources as they have for<br />
centuries (KABATA 2004a).<br />
3.2.5.1 Subsistence as defined under state <strong>and</strong> federal law<br />
The Alaska National Interest L<strong>and</strong>s Conservation Act of 1980 (ANILCA) requires that<br />
subsistence hunting <strong>and</strong> gathering be addressed for all projects on federal l<strong>and</strong>s in Alaska.<br />
Subsistence is defined in ANILCA, Section 803, as “the customary <strong>and</strong> traditional uses by<br />
rural Alaska residents of wild, renewable resources” for noncommercial purposes. Hunting,<br />
fishing, trapping, <strong>and</strong> gathering natural resources are major elements of the cultural <strong>and</strong><br />
economic life of many Anchorage <strong>and</strong> Mat-Su-area residents. However, federal law regulates<br />
12/18/07 Page 3-75
<strong>Knik</strong> <strong>Arm</strong> Crossing DraftFinal EIS<br />
<strong>Affected</strong> <strong>Environment</strong><br />
subsistence on federal l<strong>and</strong>, state law regulates subsistence on state l<strong>and</strong>, <strong>and</strong> the regulations<br />
differ. Federal law defines rural <strong>and</strong> nonrural areas, <strong>and</strong> a person must be a rural Alaska<br />
resident to participate in subsistence on federally owned l<strong>and</strong>s under federal subsistence<br />
regulations. Under State law, however, all Alaska residents are eligible to participate in<br />
subsistence on State-owned l<strong>and</strong>s, but only in State-defined subsistence use areas.<br />
The <strong>Knik</strong> <strong>Arm</strong> Dena’ina do not qualify as subsistence users under state <strong>and</strong> federal<br />
regulations because the greater Anchorage–Mat-Su Valley “urban” region encompasses their<br />
traditional l<strong>and</strong>s <strong>and</strong> harvest areas, <strong>and</strong> current federal <strong>and</strong> State regulations do not recognize<br />
subsistence activities in <strong>Knik</strong> <strong>Arm</strong>. Under federal subsistence regulations established under<br />
ANILCA Title VIII, federal l<strong>and</strong>s have to be classified as “rural,” <strong>and</strong> <strong>Knik</strong> <strong>Arm</strong> is not<br />
considered rural. Similarly, state regulations (AS § § 16.05.258 <strong>and</strong> 16.05.940) do not allow<br />
for subsistence in nonrural or nonsubsistence areas. The Cook Inlet basin is considered<br />
nonrural, with the exception of designated subsistence areas for Tyonek, Nanwalek, <strong>and</strong> Port<br />
Graham, which are outside of the Study Area (KABATA 2004a).<br />
3.2.5.2 Contemporary harvest patterns of the Cook Inlet Dena’ina<br />
Although there is no state- or federally-recognized subsistence in the immediate Study Area,<br />
the Cook Inlet Dena’ina harvest local resources, <strong>and</strong> depend on them both economically <strong>and</strong><br />
culturally. Three major categories of fish <strong>and</strong> wildlife are found in the Study Area: salmon,<br />
moose, <strong>and</strong> beluga whale. Historically, salmon, moose <strong>and</strong> beluga whale have been harvested<br />
by the Dena’ina Athabascan. Information on harvest levels of fish <strong>and</strong> wildlife for the Upper<br />
Inlet Dena’ina communities is both limited <strong>and</strong> dated. While some traditional harvest<br />
information is available for Tyonek <strong>and</strong> Chickaloon, information is not available for the<br />
traditional harvest by <strong>Knik</strong> <strong>and</strong> Eklutna. Subsistence harvest information for the Dena’ina<br />
community of Chickaloon in 1982 indicates that over 50 percent of the total harvest—as well<br />
as the per capita harvest was moose <strong>and</strong> caribou, with salmon making up the next largest<br />
category, at 20 percent of the total harvest (ADF&G 2001). These figures provide an estimate<br />
of the tribal reliance on these fish <strong>and</strong> wildlife resources.<br />
3.2.5.2.1 Salmon<br />
Under AS 05 Alaska Administrative Code (AAC) 93.200, both the <strong>Knik</strong> Tribal Council <strong>and</strong><br />
Native Village of Eklutna Tribes are allowed to harvest salmon for personal consumption<br />
under educational fishery programs. The <strong>Knik</strong> Tribal Council uses an educational fishery site<br />
on the west side of <strong>Knik</strong> <strong>Arm</strong> near Fish Creek. The Native Village of Eklutna uses a site on<br />
the east side of Upper Cook Inlet. Reported harvest levels for the educational fisheries are<br />
500 salmon for the <strong>Knik</strong> Tribal Council (ADF&G Permit SF 2005-101) <strong>and</strong> 1,000 salmon for<br />
the Native Village of Eklutna (ADF&G Permit SF 2005-133).<br />
3.2.5.2.2 Moose<br />
Moose are harvested by tribal members under sport hunting regulations. Moose hunting<br />
occurs primarily during the fall season in the general Study Area (KABATA 2004a).<br />
Page 3-76 12/18/07
<strong>Knik</strong> <strong>Arm</strong> Crossing DraftFinal EIS<br />
<strong>Affected</strong> <strong>Environment</strong><br />
3.2.5.2.3 Beluga whale<br />
An agreement to co-manage the 2005 harvest of the Cook Inlet stock of beluga whales has<br />
been negotiated with the Cook Inlet Marine Mammal Commission (CIMMC) <strong>and</strong> is in the<br />
National Oceanic Atmospheric Administration (NOAA) clearance process. CIMMC operates<br />
under tribal resolution from eight tribal village governments or traditional councils in the<br />
Cook Inlet region. The agreement describes specific harvest practices that must be followed<br />
as conditions of the harvest permit (NMFS <strong>and</strong> CIMMC 2005). From 2005 to 2009, the<br />
annual strike 23 limitations are operating as an interim planning period <strong>and</strong> are set as follows:<br />
two strikes are allocated for 2005, one strike for 2006, two strikes for 2007, one strike<br />
for 2008, <strong>and</strong> two strikes for 2009. Beginning in 2010, harvest levels will be derived from<br />
abundance estimates averaged over the previous 5 years (NOAA 2004).<br />
3.2.6 Utilities<br />
This section provides general descriptions <strong>and</strong> locations of the utility systems in the Study<br />
Area.<br />
3.2.6.1 Water<br />
3.2.6.1.1 The Mat-Su<br />
No public water distribution system is located within the Study Area on the Mat-Su side of<br />
<strong>Knik</strong> <strong>Arm</strong> because of the low development density of the area. Property owners are<br />
responsible for their own water systems, which are primarily private wells.<br />
3.2.6.1.2 Southern Alignment<br />
No water utilities exist in the vicinity of the proposed Southern Alignment. The proposed<br />
Below-the-Bluff Roadway is located along the western perimeter of Elmendorf <strong>and</strong> along the<br />
eastern perimeter of the POA. Elmendorf supplements the water produced by its own<br />
network of wells with a water transmission main from Fort Richardson <strong>and</strong> purchased water<br />
from AWWU. The POA relies on water from AWWU, <strong>and</strong> is served by a 12-inch line that<br />
crosses Loop Road.<br />
3.2.6.1.3 Anchorage<br />
AWWU operates the public water supply, treatment, <strong>and</strong> distribution system, which supplies<br />
water at an average rate of approximately 25 mgd to 52,000 residential, commercial, <strong>and</strong><br />
military customers, including those in the Study Area. Figure 3.17 shows the current water<br />
distribution piping in the vicinity of the proposed KAC project’s Anchorage approach<br />
alternatives.<br />
23 A strike is defined as hitting a whale with a harpoon, lance, bullet, or other object.<br />
12/18/07 Page 3-77
<strong>Knik</strong> <strong>Arm</strong> Crossing DraftFinal EIS<br />
<strong>Affected</strong> <strong>Environment</strong><br />
Figure 3.17. Water utilities<br />
Page 3-78 12/18/07
<strong>Knik</strong> <strong>Arm</strong> Crossing DraftFinal EIS<br />
<strong>Affected</strong> <strong>Environment</strong><br />
3.2.6.2 Sewer<br />
3.2.6.2.1 The Mat-Su<br />
Because of the low development density in the Study Area on the Mat-Su side of <strong>Knik</strong> <strong>Arm</strong>,<br />
there are no public sewer systems or wastewater treatment facilities. Property owners<br />
typically rely on private septic tank <strong>and</strong> leach field systems to treat <strong>and</strong> discharge<br />
wastewater.<br />
3.2.6.2.2 Southern Alignment, including the Below-the-Bluff Roadway<br />
There are no sewer utilities in the vicinity of the proposed Southern Alignment. Elmendorf<br />
maintains its own sewer system, but contracts with AWWU for conveyance <strong>and</strong> treatment.<br />
All wastewater from Elmendorf enters the AWWU sewer system at a metering station near<br />
the intersection of Arctic Warrior <strong>and</strong> West Bluff Drives in the Government Hill area.<br />
AWWU also provides sewer service to the POA.<br />
3.2.6.2.3 Anchorage<br />
AWWU operates a public sewer system <strong>and</strong> three wastewater treatment plants, which collect<br />
<strong>and</strong> treat an average flow of 25 mgd from 52,500 customers. Figure 3.18 shows those sewer<br />
utilities near the proposed Anchorage approach alternatives.<br />
3.2.6.3 Gas <strong>and</strong> fuel lines<br />
3.2.6.3.1 The Mat-Su<br />
ENSTAR Natural Gas Company (ENSTAR) is the primary gas service provider to the<br />
Mat-Su. ENSTAR transports gas east through a 20-inch pipeline from the Beluga gas fields,<br />
across the Mat-Su, <strong>and</strong> then around <strong>Knik</strong> <strong>Arm</strong> to Anchorage (Figure 3.19). Service networks<br />
branch off from this pipeline at numerous locations along its length. The southernmost gas<br />
service on the Mat-Su side of <strong>Knik</strong> <strong>Arm</strong> is at the Goose Bay Correctional Facility,<br />
approximately 7 miles north of the proposed KAC project. While discussions have taken<br />
place between Mat-Su Borough planners <strong>and</strong> ENSTAR regarding extending service<br />
southward to meet the needs of future development, no decision has yet been made to<br />
proceed.<br />
3.2.6.3.2 Anchorage<br />
ENSTAR is the primary gas service provider to Anchorage <strong>and</strong> Elmendorf. ENSTAR gas<br />
service in Anchorage is well-developed, with an extensive piping network as shown in<br />
Figure 3.20.<br />
The POA lies directly adjacent to the proposed Below-the-Bluff Roadway portion of the<br />
Southern Alignment. Fuel lines extend from the tank farm at the POA toward the proposed<br />
roadway (Figure 3.19).<br />
12/18/07 Page 3-79
<strong>Knik</strong> <strong>Arm</strong> Crossing DraftFinal EIS<br />
<strong>Affected</strong> <strong>Environment</strong><br />
Figure 3.18. Wastewater utilities<br />
Page 3-80 12/18/07
<strong>Knik</strong> <strong>Arm</strong> Crossing DraftFinal EIS<br />
<strong>Affected</strong> <strong>Environment</strong><br />
Figure 3.19. Gas <strong>and</strong> electric utilities – the Mat-Su<br />
12/18/07 Page 3-81
<strong>Knik</strong> <strong>Arm</strong> Crossing DraftFinal EIS<br />
<strong>Affected</strong> <strong>Environment</strong><br />
Figure 3.20. Fuel lines <strong>and</strong> natural gas utilities – Anchorage<br />
Page 3-82 12/18/07
<strong>Knik</strong> <strong>Arm</strong> Crossing DraftFinal EIS<br />
<strong>Affected</strong> <strong>Environment</strong><br />
3.2.6.4 Electricity<br />
3.2.6.4.1 The Mat-Su<br />
Chugach Electric Association can transmit up to 300 MW from the Beluga power plant to<br />
Point MacKenzie. CEA owns transmission lines extending from Point MacKenzie north to a<br />
substation known as West Terminal Substation, which is located approximately 1 mile north<br />
of Port MacKenzie. CEA also owns transmission lines extending from Point MacKenzie<br />
north to a substation near Settlers Bay. CEA transmits electricity across <strong>Knik</strong> <strong>Arm</strong> using<br />
submarine cables from Point MacKenzie to Point Woronzof in Anchorage <strong>and</strong> from West<br />
Terminal Substation to East Terminal Substation located near Sixmile Lake. Although CEA<br />
owns all of the transmission lines south of Settlers Bay in the Mat-Su, it sells the energy from<br />
these lines to MEA. Refer to Figure 3.19 for a map showing all of CEA’s electrical utilities<br />
within the Mat-Su portion of the Study Area. CEA’s primary service area is roughly the<br />
portion of Anchorage lying south of Tudor Road.<br />
MEA is the primary electric service provider in the Mat-Su, including the Study Area, north<br />
as far as Talkeetna, east to the Matanuska Glacier, <strong>and</strong> south as far as Eagle River. As<br />
indicated above, MEA purchases some of its power from CEA.<br />
3.2.6.4.2 Anchorage<br />
Anchorage Municipal Light <strong>and</strong> Power Company (ML&P) provides electricity for the<br />
northern portion of Anchorage <strong>and</strong> Elmendorf. Figure 3.21 shows ML&P’s electrical utilities<br />
located in the vicinity of the proposed Anchorage approach alternatives.<br />
3.2.6.5 Communications<br />
GCI, Matanuska Telephone Association (MTA), Alaska Communications Systems (ACS),<br />
<strong>and</strong> AT&T Alascom are the major providers of voice, video, <strong>and</strong> data communication<br />
services in the Mat-Su <strong>and</strong> Anchorage. MTA is currently the primary communications<br />
provider for the Mat-Su with its microwave connections from Eagle River to Point<br />
MacKenzie <strong>and</strong> to Port MacKenzie.<br />
3.2.7 Relocation<br />
As a means of providing uniform <strong>and</strong> equitable treatment for those persons displaced by<br />
federal or federal aid projects, the federal government passed the Uniform Relocation<br />
Assistance <strong>and</strong> Real Property Acquisitions Policies Act of 1970 (Uniform Act). This<br />
legislation provides for uniform <strong>and</strong> equitable treatment of persons displaced from their<br />
homes, businesses, or farms by federal <strong>and</strong> federally assisted programs, <strong>and</strong> establishes<br />
uniform <strong>and</strong> equitable l<strong>and</strong> acquisition policies for federal <strong>and</strong> federally assisted programs.<br />
Whenever the acquisition of real property for a program or project using federal monies<br />
displaces anyone, the acquiring agency is required to reimburse the displaced persons<br />
(residential, commercial, <strong>and</strong> nonprofit) for moving <strong>and</strong> increased housing costs <strong>and</strong> to<br />
provide relocation planning assistance <strong>and</strong> advisory services.<br />
12/18/07 Page 3-83
<strong>Knik</strong> <strong>Arm</strong> Crossing DraftFinal EIS<br />
<strong>Affected</strong> <strong>Environment</strong><br />
Figure 3.21. Electrical utilities – Anchorage<br />
Page 3-84 12/18/07
<strong>Knik</strong> <strong>Arm</strong> Crossing DraftFinal EIS<br />
<strong>Affected</strong> <strong>Environment</strong><br />
Residents displaced by a federal program are generally relocated to existing housing in the<br />
community, although present market conditions may require relocation outside the<br />
community of present residence. Further, people asked to move because of transportation<br />
projects frequently choose to relocate into housing circumstances substantially different than<br />
their present housing. 24 Changes typically made are different communities, different housing<br />
styles <strong>and</strong> sizes, <strong>and</strong> different occupancy status between owner <strong>and</strong> renter. Businesses are<br />
generally relocated to similar business settings <strong>and</strong> in accordance with the Uniform Act.<br />
Homes <strong>and</strong> businesses affected by the project are discussed below <strong>and</strong> in Section 4.2.7.<br />
Although minimal disruption would take place in the Mat–Su community with<br />
implementation of the proposed Mat-Su approach alternatives, each of the proposed<br />
Anchorage approach alternatives would affect improved property. Vacant housing <strong>and</strong><br />
business sites are generally available in Anchorage, if relocation would be required.<br />
3.2.7.1 The Mat–Su<br />
Up to 30 parcels exist along each of the proposed Mat-Su approach alternatives. No homes or<br />
businesses in the Mat–Su portion of the Study Area would be anticipated to be affected by<br />
the proposed KAC project.<br />
3.2.7.2 Southern Alignment<br />
The proposed Southern Alignment would require acquisition of controlled-access right-ofway;<br />
however, it is not anticipated that any homes or businesses would be affected by<br />
implementation of the proposed KAC project.<br />
3.2.7.3 Anchorage<br />
In the Anchorage portion of the Study Area, Phase 1of the proposed KAC project would<br />
traverse the Government Hill neighborhood along Degan Street or Erickson Street, as<br />
described in Section 2.0. While implementation of the tunnel design would minimize<br />
permanent displacements, proposed KAC project staging areas, construction techniques, <strong>and</strong><br />
final tunnel design would affect the number of relocations <strong>and</strong> construction impacts. Phase 2<br />
of the proposed project would traverse parcels in the rail yard industrial area as well as<br />
parcels owned by the Municipality of Anchorage.<br />
3.2.7.4 Characteristics of affected community<br />
Family <strong>and</strong> other characteristics of the community affected in Anchorage, as identified in<br />
the 2000 U.S. Census data Block Group 1, Census Tract 5, show a neighborhood<br />
approximately evenly split between homeowners <strong>and</strong> renters, with over 90 percent of the<br />
households being four-person or smaller in size. The racial makeup of the population is<br />
estimated to be 72.6 percent White, 6.6 percent self-identified as Black or African American,<br />
24 Personal communication, various persons displaced by highway projects, in interviews conducted by Glenn<br />
<strong>Bridge</strong>r, retired Field Services Reality Specialist for FHWA Office of Real Estate, Washington, D.C.;<br />
personal follow-up interviews conducted over a 38-year career.<br />
12/18/07 Page 3-85
<strong>Knik</strong> <strong>Arm</strong> Crossing DraftFinal EIS<br />
<strong>Affected</strong> <strong>Environment</strong><br />
9.3 percent self-identified as American Indian or Alaska Native, <strong>and</strong> the remaining<br />
11.8 percent claiming other racial heritage.<br />
The housing is among the older stock in Anchorage, with over half of the buildings<br />
constructed prior to 1960. Approximately 70 percent of those renting pay rents typically<br />
considered to be within their financial means, meaning they pay less then 30 percent of their<br />
gross income for housing. Only 7 percent of the residents in the community do not have a<br />
vehicle available to them for use, <strong>and</strong> over 90 percent of the residents who work commute by<br />
private vehicle.<br />
The characteristics set forth in the census data for this block group are consistent with the<br />
population characteristics observed during field reviews of the Study Area. It is estimated<br />
that there are approximately 13 minority business owners in the Government Hill commercial<br />
district.<br />
Field reviews of the Study Area did not identify any specific persons with physical<br />
impairments or other special needs when being relocated; individual interviews were,<br />
however, not conducted with persons who could be displaced by implementation of the<br />
proposed KAC project. Relocation practices for persons with special needs or impairments<br />
are further identified in Section 4.12.<br />
Other community characteristics are discussed in Sections 3.1.1 <strong>and</strong> Sections 3.2.1–5.<br />
3.2.7.5 Availability of property for relocations <strong>and</strong> displacements<br />
Research into available housing resources was conducted with a local real estate broker <strong>and</strong><br />
through use of related databases of property listings as of September 2005. Data were also<br />
gathered on <strong>and</strong> near the Study Area from properties posted for sale <strong>and</strong> from leasing offices<br />
of apartment complexes.<br />
When the project implementation process would require property acquisition, the project<br />
proponent would initiate a specific search to identify homes comparable to those belonging<br />
to or rented by those who would require relocation, <strong>and</strong> supplemental housing payments<br />
would be offered based on the provisions in state <strong>and</strong> federal laws. Mitigation measures are<br />
further identified in Section 4.12.<br />
3.3 Joint Development<br />
According to FHWA Technical Advisory T 6640.8A (1987), the EIS should identify <strong>and</strong><br />
discuss joint development measures that will enhance an affected community’s social,<br />
economic, environmental, <strong>and</strong> visual values. This section describes the joint development<br />
existing conditions.<br />
In general, joint development measures deal with multiple ownerships <strong>and</strong> operations <strong>and</strong><br />
maintenance of the transportation corridors that support the regional connection; a<br />
connection that spans jurisdictions <strong>and</strong> responsibilities. Joint development of the<br />
Page 3-86 12/18/07
<strong>Knik</strong> <strong>Arm</strong> Crossing DraftFinal EIS<br />
<strong>Affected</strong> <strong>Environment</strong><br />
transportation improvement would primarily benefit the traveling public, in general, <strong>and</strong><br />
businesses <strong>and</strong> residential developments, economically.<br />
The Mat-Su Borough is planning to pave Point MacKenzie Road from the end of the existing<br />
paved surface to Port MacKenzie. Point MacKenzie Road is a Borough-operated <strong>and</strong><br />
maintained facility. This construction will be accomplished with state funds ($15.4 million in<br />
FY 07) administered by the Mat-Su Borough under a State of Alaska Municipal Grant<br />
through the Alaska Department of Commerce, Community <strong>and</strong> Economic Development.<br />
Completion of construction is expected not later than June 2008 to coincide with the<br />
operation of the Cook Inlet Ferry between Port MacKenzie <strong>and</strong> the Ship Creek area on the<br />
east side of <strong>Knik</strong> <strong>Arm</strong>. <strong>Knik</strong>-Goose Bay Road, however, is a State-operated <strong>and</strong> maintained<br />
transportation facility. However, <strong>Knik</strong>-Goose Bay Road is a State-operated <strong>and</strong> maintained<br />
facility. Therefore the Borough <strong>and</strong> the State would coordinate with one another to jointly<br />
operate <strong>and</strong> maintain the transportation network in that area.<br />
Similarly on the Anchorage side, the Municipality of Anchorage <strong>and</strong> ADOT&PF have a joint<br />
project identified in the Anchorage Long-Range Transportation Plan (MOA 2005a) to<br />
extend Ingra <strong>and</strong> Gambell Streets on a viaduct as far as Whitney Road. This AMATSsponsored<br />
project provides an opportunity for joint development with KABATA in Phase 2<br />
of the proposed KAC project. For more information, see Section 3.2.2.1.2.<br />
3.4 Economic <strong>Environment</strong><br />
Although inextricably linked, the economies of the Mat-Su <strong>and</strong> Anchorage are quite<br />
different. The Mat-Su’s derives its vitality from a variety of sources, the most prominent of<br />
which is its role as residence-of-choice for many people who work in Anchorage or on the<br />
North Slope. Commuter data show that 47 percent of Mat-Su workers are employed outside<br />
the borough, <strong>and</strong> 75 percent of these are employed in Anchorage (KABATA 2005a).<br />
Anchorage is Alaska’s largest city—the state’s financial, commercial, <strong>and</strong> cultural center as<br />
well as its major transportation hub. The POA, Ted Stevens Anchorage International Airport,<br />
the Alaska Railroad, <strong>and</strong> the highway system all combine to make Anchorage Alaska’s<br />
primary distributor of goods <strong>and</strong> people.<br />
In 2004, Anchorage experienced its 16th year of uninterrupted employment growth<br />
(Fried 2005). The economic l<strong>and</strong>scape is gradually broadening, with more retail trade <strong>and</strong> a<br />
larger service sector. A wide range of economic <strong>and</strong> cultural opportunities associated with<br />
major metropolitan areas is available. In recent years, broad-based activity appears to have<br />
kept the economy on an even keel with no single project or h<strong>and</strong>ful of projects dominating<br />
the economy.<br />
The following sections provide additional information on the labor force <strong>and</strong> employment in<br />
the Study Area, employment <strong>and</strong> output by industry sector, a discussion of the major<br />
transportation facilities that might be affected by the proposed action, <strong>and</strong> a discussion of<br />
trends in supply of <strong>and</strong> dem<strong>and</strong> for housing <strong>and</strong> l<strong>and</strong> in the Mat-Su <strong>and</strong> Anchorage.<br />
12/18/07 Page 3-87
<strong>Knik</strong> <strong>Arm</strong> Crossing DraftFinal EIS<br />
<strong>Affected</strong> <strong>Environment</strong><br />
3.4.1 Labor Force <strong>and</strong> Unemployment<br />
The size of an area’s labor force provides a measure of potential employment <strong>and</strong> economic<br />
activity. The labor force is defined by the U.S. Census Bureau as the number of persons<br />
16 years of age or older, 16 being the age at which an individual is legally able to work.<br />
Employment levels are based on the number of people in the labor force that are working,<br />
while unemployment levels are based on the number of people in the labor force who are<br />
actively looking for work. The unemployment rate in Anchorage has always been<br />
considerably lower than the statewide Alaska <strong>and</strong> the Mat-Su averages.<br />
Table 3-9 shows the employment status of residents 16 years <strong>and</strong> over, including the<br />
percentage in the labor force, in the civilian labor force, or in the armed forces; the<br />
percentage unemployed; <strong>and</strong> the percentage not in the labor force.<br />
Table 3-9. Employment status of population 16 years old <strong>and</strong> over<br />
in the affected area, 2000<br />
Anchorage<br />
Mat-Su<br />
Anchorage total<br />
Government Hill<br />
(Census Tract 5)<br />
Mat-Su total<br />
Mat-Su Study<br />
Area<br />
Point<br />
MacKenzie<br />
Palmer<br />
Places<br />
Wasilla<br />
Houston<br />
Population 16 years old<br />
<strong>and</strong> over<br />
192,782 1,467 42,705 34,201 59 3,248 3,893 881<br />
In labor force (%) 74.4 66.3 66.1 67 49.2 64.3 70.8 62.3<br />
In civilian labor force (%) 69.9 61.9 65.2 66.1 49.2 62.8 70.6 62.3<br />
In armed forces (%) 4.4 4.4 0.9 0.9 0 1.6 0.2 0<br />
Not in labor force (%) 25.6 33.7 33.9 33 50.8 35.7 29.2 37.7<br />
Employed (%) 65.2 59 58.5 59.5 49.2 56 62.8 51.3<br />
Unemployed (%) 34.8 41 41.5 40.5 50.8 44 37.2 48.7<br />
Unemployment rate a (%) 6.8 4.6 10.3 9.9 4.3 10.8 11.2 17.7<br />
Source: U.S. Census Bureau 2005<br />
a<br />
The unemployment rate is based on the number of people in the civilian labor force.<br />
There is large seasonal variation in the unemployment rate in Anchorage because of the<br />
seasonal nature of many economic activities, particularly commercial fishing, mining, <strong>and</strong><br />
tourism. The unemployment rate is typically highest in January/February <strong>and</strong> lowest in<br />
July/August. In 2005, for example, the unemployment rate in Anchorage was 5.9 percent in<br />
January <strong>and</strong> 4.9 percent in August (ADOLWD 2005b).<br />
ISER has prepared a number of population <strong>and</strong> employment forecasts for Anchorage <strong>and</strong><br />
other regions of Alaska over the past 20 years. The projections are based on a set of<br />
assumptions about future economic conditions at the national, state, <strong>and</strong> local levels. The<br />
assumptions are the primary drivers in arriving at population <strong>and</strong> employment forecasts. The<br />
2020 employment projections from the last six reports it has prepared are shown in<br />
Page 3-88 12/18/07
<strong>Knik</strong> <strong>Arm</strong> Crossing DraftFinal EIS<br />
<strong>Affected</strong> <strong>Environment</strong><br />
Table 3-10. The last three reports have also provided estimates for 2030. The 1996, 2001,<br />
<strong>and</strong> 2004 projections were prepared for CEA, which uses the projections for utility planning.<br />
The 1999 <strong>and</strong> 2003 projections were prepared for the Municipality of Anchorage as input to<br />
the Anchorage 2020 comprehensive planning process (2001a) <strong>and</strong> the Municipality’s longrange<br />
transportation planning process (2003). The 2005 projection was prepared for<br />
KABATA for this Draft EIS.<br />
Table 3-10. Employment projections for Anchorage<br />
Year<br />
2020 Employment (000s)<br />
forecast<br />
prepared Anchorage Mat-Su Region<br />
1996 163.8 19.4 183.2<br />
1999 172.9 18.3 191.2<br />
2001 160.3 20.7 181.0<br />
2003 160.4 20.6 181.0<br />
2004 159.1 26.6 185.7<br />
2005 164.7 34.7 199.4<br />
2030 Employment (000s)<br />
2003 178.0 27.1 205.1<br />
2004 181.1 39.1 220.2<br />
2005 181.8 50.0 231.8<br />
Sources: Goldsmith, 1996, 2001, 2004; ISER 2005; MOA 2001a;<br />
MOA 2003<br />
The employment forecasts have varied over time as economic conditions, assumptions, <strong>and</strong><br />
perceptions about future economic activity have changed. Regional employment projections<br />
for 2030 have increased over the years, <strong>and</strong> the 2005 projection anticipates development in<br />
the Arctic National Wildlife Refuge <strong>and</strong> a natural gas pipeline to the North American market,<br />
which would contribute to higher employment estimates than forecast in prior years. In the<br />
more recent projections, ISER has recognized <strong>and</strong> incorporated in the model the trend of an<br />
increasing Mat-Su share of regional population <strong>and</strong> employment growth. Anchorage<br />
employment projections made in 2005 for 2020 <strong>and</strong> 2030 are up slightly over earlier<br />
estimates, but 2020 <strong>and</strong> 2030 employment projections for the Mat-Su are up substantially.<br />
The 2004 projections also anticipate that the Mat-Su would account for a larger share of<br />
employment in 2030.<br />
3.4.1.1 Employment <strong>and</strong> output by industry sector<br />
The relative importance of various economic sectors in the Mat-Su <strong>and</strong> Anchorage can be<br />
described using estimates of employment <strong>and</strong> gross output (sales). Employment by industry<br />
sector in 2004 is shown for the Mat-Su <strong>and</strong> Anchorage in Table 3-11, <strong>and</strong> further described<br />
in Appendix C of the L<strong>and</strong> Use <strong>and</strong> Transportation Forecast Technical Report<br />
(KABATA 2006b). Government is the predominant employment sector in the Mat-Su <strong>and</strong><br />
Anchorage, accounting for 21 percent of jobs in the Mat-Su <strong>and</strong> over 20 percent of jobs in<br />
Anchorage. The local school district, a component of the government sector, is the top<br />
employer in both the Mat-Su <strong>and</strong> Anchorage.<br />
12/18/07 Page 3-89
<strong>Knik</strong> <strong>Arm</strong> Crossing DraftFinal EIS<br />
<strong>Affected</strong> <strong>Environment</strong><br />
Table 3-11. Employment in Anchorage <strong>and</strong> the Mat Su,<br />
by 2004 industry sector<br />
Employment<br />
Industry Anchorage Mat-Su<br />
Agriculture, forestry, fishing, hunting 116 69<br />
Mining 2,052 48<br />
Utilities 564 148<br />
Construction 9,146 1,736<br />
Manufacturing 1,754 214<br />
Wholesale trade 4,647 108<br />
Transportation <strong>and</strong> warehousing 10,373 543<br />
Retail trade 17,255 2,928<br />
Information 4,388 520<br />
Finance <strong>and</strong> insurance 5,446 372<br />
Real estate, rental <strong>and</strong> leasing 2,753 179<br />
Professional, scientific, technical services 8,226 435<br />
Mgmt. of companies <strong>and</strong> enterprises 933 42<br />
Administrative <strong>and</strong> waste services 6,700 417<br />
Educational services 1,204 263<br />
Health care <strong>and</strong> social assistance 17,090 2,161<br />
Arts, entertainment <strong>and</strong> recreation 1,718 272<br />
Accommodation <strong>and</strong> food services 12,919 1,645<br />
Other services 5,281 550<br />
Government (including schools) 28,947 3,426<br />
Unclassified establishments 101 10<br />
Total employment 141,613 16,086<br />
Source: (ADOLWD 2005)<br />
Note: Does not include military or self-employed (therefore, totals will not add<br />
comparably with Table 3-9).<br />
Based on the 2002 version of IMpact analysis for PLANning (IMPLAN), 25 total industry<br />
output or sales in the Mat-Su were $1.6 billion in 2002 compared with $19.9 billion in<br />
Anchorage in the same year. Government is the largest sector in terms of sales in the Mat-Su<br />
<strong>and</strong> Anchorage. In the Mat-Su, government accounts for $315.9 million, <strong>and</strong> in Anchorage<br />
$3.6 billion in output. In the Mat-Su, the second-largest sector in terms of output is<br />
construction, accounting for $266.8 million of output, followed by retail trade at<br />
$210.8 million. The transportation <strong>and</strong> warehousing sector is second in size in Anchorage at<br />
$2.1 billion, which can be attributed to air cargo <strong>and</strong> other activities at Ted Stevens<br />
International Airport, shipping at the POA, <strong>and</strong> freight <strong>and</strong> passenger transportation by the<br />
25 IMpact analysis for PLANning), an economic input-output database <strong>and</strong> software package developed by<br />
Minnesota IMPLAN Group, Inc.<br />
Page 3-90 12/18/07
<strong>Knik</strong> <strong>Arm</strong> Crossing DraftFinal EIS<br />
<strong>Affected</strong> <strong>Environment</strong><br />
Alaska Railroad. The third-largest sector in Anchorage is construction, accounting for<br />
$1.7 billion of output.<br />
3.4.1.2 Transportation<br />
The build alternatives could affect three transportation components of the area economy: Port<br />
MacKenzie, the POA, <strong>and</strong> the Alaska Railroad. This section discusses the roles these<br />
components play in the overall regional economy.<br />
3.4.1.2.1 Port of Anchorage<br />
The POA is owned <strong>and</strong> operated by the Municipality of Anchorage. The port serves<br />
80 percent of Alaska’s populated area, from Homer to the North Slope—including the major<br />
military installations—by means of rail, road, <strong>and</strong> air cargo connections, <strong>and</strong> h<strong>and</strong>les more<br />
than 90 percent of all consumer goods sold in the state. In terms of economic impact, the port<br />
generates more than $750 million each year (POA 2005a). The POA provides employment<br />
for 21 municipal workers. 26 In addition, more than 1,400 people are employed in jobs related<br />
to port activities, such as shipping, stevedoring, <strong>and</strong> other occupations (USDOT 2005).<br />
To increase the efficiency of transporting goods into <strong>and</strong> out of Anchorage, the Municipality<br />
is preparing to undertake a 6-year port expansion <strong>and</strong> modernization project with cooperative<br />
funding from the federal government, state grants <strong>and</strong> bond guarantees, port profits, <strong>and</strong> port<br />
revenue bonds worth nearly $236 million (see Section 3.2.1.2.1) (POA 2005a).<br />
Although upl<strong>and</strong> expansion is planned, POA facilities <strong>and</strong> l<strong>and</strong> will be fully utilized by 2020<br />
(Northern Economics, Inc. [NEI] 2004). Sufficient berthing capacity will be available beyond<br />
that year, but the POA will not have space for further expansion. The POA expansion is<br />
designed to provide additional capacity for container cargo; thus, the port will continue to<br />
have limited capacity for h<strong>and</strong>ling bulk commodities.<br />
3.4.1.2.2 Port MacKenzie<br />
Port MacKenzie is a deep-draft marine port owned by the Mat-Su Borough. The port is<br />
located on <strong>Knik</strong> <strong>Arm</strong> across from the POA. The port consists of a 500-foot bulkhead <strong>and</strong><br />
9,000 acres of adjacent upl<strong>and</strong>s, which are available for commercial lease. A $13 million<br />
deep-water dock completed in 2005 augments a $7 million barge dock built by the Borough<br />
in 1999 (White 2005a).<br />
The first major user of the port facilities was Alutiiq Manufacturing Contractors, LLC, a<br />
builder of modular homes <strong>and</strong> portable buildings.<br />
In 2001, North Pacific Industries, Inc., executed a lease agreement with the Mat-Su for a<br />
wood chip loading facility at the port (Bauman 2005; White 2005b). In exchange for<br />
financial contributions toward the development of the port’s deep-water dock <strong>and</strong> conveyor<br />
26 Personal communication, Roger Graves, Government/<strong>Environment</strong>al Affairs, POA, with Donald Schlug,<br />
June 23, 2005.<br />
12/18/07 Page 3-91
<strong>Knik</strong> <strong>Arm</strong> Crossing DraftFinal EIS<br />
<strong>Affected</strong> <strong>Environment</strong><br />
belt system, North Pacific Industries was awarded a contract giving it sole rights to loading<br />
gravel, wood chips, peat, coal, <strong>and</strong> grain onto vessels.<br />
Economic development opportunities will increase because of Port MacKenzie’s extensive<br />
developable l<strong>and</strong> area <strong>and</strong> upcoming ferry service, the paving of the Point MacKenzie Road,<br />
<strong>and</strong> the planned improvements to Burma Road between Port MacKenzie <strong>and</strong> the Big Lake<br />
area.<br />
3.4.1.2.3 Alaska Railroad Corporation<br />
ARRC is an independent corporation owned by the State of Alaska. ARRC operates<br />
466 miles of main line <strong>and</strong> 59 miles of branch line. It owns or leases 1,625 freight cars <strong>and</strong><br />
42 passenger cars. A major transporter for the state, the Alaska Railroad h<strong>and</strong>les both freight<br />
<strong>and</strong> passengers throughout the railbelt. In the summer months, the Alaska Railroad assists the<br />
visitor industry by transporting passengers to popular destinations such as Fairbanks <strong>and</strong><br />
Seward. ARRC owns 36,000 acres, about half of which is used as right-of-way <strong>and</strong> for<br />
operations. The other half is available for leases or permits to generate revenue.<br />
ARRC has facilities in the Mat-Su <strong>and</strong> in Anchorage. The Alaska Railroad transports freight<br />
<strong>and</strong> passengers north <strong>and</strong> south through the Mat-Su <strong>and</strong> Anchorage. It also transports s<strong>and</strong><br />
<strong>and</strong> gravel from the Mat-Su to Anchorage for private clients, such as Anchorage S<strong>and</strong> &<br />
Gravel. The major ARRC facility in Anchorage, including the new passenger terminal, is in<br />
Ship Creek. ARRC owns extensive acreage in the Ship Creek area <strong>and</strong> commercially<br />
designated l<strong>and</strong> in Government Hill.<br />
During 2004, approximately 67 percent of ARRC’s revenues came from freight <strong>and</strong><br />
13 percent from passenger services. The majority of the remaining income is related to real<br />
estate activities <strong>and</strong> federal grant revenue.<br />
In 2004, ARRC experienced net earnings of $15.4 million on total revenues of<br />
$129.5 million. Railroad assets exceeded a half-billion dollars (ARRC 2005a). ARRC<br />
employed 716 persons in 2004.<br />
3.5 Physical <strong>Environment</strong><br />
The following discussion provides information that should be useful in underst<strong>and</strong>ing both<br />
the physical <strong>and</strong> natural setting of the proposed KAC project as well as the potential impacts<br />
to the environment from construction <strong>and</strong> operation of the proposed project.<br />
<strong>Knik</strong> <strong>Arm</strong> is generally considered to begin at Point Woronzof (west of Ted Stevens<br />
Anchorage International Airport), from which it extends 3 miles to the east <strong>and</strong> then more<br />
than 25 miles in a north-northeasterly direction to the mouths of the Matanuska <strong>and</strong> <strong>Knik</strong><br />
Rivers. At Point Woronzof, <strong>Knik</strong> <strong>Arm</strong> is about 2 miles wide, but significantly deeper<br />
(>100 feet) than the adjacent seabed of Upper Cook Inlet (
<strong>Knik</strong> <strong>Arm</strong> Crossing DraftFinal EIS<br />
<strong>Affected</strong> <strong>Environment</strong><br />
While the <strong>Knik</strong> <strong>Arm</strong> channel is narrowest at Cairn Point, the channel is also deepest at this<br />
point, with depths reaching 180 feet. This bathymetric depression, hereinafter referred to as<br />
the Cairn Point Trench, essentially defines the axis of <strong>Knik</strong> <strong>Arm</strong> through its extensions to the<br />
northeast <strong>and</strong> southwest.<br />
The Cairn Point Trench is remarkable in that its planform <strong>and</strong> bathymetric relief have<br />
remained essentially constant for more than 60 years; this is particularly remarkable when<br />
compared with other seabed features of <strong>Knik</strong> <strong>Arm</strong> (KABATA 2006c). From this, it is<br />
surmised that the Trench is not likely the result of or even significantly affected by modern<br />
hydrologic processes. Rather, the Trench is more likely a relict of prehistorical scour events<br />
such as the breaching of an ice dam during the period of the Naptowne glacial retreat.<br />
The typical cross section for <strong>Knik</strong> <strong>Arm</strong> consists of an entrenched inner passageway, with<br />
shelves of shallow water on both sides. In the northernmost part of the <strong>Arm</strong>, the shelves<br />
become shoals, which become tidal flats closer to the mouths of the <strong>Knik</strong> <strong>and</strong> Matanuska<br />
Rivers. The shelves are usually less than 20 feet below the mean lower low tide water line<br />
(MLLW). North of the Cairn Point Trench, the maximum depth of the thalweg in the inner<br />
trench is about -80 feet with respect to MLLW.<br />
The location of the proposed KAC bridge would be within a mile of the northern limit of the<br />
Cairn Point Trench. Shallow water in this area forms wing-shaped shelves on both sides of<br />
<strong>Knik</strong> <strong>Arm</strong>, which at its deepest, reaches to roughly 20 feet below MLLW. The trench in the<br />
center of <strong>Knik</strong> <strong>Arm</strong> in this area is typically around 65 feet below MLLW at its deepest.<br />
Tidal flats in the upper part of <strong>Knik</strong> <strong>Arm</strong> are defined as the surface within the banks at an<br />
elevation between MLLW <strong>and</strong> mean high water (MHW). 27 Nonvegetated, these tidal flats<br />
appear mostly in the upper end of <strong>Knik</strong> <strong>Arm</strong>, starting at Eagle River <strong>and</strong> becoming more<br />
predominant further north, as one approaches the mouths of the <strong>Knik</strong> <strong>and</strong> Matanuska Rivers.<br />
Below MLLW, such features are characterized as shoals, while above MHW, they are called<br />
“lowl<strong>and</strong>s,” or raised tidal flats, as can be seen between the <strong>Knik</strong> <strong>and</strong> Matanuska River<br />
bridges <strong>and</strong> Palmer on the Glenn Highway.<br />
The dominant climate for <strong>Knik</strong> <strong>Arm</strong>, as for all of Southcentral Alaska, is classified as<br />
“maritime.” Summers <strong>and</strong> winters are milder than what is normally seen in continental<br />
climates of similar latitude, with average temperatures ranging from 64.8°F in July to 19.2°F<br />
in January (Table 3-12). In addition to mild temperatures, the maritime climate of Alaska is<br />
characterized by heightened precipitation <strong>and</strong> persistent winds.<br />
27 Mean high water: a tidal datum. The average of all high water heights (i.e., the maximum height reached by a<br />
rising tide) observed over the National Tidal Datum Epoch (Tide <strong>and</strong> Current Glossary, NOAA,<br />
January 2000).<br />
12/18/07 Page 3-93
<strong>Knik</strong> <strong>Arm</strong> Crossing DraftFinal EIS<br />
<strong>Affected</strong> <strong>Environment</strong><br />
Table 3-12. Study area climate<br />
Month<br />
Average<br />
maximum<br />
temperature<br />
(°F)<br />
Average<br />
minimum<br />
temperature<br />
(°F)<br />
Average<br />
total<br />
precipitation<br />
(inches)<br />
Average<br />
snowfall<br />
(inches)<br />
Average<br />
snow<br />
depth<br />
(inches)<br />
January 19.2 5.7 0.86 10.5 12<br />
February 24.4 9.6 0.94 12.9 13<br />
March 32.4 16.5 0.74 9.0 11<br />
April 43.5 28.8 0.57 4.8 3<br />
May 54.5 39.4 0.61 0.2 0<br />
June 61.8 47.8 1.07 0.0 0<br />
July 64.8 52.1 2.10 0.0 0<br />
August 63.1 49.9 2.58 0.0 0<br />
September 54.6 41.6 2.42 0.2 0<br />
October 39.2 27.6 1.78 9.6 1<br />
November 27.0 15.3 1.19 13.4 4<br />
December 20.9 8.6 1.30 16.5 9<br />
Annual 42.1 28.6 16.15 77.0 4<br />
Source: Alaska Engineering Design Information System, CRREL-UAA, 2004<br />
Winter in Anchorage typically extends from mid-October to mid-April, the period when<br />
measurable snow is likely to occur. On the winter solstice, the sun is above the horizon for<br />
only 5 hours <strong>and</strong> 28 minutes. Spring usually begins about mid-April, immediately following<br />
winter “break-up.” This season is brief, but characterized by warm, pleasant days <strong>and</strong> chilly<br />
nights; the mean temperature rises rapidly <strong>and</strong> there is generally little precipitation.<br />
Summer is from June through early September <strong>and</strong> is, in reality, two seasons of about equal<br />
length, the first of which is dry, the second wet. At summer solstice, possible sunshine<br />
amounts to approximately 19.5 hours. About mid-July, average cloudiness increases<br />
markedly, <strong>and</strong> the remainder of the summer usually accounts for about 40 percent of annual<br />
precipitation.<br />
Autumn is brief in Anchorage, beginning about mid-September <strong>and</strong> lasting until mid-<br />
October. The frequency of cloudy <strong>and</strong> rainy days generally drops sharply in early October.<br />
Measurable snowfalls are rare in September, but substantial snowfalls, sometimes in excess<br />
of 12 inches, occasionally occur in mid-October.<br />
Some of the stronger southerly winds, occasionally with damaging effects, occur in late<br />
summer <strong>and</strong> fall, as a result of postfrontal winds following the movement of storms from the<br />
southern Bering Sea or Bristol Bay, northeastward across Interior Alaska. Less frequent, but<br />
often more damaging, are the southeasterly “Chugach” winds that are funneled down the<br />
creek canyons on the NW slopes of the Chugach Mountains. With gusts of 80 to<br />
100 miles/hour, these winds have occasionally caused substantial damage to roofs,<br />
powerlines, <strong>and</strong> other structures in the Anchorage Bowl.<br />
Page 3-94 12/18/07
<strong>Knik</strong> <strong>Arm</strong> Crossing DraftFinal EIS<br />
<strong>Affected</strong> <strong>Environment</strong><br />
3.5.1 Air Quality<br />
The Anchorage area is currently designated as meeting the National Ambient Air Quality<br />
St<strong>and</strong>ards (NAAQS) for four of the six criteria pollutants. The NAAQS are summarized in<br />
Table 3-13. Note that two forms of particulate matter are regulated: particles less than or<br />
equal to 10 microns in diameter (PM 10 ) <strong>and</strong> particles less than or equal to 2.5 microns in<br />
diameter (PM 2.5 ). The only “nonattainment” area with respect to the NAAQS in the<br />
Anchorage vicinity is in Eagle River, located approximately 10 miles northeast of<br />
Anchorage. Airborne concentrations of lead (Pb), sulfur dioxide (SO 2 ), ozone (O 3 ), <strong>and</strong><br />
nitrogen dioxide (NO 2 ) are currently below the established NAAQS for each of these<br />
pollutants. The Anchorage area is designated a maintenance area for carbon monoxide (CO).<br />
While concern over CO emissions has generally decreased nationwide, there has been a<br />
greater concern over so-called mobile source air toxics (MSATs) on some large highway<br />
projects in recent years. MSATs of greatest concern from motor vehicles include benzene,<br />
toluene, <strong>and</strong> other organic compounds that are emitted from vehicle exhausts when there is<br />
incomplete combustion of all fuel components. While concern over MSATs has been rising,<br />
emissions of these compounds have probably fallen substantially over the past several<br />
decades, as CO emissions have fallen. There are no good long-term measurements to<br />
demonstrate this, but the same techniques of more complete combustion <strong>and</strong> catalytic<br />
oxidation that are being used to reduce CO emissions would also tend to reduce MSAT<br />
emissions.<br />
The EPA is the lead Federal Agency for administering the Clean Air Act <strong>and</strong> has certain<br />
responsibilities regarding the health effects of MSATs. The EPA issued a Final Rule for the<br />
Control of Hazardous Air Pollutants from Mobile Sources (Source: Federal Register,<br />
February 26, 2007). This rule was issued under the authority in Section 202 of the Clean Air<br />
Act. In its rule, EPA examined the impacts of existing <strong>and</strong> newly promulgated mobile source<br />
emission control <strong>and</strong> fuel quality programs on emissions of MSATs, including the final rule<br />
referenced above. Between 1999 <strong>and</strong> 2030, EPA projects that even with an 88 percent<br />
increase in VMT, these control programs will reduce on-highway emissions MSATs (not<br />
including diesel PM) by approximately 60 percent<br />
3.5.1.1 Climatic conditions<br />
The winter climate of Anchorage with its relative lack of sunshine <strong>and</strong> its cold climate,<br />
promotes surface temperature inversions. These inversions tend to limit vertical mixing of<br />
the atmosphere near the ground <strong>and</strong>, because of the higher terrain surrounding most of<br />
Anchorage, keep emissions trapped near the ground. Also, during periods of cool<br />
temperatures <strong>and</strong> light winds, cold air tends to drain like a fluid into lower areas. Given these<br />
forcing factors, air quality impact analysis of CO emissions from vehicles <strong>and</strong> other nearsurface<br />
sources is generally focused on wintertime conditions.<br />
12/18/07 Page 3-95
<strong>Knik</strong> <strong>Arm</strong> Crossing DraftFinal EIS<br />
<strong>Affected</strong> <strong>Environment</strong><br />
3.5.1.2 Air quality conformity <strong>and</strong> State Implementation Plan<br />
In the past, a portion of the Anchorage Bowl, including the southernmost part of the Study<br />
Area, had been classified as a nonattainment area for CO. Effective July 23, 2004, the<br />
U.S. <strong>Environment</strong>al Protection Agency (USEPA) reclassified the Anchorage<br />
CO nonattainment area to a “maintenance” area, based on an Alaska State Implementation<br />
Plan (SIP) submittal demonstrating that the area was meeting the NAAQS for CO (Federal<br />
Register, June 23, 2004 [34,935]). Figure 3.22 depicts the Anchorage CO maintenance area<br />
boundary.<br />
Under the existing, approved CO maintenance plan for Anchorage, the Municipality of<br />
Anchorage must follow plan requirements to ensure that the area does not revert to<br />
nonattainment for CO. A maintenance area is subject to the same project-level air quality<br />
analysis as required for a nonattainment area. The proposed KAC project would be in the<br />
northern fringe of the currently designated maintenance area for CO, as shown in<br />
Figure 3.22.<br />
Page 3-96 12/18/07
<strong>Knik</strong> <strong>Arm</strong> Crossing DraftFinal EIS<br />
<strong>Affected</strong> <strong>Environment</strong><br />
Figure 3.22. Anchorage carbon monoxide maintenance area boundary<br />
12/18/07 Page 3-97
<strong>Knik</strong> <strong>Arm</strong> Crossing DraftFinal EIS<br />
<strong>Affected</strong> <strong>Environment</strong><br />
3.5.1.3 Critical pollutants<br />
3.5.1.3.1 Carbon monoxide<br />
Motor vehicles are the primary source of CO in the Anchorage area. The highest levels<br />
of CO are emitted by vehicles in the first 5 to 10 minutes after start-up while the vehicle<br />
engine is cold. Anchorage’s cold winter temperatures increase the number <strong>and</strong> duration of<br />
“cold-start” emissions. Other sources of CO in the Anchorage area include combustion of all<br />
kinds, including heating of buildings, aircraft use, <strong>and</strong> wood burning. National Ambient Air<br />
Quality St<strong>and</strong>ards are listed in Table 3-13.<br />
Table 3-13. National Ambient Air Quality St<strong>and</strong>ards<br />
Pollutant Primary Secondary<br />
SO 2<br />
3-hour average a 1,300 μg/m 3<br />
24-hour average a 365 μg/m 3<br />
Annual average 80 μg/m 3<br />
PM 10<br />
24-hour average a 150 μg/m 3 150 μg/m 3<br />
Annual average 50 μg/m 3 50 μg/m 3<br />
PM 2.5<br />
24-hour average c 65 μg/m 3 65 μg/m 3<br />
Annual average d 15 μg/m 3 15 μg/m 3<br />
CO<br />
1-hour average a<br />
8-hour average a<br />
O 3<br />
35 ppm b<br />
9 ppm b<br />
8-hour average a 0.080 ppm 0.080 ppm<br />
NO 2<br />
Annual average 0.053 ppm 0.053 ppm<br />
Pb<br />
Calendar quarter average 1.5 μg/m 3 1.5 μg/m 3<br />
a Not to be exceeded more than once per year<br />
b<br />
Equivalent to 40 <strong>and</strong> 10 milligrams/m 3 for the 1- <strong>and</strong> 8-hour averages, respectively<br />
c Attained when 99th percentile value in 3-year period is below st<strong>and</strong>ard level<br />
d St<strong>and</strong>ard is based on a spatial average of concentration on a neighborhood scale<br />
A 3-year summary of air quality data for monitors nearest the project area is provided in<br />
Table 3-14. CO is one of the pollutants of primary concern in the Anchorage <strong>and</strong> Mat-Su<br />
areas). CO is monitored only in the wintertime, when CO emissions <strong>and</strong> meteorology<br />
combine to produce the highest CO concentrations.<br />
Page 3-98 12/18/07
<strong>Knik</strong> <strong>Arm</strong> Crossing DraftFinal EIS<br />
<strong>Affected</strong> <strong>Environment</strong><br />
3.5.1.3.2 PM 10<br />
A 3-year (2002–2004) summary of air quality data for monitors nearest the project area is<br />
provided in Table 3-15. PM 10 , one of the pollutants of primary concern in the Anchorage <strong>and</strong><br />
Mat-Su areas, is generally monitored year-round. There have been measured exceedances of<br />
the 24-hour NAAQS for PM 10 in 2003 at each of the three PM 10 monitoring sites in<br />
Anchorage, at the site in Eagle River, <strong>and</strong> at the Harrison Court site in Butte in the Mat-Su.<br />
These exceedances were associated with a week-long wind storm in March 2003 that<br />
included wind gusts to nearly 100 miles/hour (MOA 2005f). It is not uncommon for<br />
exceedances to be measured during the spring “break-up” period as snow <strong>and</strong> ice thaw,<br />
leaving behind accumulated particulate matter that can become airborne during high winds.<br />
An exceedance of the PM 10 24-hour NAAQS was also measured at the Harrison Court<br />
monitor site in 2004. This site is near Palmer, northeast of Anchorage, in an area that would<br />
expect to see reduced traffic if the proposed KAC project were to be constructed.<br />
3.5.1.3.3 PM 2.5<br />
A 3-year summary of air quality data for monitors nearest the Study Area is provided in<br />
Table 3-16. PM 10 is one of the pollutants of primary concern in the Anchorage <strong>and</strong> Mat-Su<br />
areas. While very fine particulate matter, measured as PM 2.5 , has been a concern in parts of<br />
the United States since issuance of the NAAQS in the late 1990s, the PM 2.5 monitoring data<br />
for the Anchorage <strong>and</strong> Mat-Su areas show that concentrations are well below the NAAQS for<br />
this size of particulate matter.<br />
USEPA recently published a proposed rule to modify the existing PM 2.5 NAAQS, as well as<br />
to revoke the existing PM 10 st<strong>and</strong>ard, <strong>and</strong> replace it with a coarse-particle st<strong>and</strong>ard for<br />
particle sizes generally between 2.5 <strong>and</strong> 10 microns in diameter (Federal Register,<br />
January 17, 2006 [71:2620]). The proposed level of the annual PM 2.5 NAAQS would remain<br />
constant, while USEPA has proposed to reduce the 24-hour PM 2.5 NAAQS from 65 μg/m 3 to<br />
35 μg/m 3 . Compliance with the 24-hour limit is based on the 98th percentile of the<br />
concentration distribution. Also, compliance with the annual <strong>and</strong> 24-hour PM 2.5 NAAQS is<br />
based on an average of 3 years of monitoring data. According to the available PM 2.5<br />
monitoring data summarized in Table 3-16, it appears that the Anchorage <strong>and</strong> Mat-Su areas<br />
would be in compliance if the new, stricter 24-hour PM 2.5 st<strong>and</strong>ard is finalized.<br />
Because USEPA allows exclusion of episodes caused by high winds <strong>and</strong> other natural events<br />
such as volcano eruptions, it is likely that the monitored values used for determining<br />
compliance would be even lower than the values summarized in Table 3-16, because such<br />
natural events have affected particulate matter levels during some of the higher-impact<br />
episodes in Anchorage in recent years. Another factor expected to drive PM 2.5 concentrations<br />
even lower is a suite of new USEPA rules that will greatly reduce sulfur content of diesel<br />
fuels, along with SO 2 , NO x , <strong>and</strong> PM emissions from diesel-powered trucks, locomotives, <strong>and</strong><br />
marine vessels. Two grades of diesel fuel are now sold in the United States, with fuel sulfur<br />
limits of 5,000 ppm for nonroad diesel fuel <strong>and</strong> 500 ppm for on-road diesel fuel.<br />
12/18/07 Page 3-99
<strong>Knik</strong> <strong>Arm</strong> Crossing DraftFinal EIS<br />
<strong>Affected</strong> <strong>Environment</strong><br />
Beginning later in 2006, the on-road diesel fuel sulfur limit will drop to 15 ppm <strong>and</strong> the<br />
nonroad diesel fuel limit will drop to 500 ppm. In 2011, the nonroad diesel fuel sulfur limit<br />
will also drop to 15 ppm. Because most PM 2.5 is related to combustion sources <strong>and</strong> because a<br />
significant portion of the PM 2.5 emissions from fuel combustion is related to sulfur, these<br />
new rules will drive PM 2.5 emissions lower nationwide. In addition, starting in 2007, new<br />
USEPA st<strong>and</strong>ards will require on-road trucks to reduce emission rates of NO x <strong>and</strong> PM by<br />
90 percent from the prior-year st<strong>and</strong>ards.<br />
Page 3-100 12/18/07
<strong>Knik</strong> <strong>Arm</strong> Crossing DraftFinal EIS<br />
<strong>Affected</strong> <strong>Environment</strong><br />
Table 3-14. Monitored carbon monoxide in Anchorage<br />
Monitor location<br />
Monitor<br />
I.D.<br />
Year<br />
Hourly<br />
observations<br />
1-hour<br />
value (ppm)<br />
Second<br />
maximum<br />
NAAQS<br />
Maximum<br />
Maximum<br />
8-hour<br />
value (ppm)<br />
Second<br />
maximum<br />
3000 East 16th (Trinity Christian Church) 020200018-1 2002 4,333 12.1 9.4 35 5.3 4.7 9<br />
3000 East 16th (Trinity Christian Church) 020200018-1 2003 4,289 9.0 8.4 35 6.2 5.7 9<br />
3000 East 16th (Trinity Christian Church) 020200018-1 2004 4,371 9.4 8.8 35 6.8 6.4 9<br />
3002 New Seward Highway 020200037-1 2002 4,215 8.4 5.8 35 4.4 4.2 9<br />
3002 New Seward Highway 020200037-1 2003 4,292 8.5 7.8 35 6.2 5.4 9<br />
3002 New Seward Highway 020200037-1 2004 4,217 8.9 8.5 35 5.8 5.5 9<br />
3201 Turnagain Street 020200048-1 2002 3,921 10.8 10.8 35 6.5 5.9 9<br />
3201 Turnagain Street 020200048-1 2003 4,314 9.8 9.6 35 8.3 6.7 9<br />
3201 Turnagain Street 020200048-1 2004 4,332 11.3 11.0 35 8.1 7.9 9<br />
8851 Jewel Lake Road 020200049-1 2002 1,794 4.0 3.8 35 <strong>3.0</strong> 2.9 9<br />
8851 Jewel Lake Road 020200049-1 2003 4,211 5.8 5.2 35 4.5 3.2 9<br />
8851 Jewel Lake Road 020200049-1 2004 2,173 7.3 5.9 35 5.0 4.9 9<br />
Source: United States <strong>Environment</strong>al Protection Agency. October 2005. “AIRS Air Quality Monitoring Database,” .<br />
NAAQS<br />
12/18/07 3-101
<strong>Knik</strong> <strong>Arm</strong> Crossing DraftFinal EIS<br />
<strong>Affected</strong> <strong>Environment</strong><br />
Table 3-15. Monitored particulate matter equal to or less than 10 microns in diameter in Anchorage <strong>and</strong> Mat-Su areas<br />
Monitor location<br />
Monitor<br />
I.D.<br />
Year<br />
Daily<br />
observations<br />
Maximum<br />
Second<br />
maximum<br />
24-hour value (μg/m 3 )<br />
Third<br />
maximum<br />
Fourth<br />
maximum<br />
NAAQS<br />
Annual<br />
average<br />
3000 East 16th (Trinity Christian<br />
Church)<br />
020200018-1 2002 62 46 40 33 33 150 14 50<br />
3000 East 16th (Trinity Christian<br />
Church)<br />
020200018-1 2003 61 226 57 40 39 150 19 50<br />
3000 East 16th (Trinity Christian<br />
Church)<br />
020200018-1 2004 59 38 37 37 35 150 16 50<br />
1100 Muldoon Road 020200043-1 2002 85 63 58 51 49 150 28 50<br />
1100 Muldoon Road 020200043-1 2003 60 277 187 180 138 150 47 50<br />
1100 Muldoon Road 020200043-1 2004 35 83 55 49 48 150 28 50<br />
3335 East Tudor Road 020200044-1 2002 167 105 104 97 94 150 30 50<br />
3335 East Tudor Road 020200044-1 2003 177 421 179 117 108 150 26 50<br />
3335 East Tudor Road 020200044-1 2004 178 97 97 89 86 150 22 50<br />
Parkgate – Eagle River 020201004-2 2002 60 46 40 38 36 150 18 50<br />
Parkgate – Eagle River 020201004-2 2003 58 590 92 82 75 150 32 50<br />
Parkgate – Eagle River 020201004-2 2004 61 70 43 38 38 150 17 50<br />
Harrison Court – Butte (Mat-Su) 021700008-1 2002 109 37 36 33 30 150 9 50<br />
Harrison Court – Butte (Mat-Su) 021700008-1 2003 61 265 122 82 72 150 21 50<br />
Harrison Court – Butte (Mat-Su) 021700008-1 2004 43 605 97 51 40 150 29 50<br />
Source: United States <strong>Environment</strong>al Protection Agency. October 2005. “AIRS Air Quality Monitoring Database,” .<br />
Note: Bolded data designate readings greater than NAAQS. Most were affected by a week-long windstorm in March 2003<br />
NAAQS<br />
(μg/m 3 )<br />
3-102 12/18/07
<strong>Knik</strong> <strong>Arm</strong> Crossing DraftFinal EIS<br />
<strong>Affected</strong> <strong>Environment</strong><br />
Table 3-16. Monitored particulate matter equal to or less than 2.5 microns in diameter in Anchorage <strong>and</strong> Mat-Su areas<br />
Monitor location<br />
Monitor<br />
I.D.<br />
Year<br />
Daily<br />
observations<br />
Maximum<br />
Second<br />
maximum<br />
24-hour value (μg/m 3 )<br />
Third<br />
maximum<br />
Fourth<br />
maximum<br />
NAAQS<br />
Annual<br />
average<br />
3000 East 16th (Trinity<br />
Christian Church)<br />
020200018-1 2002 122 17 17 16 16 65 6.0 15<br />
3000 East 16th (Trinity<br />
Christian Church)<br />
020200018-1 2003 118 25 19 16 16 65 5.9 15<br />
3000 East 16th (Trinity<br />
Christian Church)<br />
020200018-1 2004 122 44 32 32 32 65 7.0 15<br />
3335 East Tudor Road 020200044-1 2002 113 21 20 18 18 65 6.9 15<br />
S. Big Lake Road – Mat-Su 021700004-1 2002 115 14 12 10 9 65 3.5 15<br />
Harrison Court – Mat-Su 021700008-1 2002 116 40 37 35 23 65 5.6 15<br />
Harrison Court – Mat-Su 021700008-1 2003 59 40 30 24 22 65 7.3 15<br />
Harrison Court – Mat-Su 021700008-1 2004 31 28 23 20 18 65 7.8 15<br />
Source: United States <strong>Environment</strong>al Protection Agency. October 2005. “AIRS Air Quality Monitoring Database,” .<br />
NAAQS<br />
(μg/m 3 )<br />
12/18/07 3-103
<strong>Knik</strong> <strong>Arm</strong> Crossing DraftFinal EIS<br />
<strong>Affected</strong> <strong>Environment</strong><br />
3.5.2 Noise Levels<br />
Regulatory Overview<br />
Noise is defined as unwanted sound. It may consist of a variety of sounds of different<br />
intensities across the entire frequency spectrum. Noise is measured in units of decibels (dB),<br />
on a logarithmic scale. Because human hearing is not equally sensitive to all frequencies of<br />
sound, certain frequencies are given more “weight.” The A-weighted decibel scale (dBA)<br />
corresponds to the sensitivity range for human hearing. A noise level change of 3 dBA is<br />
barely perceptible to average human hearing, whereas a 5-dBA change in noise level is<br />
clearly noticeable. A 10-dBA change in noise level is perceived as a doubling of noise<br />
loudness. Table 3-17 shows noise levels associated with common, everyday sources <strong>and</strong><br />
places in context the magnitude of noise levels discussed here.<br />
Table 3-17. Common noise sources <strong>and</strong> levels<br />
Sound pressure level<br />
(dBA)<br />
Typical<br />
sources<br />
120 jet aircraft takeoff at 100 feet<br />
110 same aircraft at 400 feet<br />
90 motorcycle at 25 feet<br />
80 garbage disposal<br />
70 city street corner<br />
60 conversational speech<br />
50 typical office<br />
40 living room (without TV on)<br />
30 quiet bedroom at night<br />
Source: <strong>Environment</strong>al Impact Analysis H<strong>and</strong>book, ed. by<br />
Rau <strong>and</strong> Wooten, 1980<br />
<strong>Environment</strong>al noise is typically expressed using a descriptor that characterizes both the<br />
volume (or intensity level of the noise) <strong>and</strong> the time associated with the noise event. L eq is<br />
the noise level that contains the same amount of acoustic energy as the time-varying levels of<br />
the actual measured (or modeled) noise event. In other words, it is an energy-based average<br />
noise level. This study uses the 1-hour equivalent level, or L eq(h) .<br />
FHWA established noise abatement criteria (NAC) to help determine the noise impacts<br />
associated with highway development projects. The NAC are noise levels assigned to various<br />
l<strong>and</strong> uses (e.g., picnic areas, churches, commercial l<strong>and</strong>, undeveloped l<strong>and</strong>) grouped by<br />
sensitivity to traffic noise levels. The NAC represent the maximum traffic noise levels that<br />
allow uninterrupted use within each activity category. Table 3-18 lists the l<strong>and</strong> activity<br />
categories included in the FHWA-established NAC <strong>and</strong> the sound level (occurring over a<br />
1-hour period, or L eq(h) ) that triggers noise abatement considerations for that l<strong>and</strong> use<br />
category. Sound levels are reported in dBA.<br />
3-104 12/18/07
<strong>Knik</strong> <strong>Arm</strong> Crossing DraftFinal EIS<br />
<strong>Affected</strong> <strong>Environment</strong><br />
The FHWA definition of a traffic noise impact (23 C.F.R. § 772) contains two criteria; only<br />
one is required to be met. Traffic noise impacts are defined as impacts that occur when the<br />
predicted future traffic noise levels:<br />
• approach or exceed the NAC given in Table 3-18 (ADOT&PF has defined “approach” as<br />
described below)<br />
• substantially exceed the existing noise levels (ADOT&PF has defined “substantially<br />
exceed” as described below)<br />
Table 3-18. Noise abatement criteria<br />
Activity<br />
category<br />
A<br />
B<br />
C<br />
L eq(h)<br />
57 dBA<br />
(exterior)<br />
67 dBA<br />
(exterior)<br />
72 dBA<br />
(exterior)<br />
Description of activity category<br />
L<strong>and</strong>s on which serenity <strong>and</strong> quiet are of extraordinary significance<br />
<strong>and</strong> serve an important public need <strong>and</strong> where the preservation of<br />
those qualities is essential if the area is to continue to serve its<br />
intended purpose.<br />
Picnic areas, recreation areas, playgrounds, active sports areas,<br />
parks, residences, motels, hotels, schools, churches, libraries, <strong>and</strong><br />
hospitals.<br />
Developed l<strong>and</strong>s, properties, or activities not included in Categories A<br />
or B, above.<br />
D No limit Undeveloped l<strong>and</strong>s<br />
E<br />
52 dBA<br />
(interior)<br />
Residences, motels, hotels, public meeting rooms, schools,<br />
churches, libraries, hospitals, <strong>and</strong> auditoriums.<br />
Source: Federal-Aid Highway Program Manual 7-7-3, “Procedures for Abatement of Highway Traffic Noise <strong>and</strong> Construction<br />
Noise,” 1982<br />
The ADOT&PF Noise Abatement Policy states that a noise level of 65 dBA approaches the<br />
NAC (for category B) <strong>and</strong> that a 10-dBA increase from existing noise levels is a substantial<br />
increase.<br />
3.5.2.1 Study Area l<strong>and</strong> use<br />
The proposed KAC spans two distinct geographic regions in the Study Area: the Mat-Su <strong>and</strong><br />
Anchorage. The few noise-sensitive l<strong>and</strong> uses that exist in the Mat-Su portion of the Study<br />
Area consist of scattered, isolated residences along Point MacKenzie Road. A university<br />
agricultural research station has facilities for overnight sleep—although, at the time of a late<br />
summer 2005 Study Team reconnaissance, it did not appear to be in active use. For the<br />
purposes of the traffic noise analysis, the Study Team considered it to be a residential l<strong>and</strong><br />
use.<br />
L<strong>and</strong> use in the Anchorage portion of the Study Area is diverse. L<strong>and</strong> use in the vicinity of<br />
the proposed bridge touch-down area is undeveloped. The POA is an industrial facility <strong>and</strong><br />
not considered noise-sensitive. Elmendorf is a large, active military campus with residential<br />
<strong>and</strong> administrative areas, including a heavily used airport facility. Additional residential areas<br />
exist off site of Elmendorf, primarily in the nearby Government Hill neighborhood.<br />
Occupying most of a peninsula-like area, Government Hill is almost entirely residential, with<br />
12/18/07 3-105
<strong>Knik</strong> <strong>Arm</strong> Crossing DraftFinal EIS<br />
<strong>Affected</strong> <strong>Environment</strong><br />
small areas of commercial l<strong>and</strong> use <strong>and</strong> park l<strong>and</strong>s; Harvard Park <strong>and</strong> Sunset Park, are of<br />
interest to this Study. Harvard Park includes facilities for tennis, dancing, <strong>and</strong> curling. This<br />
area exists between Harvard Avenue <strong>and</strong> Loop Road. Across Loop Road lies Sunset Park, an<br />
open space available for public recreation. Another residential area lies adjacent to this park,<br />
south of Elmendorf. Government Hill School, an elementary school, lies between Elmendorf<br />
<strong>and</strong> the residential areas of Government Hill.<br />
Moving south through the Anchorage portion of the Study Area, Ship Creek lies at the base<br />
of a steep but shallow valley. The Alaska Railroad passenger service train tracks <strong>and</strong> freight<br />
train tracks rail yard serving <strong>and</strong> the POA share the valley floor with Ship Creek, along with<br />
some commercial/light industrial l<strong>and</strong> uses <strong>and</strong> a restaurant. To the south, terrain rises to<br />
meet densely developed Downtown Anchorage. L<strong>and</strong> use in the vicinity of the project<br />
terminus in Downtown Anchorage includes commercial businesses, hotels, parking lots, <strong>and</strong><br />
some residences.<br />
3.5.2.2 Existing noise levels<br />
The ambient acoustic environment in the Mat-Su portion of the Study Area is dominated by<br />
aircraft noise <strong>and</strong> noise from intermittent roadway traffic. Traffic in this portion of the<br />
Mat-Su is very light <strong>and</strong> infrequent. The ambient acoustic environment in the Anchorage<br />
portion of the Study Area is dominated by frequent military, commercial, <strong>and</strong> recreational<br />
aircraft noise events; locomotive <strong>and</strong> freight train noise; noise from the POA; noise from<br />
traffic on existing roadways; <strong>and</strong> noise from other daily activities (lawn mowing,<br />
l<strong>and</strong>scaping, recreation, etc.). Aircraft <strong>and</strong> train noise <strong>and</strong> noise from occasional local<br />
roadway traffic dominate the acoustic environment in the residential areas of Government<br />
Hill. Traffic noise <strong>and</strong> aircraft <strong>and</strong> train noise dominate the ambient acoustic environment in<br />
the southern portions of the Study Area (Downtown Anchorage).<br />
Table 3-19 shows existing noise levels measured in the Study Area during peak traffic<br />
periods. Noise levels are expressed using the L eq descriptor (explained above). Figure 3.23<br />
displays the locations of these noise measurements as well as other sites evaluated in this<br />
noise analysis. In addition to the eight noise measurement sites, eight additional noise<br />
receiver sites were evaluated for this noise study. All 16 noise receiver sites were evaluated<br />
for future noise conditions using the No-Action <strong>and</strong> build alternatives, as described in<br />
Section 4.5.2.<br />
3-106 12/18/07
<strong>Knik</strong> <strong>Arm</strong> Crossing DraftFinal EIS<br />
<strong>Affected</strong> <strong>Environment</strong><br />
Figure 3.23. Selected Study Area noise receiver locations<br />
12/18/07 3-107
<strong>Knik</strong> <strong>Arm</strong> Crossing DraftFinal EIS<br />
<strong>Affected</strong> <strong>Environment</strong><br />
Table 3-19. Existing noise levels in selected Study Area locations<br />
Receiver<br />
identification<br />
Description or location<br />
Receiver<br />
type<br />
Existing<br />
L eq<br />
(dBA)<br />
3 Private driveway off Point MacKenzie Road residential 57<br />
4 Government Hill School school 51<br />
6 309 Harvard Avenue residential 59<br />
9 Sunset Park south of Vine Avenue recreational 60<br />
13 C Street <strong>and</strong> 3rd Avenue commercial 63<br />
14 A Street <strong>and</strong> 3rd Avenue commercial 66<br />
15 Gambell Street <strong>and</strong> 3rd Avenue residential 64<br />
16 Ingra Street <strong>and</strong> 3rd Avenue commercial 67<br />
3.5.3 Geology/Soils/Seismic Hazards<br />
This section summarizes the affected environment for geology, soils, <strong>and</strong> seismic hazards in<br />
the Study Area. Additional details on these resources can be found in the <strong>Knik</strong> <strong>Arm</strong> Crossing<br />
Geotechnical Memor<strong>and</strong>um (KABATA 2006j) <strong>and</strong> the <strong>Knik</strong> <strong>Arm</strong> Crossing Seismic Studies<br />
Technical Report (KABATA 2006k).<br />
3.5.3.1 Geology <strong>and</strong> soils<br />
3.5.3.1.1 Physiographic setting<br />
Onshore physiography<br />
<strong>Knik</strong> <strong>Arm</strong> lies in the Cook Inlet-Susitna Lowl<strong>and</strong> physiographic province. Numerous lakes,<br />
ponds, <strong>and</strong> wetl<strong>and</strong>s associated with glacial tills <strong>and</strong> outwash deposits are found throughout<br />
this gently sloping area. The lowl<strong>and</strong>s are fed by multiple drainages that originate in the<br />
surrounding mountains, several of which are large, glacially fed, braided rivers with heavy<br />
sediment loads that drain into <strong>Knik</strong> <strong>Arm</strong> (Nowacki et al. 2002; Wahrhaftig 1965).<br />
The shorelines of <strong>Knik</strong> <strong>Arm</strong> are characterized by large mud flats in the intertidal zones<br />
<strong>and</strong> 50- to 150-foot-high bluffs. Cairn Point on the eastern shore marks the southwestern<br />
extent of Elmendorf Moraine, which is an end moraine of the combined Matanuska <strong>and</strong> <strong>Knik</strong><br />
glaciers that advanced during the Naptowne Ice Age. This major geomorphic feature extends<br />
across <strong>Knik</strong> <strong>Arm</strong> to the Susitna Lowl<strong>and</strong>s, <strong>and</strong> was breached by rapid downcutting of<br />
outwash streams during a period of lowered sea level in the late Pleistocene. The waters of<br />
Cook Inlet then rose in response to a worldwide sea level increase, <strong>and</strong> melting glaciers<br />
flooded the valley, creating modern-day <strong>Knik</strong> <strong>Arm</strong>.<br />
Submerged l<strong>and</strong>forms<br />
L<strong>and</strong>forms beneath <strong>Knik</strong> <strong>Arm</strong> near the proposed project consist of shallow tidal flats <strong>and</strong><br />
gently sloping, hummocky benches that extend from shore to depths of about 20 to 30 feet<br />
below MLLW (see Figure 3.24). The deepest part of the channel in the middle of <strong>Knik</strong><br />
3-108 12/18/07
<strong>Knik</strong> <strong>Arm</strong> Crossing DraftFinal EIS<br />
<strong>Affected</strong> <strong>Environment</strong><br />
Figure 3.24. <strong>Knik</strong> <strong>Arm</strong> bathymetry<br />
12/18/07 3-109
<strong>Knik</strong> <strong>Arm</strong> Crossing DraftFinal EIS<br />
<strong>Affected</strong> <strong>Environment</strong><br />
<strong>Arm</strong>, extending to depths of about 60 to 65 feet below MLLW, is steep-sided to the west <strong>and</strong><br />
more gently sloping to the east. The channel deepens to about 180 feet below MLLW near<br />
Cairn Point along a narrow steep-sided depression (Harding Lawson Associates 1983;<br />
FHWA 2005a, Smith 2005; KABATA 2006a), a feature often referred to as the Cairn Point<br />
Trench (see Section 2.6.3.2.3). This feature may be an erosional remnant from a stream<br />
canyon that existed during the late Pleistocene lower sea level st<strong>and</strong>.<br />
3.5.3.1.2 Geologic units<br />
Poorly consolidated rocks of Tertiary age underlie most of the Anchorage area <strong>and</strong> the Cook<br />
Inlet-Susitna basin. Bedrock is likely deeper than 600 to 1,000 feet in the vicinity of the<br />
proposed project (Harding Lawson Associates 1983; Golder Associates 2003;<br />
KABATA 2006j). Older bedrock outcrops surrounding the basin are being considered for use<br />
as armor <strong>and</strong> filter rock in the proposed bridge approaches. Quarries in the Mat-Su <strong>and</strong><br />
Eklutna-Peters Creek areas contain granite, graywacke, <strong>and</strong> greenstone bedrock of<br />
predominantly Jurassic age (PND 2005, Winkler 1992). Additional information on rock<br />
quarries is provided in the <strong>Knik</strong> <strong>Arm</strong> Crossing Potential <strong>Arm</strong>or <strong>and</strong> Rock Quarries Technical<br />
Report (KABATA 2006l).<br />
Unconsolidated Quaternary deposits of glacial origin overlie the older bedrock in the<br />
Anchorage area (Figure 3.25). Deposits from the last two glacial events, the <strong>Knik</strong> <strong>and</strong><br />
Naptowne Glaciations dating from 75,000 to 11,000 years ago, form most of the Quaternary<br />
units in the project area. These include 1) coarse-grained glaciodeltaic deposits interfingered<br />
with silty clay that are associated with the Pleistocene <strong>Knik</strong> Glaciation; <strong>and</strong> 2) the Bootlegger<br />
Cove Formation, the Elmendorf Moraine, <strong>and</strong> related outwash alluvium associated with the<br />
late Pleistocene Naptowne Glaciation. A sensitive silty clay unit within the upper half of the<br />
Bootlegger Cove Formation was responsible for major translational l<strong>and</strong>sliding that occurred<br />
in Anchorage during the 1964 earthquake (Updike et al. 1988).<br />
Glacial <strong>and</strong> alluvial deposits<br />
The following Quaternary glacial <strong>and</strong> alluvial deposits occur on the west <strong>and</strong> east sides of<br />
<strong>Knik</strong> <strong>Arm</strong>:<br />
• Mat-Su approach alternatives <strong>and</strong> west bluff. The Mat-Su alternatives would cross<br />
surficial deposits composed chiefly of outwash alluvium, glacial till, morainal material,<br />
<strong>and</strong> peat deposits laid down during the Naptowne Glaciation. Where present, peat deposits<br />
typically extend up to depths of 5 feet (Mat-Su Borough 1995a; Natural Resources<br />
Conservation Service [NRCS] 1998). The 100-foot-high west bluff contains about 40 feet<br />
of s<strong>and</strong>y clay at the base of the bluff, overlain by 60 feet of silty gravelly s<strong>and</strong> <strong>and</strong> till-like<br />
s<strong>and</strong>y gravelly clay, all of which are likely the stratigraphic equivalent of the Bootlegger<br />
Cove Formation. Materials below the base of the bluff consist of clay <strong>and</strong> gravelly till of<br />
the <strong>Knik</strong> Glaciation (Mat-Su Borough 1995a; KABATA 2006j). S<strong>and</strong>s <strong>and</strong> gravels of the<br />
Elmendorf Moraine <strong>and</strong> Naptowne outwash deposits near Port MacKenzie <strong>and</strong> other<br />
Mat-Su Valley sites are being considered for use as fill material for the proposed project<br />
(Figure 3.26).<br />
3-110 12/18/07
<strong>Knik</strong> <strong>Arm</strong> Crossing DraftFinal EIS<br />
<strong>Affected</strong> <strong>Environment</strong><br />
Figure 3.25. Quaternary geologic map – Anchorage area<br />
12/18/07 3-111
<strong>Knik</strong> <strong>Arm</strong> Crossing DraftFinal EIS<br />
<strong>Affected</strong> <strong>Environment</strong><br />
Figure 3.26. Study Area gravel pit locations<br />
3-112 12/18/07
<strong>Knik</strong> <strong>Arm</strong> Crossing DraftFinal EIS<br />
<strong>Affected</strong> <strong>Environment</strong><br />
Additional information on these gravel sources is provided in the <strong>Knik</strong> <strong>Arm</strong> Crossing<br />
Gravel Findings Technical Report (KABATA 2006m).<br />
• East bluff <strong>and</strong> Anchorage alternatives. The upper part of the 70-foot-high bluff near the<br />
east end of the proposed bridge contains about 20 feet of interbedded s<strong>and</strong>, gravel, <strong>and</strong><br />
peat associated with Elmendorf Moraine, which is underlain by s<strong>and</strong> <strong>and</strong> clay of the<br />
Bootlegger Cove Formation. The bluffs along the proposed Below-the-Bluff Roadway <strong>and</strong><br />
Government Hill contain 20 to 85 feet of outwash s<strong>and</strong>s <strong>and</strong> gravels from the Naptowne<br />
Glaciation, underlain by the Bootlegger Cove Formation (KABATA 2006j, 2006n; Updike<br />
<strong>and</strong> Carpenter 1986). The sensitive clay unit of the Bootlegger Cove Formation occurs<br />
between about mean sea level <strong>and</strong> 50 feet in elevation along the <strong>Knik</strong> <strong>Arm</strong> <strong>and</strong> Ship Creek<br />
bluffs (Updike <strong>and</strong> Carpenter 1986). Surficial deposits in Ship Creek valley consist of up<br />
to 25 feet of gravelly s<strong>and</strong> alluvium underlain by Bootlegger Cove silty clay<br />
(KABATA 2006n).<br />
<strong>Knik</strong> <strong>Arm</strong> subsurface sediment<br />
Like the deposits onshore, geologic units beneath <strong>Knik</strong> <strong>Arm</strong> mostly resulted from successive<br />
periods of glaciation, leaving behind a complex mix of Quaternary till, moraine, outwash,<br />
<strong>and</strong> marine deposits that exhibit limited lateral continuity (Figure 3.27). Deposits from the<br />
<strong>Knik</strong> <strong>and</strong> Naptowne Glaciations extend partially or completely beneath <strong>Knik</strong> <strong>Arm</strong>, <strong>and</strong> are<br />
overlain by younger marine s<strong>and</strong>. These deposits have been divided into four units in<br />
geotechnical studies completed in 2004 for the proposed KAC project. From roughly<br />
youngest to oldest, they include:<br />
• Marine s<strong>and</strong>. Shannon & Wilson (KABATA 2006j) indicate the presence of up to 40 feet<br />
of loose to medium-dense marine s<strong>and</strong> at the seafloor surface across much of the crossing.<br />
Locally, these deposits thin on the east side of <strong>Knik</strong> <strong>Arm</strong> to less than 10 or 15 feet, are<br />
very thin or absent in the deepest part of the channel, <strong>and</strong> are absent on the west side. The<br />
s<strong>and</strong>s are somewhat mobile <strong>and</strong> tend to shift over time with changing currents <strong>and</strong> tides.<br />
This deposit likely formed during the Holocene sea level rise as sediments were deposited<br />
on top of the eroded Bootlegger Cove Formation seaward of the <strong>Knik</strong> <strong>Arm</strong> bluffs.<br />
• Glacial till or moraine deposits. A very dense glacial till-type of deposit underlies the<br />
marine s<strong>and</strong> on the west <strong>and</strong> east sides of <strong>Knik</strong> <strong>Arm</strong>, <strong>and</strong> appears to have been eroded<br />
away in the center of the channel. This unit extends into both bluffs <strong>and</strong> may be the<br />
equivalent of <strong>Knik</strong> Glaciation deposits on the west side of <strong>Knik</strong> <strong>Arm</strong> <strong>and</strong> the lower<br />
Bootlegger Cove Formation on the east side (MSB 1995a; KABATA 2006j; Updike <strong>and</strong><br />
Carpenter 1986).<br />
• Glacial lake clays or marine/alluvial s<strong>and</strong>s. A thick section of glacial lake clays <strong>and</strong><br />
marine/alluvial s<strong>and</strong>s underlie the till unit on the sides of <strong>Knik</strong> <strong>Arm</strong> <strong>and</strong> beneath the loose<br />
marine deposits in midchannel. This unit is thin or absent near the west bluff, thickens to<br />
over 200 feet of dense s<strong>and</strong> beneath the <strong>Knik</strong> <strong>Arm</strong> main channel, <strong>and</strong><br />
12/18/07 3-113
<strong>Knik</strong> <strong>Arm</strong> Crossing DraftFinal EIS<br />
<strong>Affected</strong> <strong>Environment</strong><br />
Figure 3.27. <strong>Knik</strong> <strong>Arm</strong> geologic cross section<br />
3-114 12/18/07
<strong>Knik</strong> <strong>Arm</strong> Crossing DraftFinal EIS<br />
<strong>Affected</strong> <strong>Environment</strong><br />
transitions into a massive, very stiff-to-hard, silty clay beneath the east side of <strong>Knik</strong> <strong>Arm</strong><br />
(Figure 3.27). The transition from s<strong>and</strong> to clay near the east side may be of an<br />
interfingering nature, or the s<strong>and</strong> unit may postdate the clay unit (Golder Associates 2003,<br />
KABATA 2006j). The latter interpretation is plausible in light of the likely origin of the<br />
submerged canyon (Cairn Point Trench) to the south, which lies at nearly the same<br />
elevation as the base of the s<strong>and</strong> unit. If the canyon is an erosional remnant of the late<br />
Pleistocene lower sea level st<strong>and</strong>, the s<strong>and</strong> unit may represent alluvium <strong>and</strong> marine s<strong>and</strong><br />
filling the canyon as the sea level rose, <strong>and</strong> the interfingering part belongs to the older<br />
Bootlegger Cove Formation. It is also possible that the submerged bench at the head of the<br />
canyon (the only location where interfingering layers have been encountered) represents<br />
an early Holocene l<strong>and</strong>slide deposit that slumped along a former east side bluff during a<br />
lower sea level.<br />
• <strong>Knik</strong> tills. The deepest unit encountered in borings beneath <strong>Knik</strong> <strong>Arm</strong> is predominantly a<br />
hard, gravelly, s<strong>and</strong>y clay that may be a glacial till deposit associated with the <strong>Knik</strong><br />
Glaciation (KABATA 2006j).<br />
L<strong>and</strong>slide deposits<br />
Numerous l<strong>and</strong>slide deposits occur along the <strong>Knik</strong> <strong>Arm</strong> <strong>and</strong> Ship Creek bluffs:<br />
• <strong>Knik</strong> <strong>Arm</strong> Crossing – West Bluff. The west bluff area is characterized by numerous<br />
shallow slump deposits as well as mud flows in the fine-grained units caused by spring<br />
seepage at the interface between the lower s<strong>and</strong>y clay unit <strong>and</strong> the upper coarse-grained<br />
deposits (KABATA 2006n).<br />
• <strong>Knik</strong> <strong>Arm</strong> Crossing – East Bluff. The bluffs at the east end of the proposed Southern<br />
Alignment <strong>and</strong> south to the POA exhibit multiple ravines, slough material, <strong>and</strong> localized<br />
slump deposits (KABATA 2006j, 2006n). The proposed alignment east of the POA <strong>and</strong><br />
north of Government Hill would cross the toe of a 1964 earthquake-triggered deposit<br />
known as the Elmendorf l<strong>and</strong>slide, about 0.25 mile north of Government Hill, as well as<br />
older l<strong>and</strong>slide material consisting of wet, soft-to-loose, intermixed silts, clays, <strong>and</strong> s<strong>and</strong>s<br />
near the toe of the slope (KABATA 2006j, 2006n; Updike <strong>and</strong> Carpenter 1986).<br />
• Anchorage approach alternatives. The Degan Alternative would cross primarily older<br />
l<strong>and</strong>slide material along the north bluff of Ship Creek. The Erickson Alternative would<br />
cross a 1964 earthquake-triggered deposit known as the Government Hill Elementary<br />
School slide consisting of jumbled blocks that rotated along Bootlegger Cove clays <strong>and</strong><br />
slurry flow material at the slide toe (Shannon & Wilson 1964, KABATA 2006n; Updike<br />
<strong>and</strong> Carpenter 1986). Both alternatives cross a 1964 l<strong>and</strong>slide deposit at the south bluff of<br />
Ship Creek known as the First Avenue Slide (Shannon & Wilson 1994, 2005).<br />
Artificial fill<br />
A series of l<strong>and</strong>fill deposits are located between Cairn Point <strong>and</strong> the POA. Elmendorf<br />
operated a surface dump at the top of the bluff in this area in the 1940s <strong>and</strong> 1950s, <strong>and</strong> debris<br />
from the l<strong>and</strong>fill slumped down slope onto the beach. There are multiple locations along the<br />
base of the bluff where debris is visible <strong>and</strong> being eroded by tidal action (KABATA 2006j).<br />
12/18/07 3-115
<strong>Knik</strong> <strong>Arm</strong> Crossing DraftFinal EIS<br />
<strong>Affected</strong> <strong>Environment</strong><br />
A large extent of the tidal flats in the POA area is covered with 3 to 10 feet of fill introduced<br />
into the area for more than 70 years. The fill is generally composed of aggregate from nearby<br />
borrow pits in glaciofluvial or floodplain deposits. Following the 1964 earthquake, some<br />
l<strong>and</strong>slide debris was hauled to the tidal flats as part of reconstruction, laid down in 1.5- to<br />
3-foot-thick layers, <strong>and</strong> graded <strong>and</strong> compacted (KABATA 2006j, Updike <strong>and</strong><br />
Carpenter 1986).<br />
Tidel<strong>and</strong> sediment<br />
<strong>Knik</strong> <strong>Arm</strong> contains several types of bottom sediment, distinguished by transport processes<br />
<strong>and</strong> elevation. These include lower <strong>and</strong> upper active tidel<strong>and</strong>s, dry mud flats, <strong>and</strong> small<br />
drainage channels (Bartsch-Winkler 1982; Colonell <strong>and</strong> Jones 1990). Lower tidel<strong>and</strong>s consist<br />
primarily of s<strong>and</strong> with occasional gravel deposited under fast tidal current conditions, while<br />
upper tidel<strong>and</strong>s or mud flats consist of finer sediments such as s<strong>and</strong>y silt <strong>and</strong> clays deposited<br />
by settlement <strong>and</strong> flocculation during high tides. In the vicinity of the proposed Southern<br />
Alignment <strong>and</strong> Cairn Point, there is little-to-no settlement of fines occurring because of<br />
currents <strong>and</strong> turbulence that keep finer sediments in suspension in this narrow part of <strong>Knik</strong><br />
<strong>Arm</strong> (Smith 2005). Upper tidel<strong>and</strong>s deposits are also thin-to-absent south of Cairn Point<br />
where geotechnical borings have encountered mostly stiff-to-hard clays at the surface<br />
(KABATA 2006j), which are likely part of the older Bootlegger Cove Formation. At Port<br />
MacKenzie dock, however, suspended sediment is being deposited on both the north <strong>and</strong><br />
south sides of the structure, as both ebb <strong>and</strong> flood tidal currents slow around the dock<br />
(Aeromap 2001, 2002). A surficial deposit of gravel <strong>and</strong> boulders lies along the eastern shore<br />
of the Southern Alignment, apparently associated with active erosion of morainal till in the<br />
eastern bluffs (Golder Associates 2003; KABATA 2006j).<br />
3.5.3.1.3 Surface soils<br />
Surface soil types <strong>and</strong> building suitability in the Study Area have been by mapped by NRCS<br />
(1998, 2001) <strong>and</strong> are depicted on Figures 3.28 <strong>and</strong> 3.29, respectively, <strong>and</strong> summarized<br />
below.<br />
Mat-Su approach alternatives<br />
Soils along the northern part of the Upper Point MacKenzie Road consist primarily of<br />
Kashwitna series silt loam on glaciofluvial outwash plains <strong>and</strong> hills (Figure 3.28). These soils<br />
are typically well-drained <strong>and</strong> consist of up to 1.5 feet of silt loam over gravelly s<strong>and</strong>.<br />
Associated with the Point MacKenzie Agricultural Area, present uses of these soils include<br />
cropl<strong>and</strong>, hayl<strong>and</strong>, pasturel<strong>and</strong>, homesites, <strong>and</strong> wildlife habitat (NRCS 1998).<br />
Soils along the southern part of the Upper Point MacKenzie Road <strong>and</strong> the proposed Northern<br />
Access <strong>and</strong> Point MacKenzie Road Alternatives consist of a mixture of well-drained<br />
Chilligan, Estelle, <strong>and</strong> Kichatna-Delyndia series soils <strong>and</strong> poorly drained Cryaquepts,<br />
Histosols, <strong>and</strong> Disappoint series soils. The well-drained soil types are mostly composed of<br />
s<strong>and</strong>y silt loam, while the poorly drained types consist of wet mucky silt loam <strong>and</strong> peat. All<br />
of these are derived from the glaciofluvial <strong>and</strong> glaciolacustrine plains, hills,<br />
3-116 12/18/07
<strong>Knik</strong> <strong>Arm</strong> Crossing DraftFinal EIS<br />
<strong>Affected</strong> <strong>Environment</strong><br />
Figure 3.28. Study Area soil types<br />
12/18/07 3-117
<strong>Knik</strong> <strong>Arm</strong> Crossing DraftFinal EIS<br />
<strong>Affected</strong> <strong>Environment</strong><br />
Figure 3.29. Soil suitability for building – the Mat-Su<br />
3-118 12/18/07
<strong>Knik</strong> <strong>Arm</strong> Crossing DraftFinal EIS<br />
<strong>Affected</strong> <strong>Environment</strong><br />
<strong>and</strong> depressions left behind by the Naptowne Glaciation. Present use of these areas is<br />
primarily for wildlife habitat, with minor homesite use in the more well-drained soil zones. In<br />
addition, Kichatna-Delyndia soils are used as a s<strong>and</strong> <strong>and</strong> gravel source (NRCS 1998).<br />
NRCS soils data related to soil suitability for building (1998) incorporate the effects of<br />
wetness, ponding, low strength, frost action, <strong>and</strong> slopes into categories ranging from slightly<br />
to severely limiting for this purpose (Figure 3.29). Soils on the west side of Burma <strong>and</strong> Upper<br />
Point MacKenzie Roads, including those associated with the Point MacKenzie Agricultural<br />
Area, exhibit some of the best conditions for construction of homesites <strong>and</strong> small commercial<br />
buildings. Soils along the east side of <strong>Knik</strong>-Goose Bay Road have similar building suitability<br />
ratings. Soils in the remaining areas are rated as having moderate-to-severely limiting<br />
building suitability characteristics, largely because of the presence of wet hydric soils <strong>and</strong><br />
low-strength peats <strong>and</strong> mucks.<br />
Anchorage approach alternatives<br />
Soils mapped along the steep slopes of <strong>Knik</strong> <strong>Arm</strong> <strong>and</strong> Ship Creek are composed of well<br />
drained Smithfa, Deception-Estelle-Kichatna, <strong>and</strong> Kashwitna-Kichatna complex s<strong>and</strong>y silt<br />
loams derived from gravelly till, outwash alluvium, <strong>and</strong> eolian deposits. In addition to soils<br />
on urban l<strong>and</strong>s, the soils of Government Hill <strong>and</strong> the Ship Creek terraces are classified as<br />
Cryorthents. Cryorthents typically consist of very well-drained gravelly s<strong>and</strong>y loam derived<br />
from glacial outwash. Soils in Ship Creek bottom consist of poorly-to-moderately welldrained<br />
Moose River-Niklason complex derived from alluvium parent material<br />
(NRCS 2001).<br />
3.5.3.2 Seismic hazards<br />
3.5.3.2.1 Seismicity <strong>and</strong> ground shaking<br />
The Study Area is located in one of the most tectonically active regions of the world. The<br />
Upper Cook Inlet basin is characterized by numerous potentially active fault-cored folds<br />
located in between two major linear faults (Figure 3.30) <strong>and</strong> underlain by the subduction<br />
zone between the North American <strong>and</strong> Pacific plates. Historical seismicity in the region has<br />
come from several sources:<br />
• Megathrust <strong>and</strong> deeper earthquakes associated with the subduction zone, such as the<br />
1964 Alaska earthquake of magnitude 9.2 on the Richter scale.<br />
• Strike-slip earthquakes associated with the surficial transform boundary between plates,<br />
such as the Denali <strong>and</strong> Castle Mountain faults.<br />
• Shallow crustal earthquakes within the upper North American Plate, such as those which<br />
may be associated with the smaller structures on Figure 3.30. These are considered to be<br />
capable of earthquakes in the range of magnitude 6 to 7 (Crouse 2005; Haeussler et<br />
al. 2000; Martirosyan <strong>and</strong> Biswas 2004; KABATA 2006j).<br />
12/18/07 3-119
<strong>Knik</strong> <strong>Arm</strong> Crossing DraftFinal EIS<br />
<strong>Affected</strong> <strong>Environment</strong><br />
Figure 3.30. Regional potentially active faults <strong>and</strong> fault-cored folds<br />
3-120 12/18/07
<strong>Knik</strong> <strong>Arm</strong> Crossing DraftFinal EIS<br />
<strong>Affected</strong> <strong>Environment</strong><br />
Earthquake ground shaking hazards depend on earthquake magnitude, probability of<br />
occurrence (return period), <strong>and</strong> soil type. Several site-specific probabilistic seismic hazard<br />
analyses have been conducted for this Draft EIS to assess ground shaking hazards under local<br />
soil conditions <strong>and</strong> the relative potential contributions from different faults. The results of<br />
these analyses indicate that both deep subduction zone earthquakes <strong>and</strong> more nearby shallow<br />
crustal earthquakes would be the most significant sources of seismic hazard to the proposed<br />
project (Crouse 2005; Martirosyan <strong>and</strong> Biswas 2004, 2005). Detailed results of these<br />
analyses, including ground accelerations predicted by the different earthquake models for<br />
various return periods <strong>and</strong> soil types, are provided in the <strong>Knik</strong> <strong>Arm</strong> Crossing Seismic Studies<br />
Technical Report (KABATA 2006j).<br />
3.5.3.2.2 Surface faults<br />
No active surface faults are known to cross the proposed KAC alternatives. The closest<br />
potentially active surface fault to the Study Area is the Little Susitna River Scarp fault,<br />
located about 7 miles west of the Mat-Su alignments (Figure 3.30). This fault is suspected of<br />
offsetting late Pleistocene deposits (Plafker et al. 1993).<br />
Near-surface folding <strong>and</strong> reverse faulting of Tertiary <strong>and</strong> Quaternary strata are suspected to<br />
be actively occurring throughout the Cook Inlet basin (Haeussler et al. 2000). Several of the<br />
fault-cored folds along the west side of Upper Cook Inlet exhibit evidence of active<br />
deformation of the seafloor or ground surface in this area. A similar fold was mapped along<br />
the west side of <strong>Knik</strong> <strong>Arm</strong> <strong>and</strong> crosses the Mat-Su alternatives, referred to as the Lorraine-<br />
Alaska Gulf fold (Haeussler et al. 2000; Magoon et al. 1976). Based on its similarity to other<br />
well-studied features in Cook Inlet basin, it is possible that it could represent the site of nearsurface<br />
active folding or reverse faulting.<br />
3.5.3.2.3 Ground failure <strong>and</strong> liquefaction<br />
Earthquakes cause ground shaking that can result in ground failure <strong>and</strong> structural damage or<br />
loss. Ground failure in the event of a major earthquake can take several forms, such as<br />
l<strong>and</strong>sliding, surface cracking, l<strong>and</strong> spreading, liquefaction, <strong>and</strong> subsidence. Winterhalder et<br />
al. (1979) <strong>and</strong> the Municipality of Anchorage (2001a) mapped the relative potential for<br />
seismically induced ground failure in the Anchorage area based on a combination of the<br />
above causes <strong>and</strong> localized ground conditions (Figure 3.31). The Below-the-Bluff Roadway<br />
portion of the proposed KAC project <strong>and</strong> the Anchorage approach alternatives each cross<br />
areas of high-to-very high predicted ground failure (predictions based largely on the potential<br />
for translational l<strong>and</strong>sliding).<br />
Liquefaction generally occurs during earthquakes in loose, saturated s<strong>and</strong>s <strong>and</strong> silty s<strong>and</strong>s,<br />
because of the rapid buildup of pore water pressure <strong>and</strong> resulting loss of strength <strong>and</strong> bearing<br />
capacity. Although most clay deposits typically have little-to-no liquefaction potential,<br />
sensitive clays (also known as quick clays) such as those within the Bootlegger Cove<br />
Formation (Section 3.5.3.1.2), can also produce an effect similar to liquefaction during an<br />
earthquake (Hungr et al. 2001; Noson et al. 1988). Failure of the Bootlegger Cove sensitive<br />
clays <strong>and</strong> resulting translational l<strong>and</strong>sliding during the 1964 earthquake are<br />
12/18/07 3-121
<strong>Knik</strong> <strong>Arm</strong> Crossing DraftFinal EIS<br />
<strong>Affected</strong> <strong>Environment</strong><br />
Figure 3.31. Earthquake-induced ground failure hazards – Anchorage<br />
3-122 12/18/07
<strong>Knik</strong> <strong>Arm</strong> Crossing DraftFinal EIS<br />
<strong>Affected</strong> <strong>Environment</strong><br />
discussed further in Section 3.5.3.2.4. S<strong>and</strong>y deposits above the Bootlegger Cove Formation<br />
are also potentially liquefiable where saturated from a perched aquifer (Updike <strong>and</strong><br />
Carpenter 1986).<br />
The loose-to-medium-dense marine s<strong>and</strong>s encountered across much of <strong>Knik</strong> <strong>Arm</strong> have the<br />
highest liquefaction potential along the proposed bridge alignment. Several deep samples in<br />
older deposits beneath the marine s<strong>and</strong>s were also determined to be liquefiable; these soils,<br />
however, are isolated within liquefaction-stable deposits. Little to no silty s<strong>and</strong> was<br />
encountered at the surface along the Below-the-Bluff Roadway (KABATA 2006j). During<br />
the 1964 earthquake, there were numerous examples of ground fissuring, lateral spreading,<br />
<strong>and</strong> slumping in the tidal flats offshore of the Government Hill area, but little evidence of<br />
liquefaction features such as s<strong>and</strong> boils or s<strong>and</strong>-filled fissures. The potential for liquefaction<br />
also exists in the bluffs along <strong>Knik</strong> <strong>Arm</strong> where s<strong>and</strong>s above the fine-grained Bootlegger Cove<br />
Formation may be saturated from a perched aquifer (Updike <strong>and</strong> Carpenter 1986).<br />
3.5.3.2.4 Slope stability<br />
The bluffs along <strong>Knik</strong> <strong>Arm</strong> have been the sites of major catastrophic earthquake-induced<br />
l<strong>and</strong>slides in the past, <strong>and</strong> similar l<strong>and</strong>slides are likely to occur in the future. The ability of<br />
slopes to remain stable is continually altered by many geologic <strong>and</strong> man-made processes.<br />
Both the west <strong>and</strong> east bluffs of <strong>Knik</strong> <strong>Arm</strong> are in a state of marginal stability, because erosion<br />
from tides <strong>and</strong> currents are slowly cutting away the toes <strong>and</strong> slopes at an estimated rate of<br />
about 0.5 foot per year (KABATA 2006n). While the west bluff exhibits evidence of active<br />
slumping <strong>and</strong> mud flows, it is not known whether the sensitive clay unit of the Bootlegger<br />
Cove Formation extends to this area; thus, the likelihood of large-scale translational<br />
l<strong>and</strong>sliding during an earthquake is unknown.<br />
The steep bluffs bordering the east side of <strong>Knik</strong> <strong>Arm</strong> <strong>and</strong> Ship Creek have been mapped by<br />
Dobrovolny <strong>and</strong> Schmoll (1974) as having mostly low-to-very low stability. The<br />
1964 Elmendorf <strong>and</strong> Government Hill Elementary School slides are mapped as having<br />
moderate stability because of the lower angles of the previously failed slopes. The <strong>Knik</strong> <strong>Arm</strong><br />
bluffs from about 1 mile north of Cairn Point to Government Hill, as well as the Ship Creek<br />
bluffs, are mapped as having potentially large earthquake-triggered l<strong>and</strong>slide risk because of<br />
the presence of the Bootlegger Cove sensitive clay unit in the lower parts of the bluffs<br />
(Dobrovolny <strong>and</strong> Schmoll 1974; Updike <strong>and</strong> Carpenter 1986).<br />
3.5.4 Hazardous Materials <strong>and</strong> Contaminated Sites<br />
An Initial Site Assessment (ISA) was prepared for the Study Area to determine the potential<br />
for encountering petroleum, oil, <strong>and</strong> lubricants (POL)-contaminated sites or hazardous<br />
materials if construction <strong>and</strong> operation of the proposed KAC project were to occur. The<br />
objective of the ISA process is to evaluate, based on readily available information, whether<br />
there are likely to be hazardous materials or petroleum products along the proposed project<br />
alternatives or whether such materials or products would be likely to exist in the future<br />
because of on-site or nearby activities or problems. Hazardous materials include ordnance<br />
12/18/07 3-123
<strong>Knik</strong> <strong>Arm</strong> Crossing DraftFinal EIS<br />
<strong>Affected</strong> <strong>Environment</strong><br />
<strong>and</strong> explosives (OE) <strong>and</strong> soil <strong>and</strong> ground water contamination from leaking underground<br />
storage tanks, aboveground storage tanks, pesticides, <strong>and</strong> other chemical discharges.<br />
The ISA was prepared in general accordance with corridor screening guidelines as defined by<br />
the American Association of State Highway <strong>and</strong> Transportation Officials in Hazardous<br />
Waste Guide for Project Development (1990) <strong>and</strong> FHWA guidance documents on hazardous<br />
materials (FHWA 1980).<br />
Known <strong>and</strong> potential hazardous material sites in the Study Area were identified through<br />
review of federal <strong>and</strong> State databases, agency interviews, aerial photography, <strong>and</strong> site visits.<br />
Also, readily available information regarding known contaminated sites on Elmendorf was<br />
obtained from Internet databases <strong>and</strong> other information repositories. Identification of<br />
minimum search distances <strong>and</strong> the types of databases required for review were based on<br />
ASTM International’s St<strong>and</strong>ard E 1527-00, “St<strong>and</strong>ard Practice for Phase I <strong>Environment</strong>al<br />
Site Assessment Process” (2000). Initially, all contaminated sites listed in federal <strong>and</strong> State<br />
databases within 0.5 mile of the proposed alternatives were identified.<br />
For the purposes of investigating hazardous materials concerns, the Study Area was defined<br />
as the area within 100 feet of the outer limits of the ROW for the proposed alternatives. The<br />
Study Area has been organized into three subareas, from west to east:<br />
• the Mat-Su approach alternatives between the Burma Road intersection <strong>and</strong> the west<br />
shore of <strong>Knik</strong> <strong>Arm</strong> (includes the Point MacKenzie Road <strong>and</strong> the Northern Access<br />
Alternatives)<br />
• the two Southern Alignment bridge lengths across <strong>Knik</strong> <strong>Arm</strong> 28<br />
• Anchorage approach alternatives (includes the Degan <strong>and</strong> Erickson Alternatives).<br />
In the ISA, the Study team rated each known <strong>and</strong> potential hazardous material location for its<br />
potential to affect the project. The Study Team rated the sites as having a high, medium, low,<br />
or negligible impact risk. High- <strong>and</strong> medium-impact risk ratings were assigned to known or<br />
potentially contaminated sites that could cause contamination of property within 100 feet of<br />
the proposed ROWs. High- <strong>and</strong> medium-impact risk-rated sites are presented below for each<br />
of the Study Area subareas.<br />
3.5.4.1 Mat-Su approach alternatives<br />
Based on the ISA screening process, no hazardous waste or contaminated sites were located<br />
within the KAC Study Area for either the Point MacKenzie Road or Northern Access<br />
Alternatives. However, both the Point MacKenzie Road <strong>and</strong> Northern Access Alternatives<br />
would directly affect the Former Susitna Gunnery Range (FSGR). Except for approximately<br />
1 mile at the northern terminus of the Study Area, all of the Mat-Su approach alternatives<br />
would be within the former FSGR. The 86,570-acre FSGR is located northwest of Elmendorf<br />
28 The 14,000-foot bridge length was found to not be financially feasible <strong>and</strong> did not meet Purpose <strong>and</strong> Need<br />
criteria, however, this alternative was carried forward solely for comparative evaluation based on requests<br />
from environment resource <strong>and</strong> permitting agencies.<br />
3-124 12/18/07
<strong>Knik</strong> <strong>Arm</strong> Crossing DraftFinal EIS<br />
<strong>Affected</strong> <strong>Environment</strong><br />
<strong>and</strong> was used as an impact area <strong>and</strong> buffer zone for 90- <strong>and</strong> 120-millimeter antiaircraft<br />
artillery training from 1952 to 1960. The range extends as far west as the Little Susitna River<br />
<strong>and</strong> north to the town of Willow. Most of the Mat-Su portion of the Study Area is located<br />
within the firing fan (see Figure 4.19), with the exception of Point MacKenzie Road, near the<br />
Burma Road intersection. The U.S. <strong>Arm</strong>y Corps of Engineers (USACE) has completed an<br />
initial data archive review of the FSGR. A copy of the USACE archive report is included as<br />
Appendix B of the ISA. USACE timelines for completing assessment <strong>and</strong> potential<br />
unexploded ordnance (UXO) removal at the FSGR extend beyond 2010. OE are known to<br />
have been used within the KAC Study Area. Additionally, UXO has been verified in two of<br />
the USACE study areas, which are areas that could be affected by construction <strong>and</strong> operation<br />
of either the Point MacKenzie Road Alternative or the Northern Access Alternative. Property<br />
that would be affected by implementation of the proposed Mat-Su approach alternatives has<br />
been assigned a high-impact risk rating for OE.<br />
3.5.4.2 Southern Alignment<br />
The Southern Alignment includes the Study Area between the bluffs, including the west <strong>and</strong><br />
east bridge approaches, the bridge, <strong>and</strong> the Below-the-Bluff Roadway alignment along the<br />
northwest coast of Anchorage that terminates near the POA. There is no difference between<br />
the two lengths from a hazardous materials or UXO involvement perspective. The western<br />
bridge abutment on the Mat-Su side of the project would be within the FSGR OE impact<br />
area. Therefore, the issues discussed previously for the two Mat-Su build alternatives would<br />
also be applicable to the western extent of the Southern Alignment. No assessment was<br />
completed by USACE to determine the presence of UXO within <strong>Knik</strong> <strong>Arm</strong>. Therefore, the<br />
UXO risk to the in-water bridge support pilings is unknown, but this risk would be expected<br />
to be low.<br />
The Below-the-Bluff Roadway alignment would parallel Elmendorf, which is a<br />
U.S. <strong>Environment</strong>al Protection Agency (USEPA) National Priority List (NPL) site because<br />
of various environmental contamination issues related to ongoing <strong>and</strong> former military<br />
activity at the U.S. Air Force (USAF) installation. The Below-the-Bluff Roadway would<br />
come within 0.5 mile of three known Elmendorf contaminated sites (Sites LF04, WP14,<br />
<strong>and</strong> ST41, shown on Figure 4.20 <strong>and</strong> discussed in Section 4.5.4). <strong>Environment</strong>al <strong>and</strong><br />
remediation studies by USAF have been completed at each of the three sites.<br />
3.5.4.3 Anchorage approach alternatives<br />
3.5.4.3.1 Degan Alternative<br />
Phase 1<br />
The following seven paragraphs describe sites that would affect the proposed Degan<br />
Alternative for Phase 1. Preliminary Site Investigations (PSIs) are recommended (see Table 2<br />
in the Initial Site Assessment Technical Report [KABATA 2006o]) at all seven sites to<br />
further define the potential ROW impacts for the alternative.<br />
12/18/07 3-125
<strong>Knik</strong> <strong>Arm</strong> Crossing DraftFinal EIS<br />
<strong>Affected</strong> <strong>Environment</strong><br />
Site OT92 – Ab<strong>and</strong>oned Hydrant Lines – Medium Impact<br />
This site consists of former hydrant fuel lines associated with operations at Elmendorf (see<br />
Figure 4.21). No comprehensive investigations have occurred to date, but investigations are<br />
planned for 2007. The planned closure date is October 31, 2010 (USAF 2001). The primary<br />
concern with this site is the potential for undocumented petroleum hydrocarbon impacts from<br />
past leaks. This site was assessed as having a medium-impact risk to the project based on the<br />
possibility of petroleum contamination migrating from the site to the project search corridors.<br />
Site PL81 – POL Pipelines 81 – High Impact<br />
Site PL81, a CERCLA NPL site, crosses the Anchorage approach alternatives <strong>and</strong> is the site<br />
of ab<strong>and</strong>oned POL lines that began at the POA fuel distribution system <strong>and</strong> terminated north<br />
of the east/west runway on Elmendorf (see Figure 4.21). The 10-inch jet fuel <strong>and</strong> aviation gas<br />
pipelines were damaged in the 1964 earthquake <strong>and</strong> ab<strong>and</strong>oned shortly thereafter. To address<br />
the remaining soil <strong>and</strong> groundwater contamination at the site, an environmental Cleanup<br />
Plan 2005 was developed in cooperation with the ADEC to remove contaminated soil<br />
(ADEC 2005a). Additional excavations are planned for the area. PL81 could affect the<br />
project if contaminated soil were found to exist within the proposed project search corridors.<br />
This site was assessed as having a high-impact risk to the project because of known fuel<br />
contamination associated with the line <strong>and</strong> because the alignment would directly cross the<br />
site.<br />
Site SD52 – Cherry Hill Ditch/Ravine – Medium Impact<br />
Elmendorf site SD52, also known as the Cherry Hill Ditch or Ravine, would be crossed by<br />
both the proposed Erickson <strong>and</strong> Degan Alternatives north of the proposed cut-<strong>and</strong>-cover<br />
tunnel (see Figure 4.21). SD52 is a CERCLA site <strong>and</strong>, in 1994, low levels of polychlorinated<br />
biphenyls (PCBs) were capped in the ditch. The ditch begins on Elmendorf <strong>and</strong> crosses<br />
perpendicular to the ROW corridor before reaching its terminus at the POA. The drainage<br />
ditch receives stormwater drainage from under the runway <strong>and</strong> possibly from shop drains on<br />
Base. Hydrocarbons, solvents, oils, <strong>and</strong> detergents are present. All contaminants have been<br />
dealt with to the extent practicable, <strong>and</strong> no further remedial action is required or planned<br />
(NFRAP 29 ) (ADEC 2005a). However, an NFRAP does not indicate that the site contaminants<br />
have been removed, only that the regulating agencies require no additional cleanup based on<br />
existing l<strong>and</strong> use. Impacts on the area during construction would require management of<br />
contaminated soils. Additionally, if controlled-access ROW were acquired through the area,<br />
the new property owner might be exposed to future environmental liability issues, depending<br />
on the agreements made with the responsible party. This site was assessed as having a<br />
medium-impact risk to the project because the alignment would directly affect the site <strong>and</strong><br />
because there is the possibility that residual contamination exists.<br />
29 NFRAP, or “No Further Remedial Action Planned” sites, are sites that have been removed from the<br />
CERCLIS list by USEPA. These sites are no longer considered a federal concern. Suspected hazardous waste<br />
sites throughout the United States are listed in the Comprehensive <strong>Environment</strong>al Response, Compensation<br />
<strong>and</strong> Liability Information System, or CERCLIS. This federal database contains information on preliminary<br />
assessments, potential <strong>and</strong> actual hazardous waste sites, site inspections, <strong>and</strong> cleanup activities. CERCLIS<br />
sites are c<strong>and</strong>idates for addition to the federal <strong>and</strong> state Superfund lists.<br />
3-126 12/18/07
<strong>Knik</strong> <strong>Arm</strong> Crossing DraftFinal EIS<br />
<strong>Affected</strong> <strong>Environment</strong><br />
Site 2 – Tesoro Northstore #10 – High Impact<br />
Site 2 is located at 500 Hollywood Drive (see Figure 4.21). Gasoline <strong>and</strong> diesel<br />
contamination was found during a tank upgrade in 1996, <strong>and</strong> contaminated soil was<br />
excavated <strong>and</strong> thermally treated. Contamination that could not be excavated was treated<br />
using a passive soil vapor extraction system. ADEC issued an NFRAP letter for the site on<br />
February 26, 2003, conditional upon removal of the monitoring wells <strong>and</strong> soil vapor<br />
extraction system (ADEC 2005a). There are three underground storage tanks (USTs),<br />
installed in 1986, which are still in use (ADEC 2005b). The NFRAP determination rather<br />
than an NFA (No Further Action) determination typically indicates that there are still<br />
contaminants present at the site that could be removed but have not been (usually because of<br />
building conflicts). Removing the site structures would result in the new property owner<br />
being responsible for any residual petroleum contamination. Additionally, the site is used as<br />
a commercial gasoline station, <strong>and</strong> undocumented contamination may exist. Therefore, this<br />
site was determined to have a high-impact risk to the project.<br />
Site 15 – Anchorage <strong>Toll</strong> Center – Medium Impact<br />
Site 15 is located at 200 <strong>and</strong> 210 East Bluff Road (see Figure 4.21). Three USTs were<br />
removed from each site <strong>and</strong> soil contamination was reported. Cleanup operations were<br />
completed <strong>and</strong> ADEC issued the site an NFA determination. During the UST work, deeper<br />
contamination that appeared to be from an off-site source was found (ADEC 2005a). Three<br />
10,000-gallon diesel USTs are on the site (ADEC 2005b). The proposed Erickson Alternative<br />
alignment <strong>and</strong> the Degan Alternative off-ramp system would be immediately adjacent to <strong>and</strong><br />
downgradient of this site. Because of the proximity of the site to the proposed project search<br />
corridors for the proposed Erickson <strong>and</strong> Degan Alternatives, the commercial quantities of<br />
fuel in use at the site, <strong>and</strong> the indication of off-site contamination sources, this site was<br />
assigned a medium-impact risk to the project.<br />
Site 36 – Former Unocal/Short’s Texaco – Medium Impact<br />
Site 36 is located at 566 East Bluff Road (see Figure 4.21). Four gasoline USTs were<br />
removed from the site in 1994, <strong>and</strong> soil <strong>and</strong> ground water contamination was discovered. A<br />
soil vapor extraction/bioventing remediation unit was installed in September 2004, <strong>and</strong><br />
remediation <strong>and</strong> ground water monitoring continues at the site. The site is no longer a<br />
commercial gasoline station (ADEC 2005a). Because this site is approximately 50 feet<br />
upgradient from the proposed project search corridor, it would be possible that contaminated<br />
ground water could extend to the project search corridor. Therefore, this site was determined<br />
to have a medium-impact risk to the project.<br />
Site 99 – Defense Fuel Support Point – Anchorage (DFSP-A) – High Impact<br />
Site 99 is a 69-acre property located north of Bluff Drive that would be crossed by either the<br />
proposed Erickson Alternative or the Degan Alternative north of the proposed cut-<strong>and</strong>-cover<br />
tunnel (see Figure 4.21). Site 99 was formerly used by the U.S. <strong>Arm</strong>y Defense Logistics<br />
Agency (DLA) to store fuel in aboveground storage tanks (ASTs). Available aerial<br />
photographs of the site from 1960 to 1994 show several large ASTs. Soil <strong>and</strong> groundwater<br />
contamination have been documented at the site. The bulk of the soil contamination was<br />
removed in 2001 (ADEC 2005a). The U.S. <strong>Arm</strong>y is responsible for continued monitoring of<br />
contaminated ground water; any purchase of the property through controlled-access ROW<br />
12/18/07 3-127
<strong>Knik</strong> <strong>Arm</strong> Crossing DraftFinal EIS<br />
<strong>Affected</strong> <strong>Environment</strong><br />
acquisition, however, would result in the l<strong>and</strong>owner assuming responsibility for any<br />
contaminated soil encountered in the future. Additionally, management of any contaminated<br />
soil encountered during construction through this site would be the responsibility of the<br />
proposed KAC project proponent (HDR 2004). This property has been assigned a highimpact<br />
rating because contamination has been documented on this property <strong>and</strong> because the<br />
site would be crossed by the proposed Erickson Alternative. This site was assessed as having<br />
a high-impact risk to the project because of known fuel contamination associated with the<br />
site <strong>and</strong> because the proposed ROW would affect a large area of this site.<br />
Phase 2<br />
In Phase 2 of the proposed projected, the area that would be crossed by the Ingra-Gambell<br />
Couplet is one of the original industrial areas in Anchorage. Implementation of the proposed<br />
Ingra-Gambell Couplet could be affected by the following medium- <strong>and</strong> high-impact sites<br />
described below.<br />
Site 5 – Alaskan Real Estate Parking Lot – Medium Impact<br />
Site 5 is located at 717 East 4th Avenue (see Figure 4.21). Soil contaminated with<br />
tetrachloroethylene (PCE) <strong>and</strong> diesel range organics (DRO) was excavated <strong>and</strong> thermally<br />
treated in 2004. PCE-contaminated soil <strong>and</strong> ground water remains on site, <strong>and</strong> studies are<br />
ongoing. This site has been assigned a medium-impact rating because undefined soil <strong>and</strong><br />
ground water contamination remains <strong>and</strong> because the property is in the presumed upgradient<br />
direction of the proposed controlled-access ROW (ADEC 2005a).<br />
Site 14 – Lefever Property – 4th Avenue <strong>and</strong> Ingra Street – High Impact<br />
Site 14 is located at 901 4th Avenue (see Figure 4.21). Ten USTs were removed from this<br />
property in 1989. Soil <strong>and</strong> ground water contamination has been documented, <strong>and</strong> the<br />
contaminated ground water plume extends off site. This site would be upgradient of the<br />
proposed controlled-access ROW <strong>and</strong> has been assigned a high-impact rating because the<br />
property is known to be contaminated (ADEC 2005b).<br />
Within the Ship Creek area, the six sites discussed below were given high-site hazard ratings<br />
because of contamination resulting from PCBs, fuels, heavy metals, solvents, <strong>and</strong> various<br />
other chemicals. It is unlikely that the proposed Degan Alternative or the Erickson<br />
Alternative would, however, directly affect these sites because the proposed elevated viaduct<br />
structures would span the sites <strong>and</strong> the Ship Creek area. In all six cases, it is unlikely that<br />
ROW would be acquired. L<strong>and</strong> within the Anchorage Terminal Reserve needed for viaduct<br />
support structure piers would not likely require controlled-access ROW acquisition (i.e.,<br />
easement, lease). Viaduct support piers should, however, be sited to avoid direct impact to<br />
any of the sites identified. If there were no direct impacts during construction (i.e.,<br />
excavation of soils) or acquisition of any of these properties for controlled-access ROW<br />
purposes, then the risk to the project search corridors would be low for all six sites. All six<br />
sites would require a PSI, <strong>and</strong> the risk to the project search corridors would increase to high<br />
if controlled-access ROW were required or excavation were completed in the area of the six<br />
sites. All six sites are shown on Figure 4.21.<br />
3-128 12/18/07
<strong>Knik</strong> <strong>Arm</strong> Crossing DraftFinal EIS<br />
<strong>Affected</strong> <strong>Environment</strong><br />
Site 6 – Dean’s Auto Salvage<br />
Site 6 is located at 720 East Whitney Road <strong>and</strong> appears on the UST database as McDonald<br />
Industries. Currently, the property is used for an auto salvage yard. Dean’s Auto Salvage is a<br />
RCRA Small Quantity Generator with 12 reported violations. The ADEC UST database<br />
shows that the site formerly had three USTs, but all are listed as permanently out of use.<br />
Acquisition of this parcel for controlled-access ROW purposes or impacts on this site that<br />
might require excavation of potentially contaminated soil would result in an impact risk<br />
rating of high because of the site’s use as a salvage yard <strong>and</strong> the recommendation for a PSI at<br />
the site (ADEC 2005a; ADEC 2005b).<br />
Site 9 – Anchorage ML&P #1<br />
Site 9 is located at 821 East 1st Avenue <strong>and</strong> was the site of a 235,000-gallon diesel spill<br />
during the 1964 earthquake. Soils <strong>and</strong> ground water were contaminated with diesel fuel, <strong>and</strong><br />
subsequent releases occurred on the site including PCBs from electrical equipment. Free<br />
product recovery <strong>and</strong> ground water monitoring is ongoing (ADEC 2005a).<br />
Site 11 – Alaska Railroad Yard Switches<br />
The proposed Ingra-Gambell Viaduct would cross a portion of the Alaska Railroad rail yard<br />
that is part of the Anchorage Terminal Reserve, a Comprehensive <strong>Environment</strong>al Response,<br />
Compensation, <strong>and</strong> Liability Act (CERCLA 30 ) site occupying approximately 313 acres. The<br />
area has been used for fueling, painting, steam cleaning, loading freight onto rail cars, <strong>and</strong><br />
maintenance <strong>and</strong> repair work on locomotives <strong>and</strong> railroad cars (USEPA 2005b). A<br />
1996 RCRA Facility Assessment of the property identified 73 solid waste management units<br />
(SWMUs). USEPA <strong>and</strong> the ARRC, under an Administrative Order on Consent, are<br />
conducting a remedial investigation of the Anchorage Terminal Reserve property. This<br />
generalized site has been assigned a high-impact rating because of past <strong>and</strong> ongoing<br />
industrial uses <strong>and</strong> because commercial quantities of petroleum products have been stored on<br />
site <strong>and</strong> releases have been documented (ADEC 2005a).<br />
Site 13 – Craig Taylor Equipment Company<br />
Site 13 is located at 733 East Whitney Road. Four underground storage tanks were removed<br />
from this property in 1989. Low levels of contamination were found <strong>and</strong> contaminated soil<br />
was l<strong>and</strong>spread. ADEC closed the site in 1993 (ADEC 2005b).<br />
Site 44 – Arctic Cooperage<br />
Site 44 is located at 932 Whitney Road. In 1998, oil-stained soil, paint pools, <strong>and</strong> drums with<br />
unknown contents were documented at the property. The site was an alleged hazardous<br />
dumpsite for oil refining sludge <strong>and</strong> a barrel reconditioning operation from 1977 to 1988.<br />
Remediation <strong>and</strong> studies are ongoing, <strong>and</strong> a diesel UST was removed in 1996<br />
(ADEC 2005a).<br />
30 Commonly known as Superfund, CERCLA was enacted by Congress on December 11, 1980. This law<br />
created a tax on the chemical <strong>and</strong> petroleum industries <strong>and</strong> provided broad federal authority to respond<br />
directly to releases or threatened releases of hazardous substances that may endanger public health or the<br />
environment.<br />
12/18/07 3-129
<strong>Knik</strong> <strong>Arm</strong> Crossing DraftFinal EIS<br />
<strong>Affected</strong> <strong>Environment</strong><br />
Site 48 – Aurora North Fuel Sales<br />
Site 48 is located at 1040 East 1st Avenue. Five USTs <strong>and</strong> 500 cubic yards of contaminated<br />
soil were removed from the property in 1990. Since then, additional contaminated soil has<br />
been removed <strong>and</strong> ground water contamination documented. An NFRAP letter was issued<br />
<strong>and</strong> institutional controls were established in 2004. Ground water monitoring is ongoing <strong>and</strong><br />
contamination is known to extend off site to the north <strong>and</strong> west (toward the project search<br />
corridors) (ADEC 2005a).<br />
3.5.4.3.2 Erickson Alternative<br />
Phase 1<br />
The proposed Erickson Alternative would be affected by the same sites as the Degan<br />
Alternative, primarily because access ramps <strong>and</strong> associated road improvements for the Degan<br />
Alternative would affect Erickson Street. The primary difference is that the cut-<strong>and</strong>-cover<br />
tunnel for the Erickson Alternative would be closer to Sites 2, 15, <strong>and</strong> 36 than the Degan<br />
Alternative tunnel would be.<br />
Phase 2<br />
The proposed Ingra-Gambell Couplet for the Erickson Alternative would affect the same<br />
sites as the Degan Alternative connection to the Ingra-Gambell Couplet.<br />
For specific information on the ISA findings, ISA methodology, <strong>and</strong> identified hazardous<br />
materials sites, refer to the Initial Site Assessment Technical Report (KABATA 2006o).<br />
3.5.5 Energy Resources<br />
There are currently no commercially feasible energy resources in the Study Area. Table 4-35,<br />
in Section 4.5.5.4, shows expected 2010 vehicular fuel consumption for the Study Area under<br />
the No-Action Alternative.<br />
3.5.6 Ground Water Resources<br />
3.5.6.1 The Mat-Su<br />
Aquifers in the Mat-Su area are primarily situated within glacial till, glacial outwash, <strong>and</strong><br />
fluvial deposits overlying sedimentary <strong>and</strong> low-grade metamorphic bedrock. Glacial deposit<br />
aquifers have been described as “irregular in distribution <strong>and</strong> highly variable both in<br />
composition <strong>and</strong> in their ability to provide water to wells” (Brabets 1999). Both confined <strong>and</strong><br />
unconfined aquifers provide potable water throughout the Study Area.<br />
A single source of regional ground water resource information for the western portion of the<br />
Mat-Su is not currently summarized or available, although USGS is in the process of<br />
compiling a regional hydrogeologic map of the Mat-Su. 31 Existing ground water data within<br />
the Study Area were compiled from the Point MacKenzie, Houston, Big Lake, <strong>and</strong> the<br />
31 Personal communication, Ted Moran, USGS, with Elizabeth Shen, November 21, 2005.<br />
3-130 12/18/07
<strong>Knik</strong> <strong>Arm</strong> Crossing DraftFinal EIS<br />
<strong>Affected</strong> <strong>Environment</strong><br />
southern Wasilla areas, in addition to information from the State of Alaska’s on-line wells<br />
database (KABATA 2006l). Table 3-20 summarizes the number of wells identified within<br />
the Study Area.<br />
Table 3-20. Number of wells within the Study Area, located<br />
by township <strong>and</strong> range a<br />
Township –<br />
north<br />
Range –<br />
west<br />
Number of wells<br />
14 4 17<br />
15 4 17<br />
16 4 28<br />
17 4 94<br />
17 3 446<br />
16 3 79<br />
15 3 6<br />
14 5 3<br />
15 5 23<br />
15 5 6<br />
16 5 1<br />
Total 720<br />
a<br />
Alaska Department of Natural Resources Well Log Tracking System<br />
(ADNR 2005)<br />
3.5.6.1.1 Ground water quality <strong>and</strong> quantity<br />
In general, it is reported that wells situated in the glacial deposits have proven adequate for<br />
domestic supply. Community water for Wasilla is provided by four ground water wells<br />
tapping multiple unconfined aquifers. The wells range from 146 feet to 250 feet in depth.<br />
Raw water quality is very good, <strong>and</strong> the system does not require treatment other than routine<br />
chlorination. Typical domestic supply from the glacial deposits near Houston has met<br />
expectations of a range of 10 to 50 gallons per minute (gpm), while it is reported that yields<br />
as high as 1,000 gpm could be achieved through proper well design at locations near the<br />
Little Susitna River. S<strong>and</strong>stone <strong>and</strong> coal layers at depth also provide potable water supply.<br />
Water quality concerns in the Houston area include incidental occurrences of high<br />
concentrations of hydrogen sulfide <strong>and</strong> conductivity, iron, total dissolved solids (TDS), <strong>and</strong><br />
phosphorous.<br />
Few high-capacity wells have been attempted in the Mat-Su; however, a Palmer city supply<br />
well draws 500 gpm from an aquifer at a depth of 624 feet below ground surface (bgs).<br />
Houston-area well production rates ranged from about 2 gpm for domestic bedrock wells, up<br />
to 250 gpm in institutional wells (Maynard 1987).<br />
In the Big Lake portion of the Study Area, higher yields are typical from the confined<br />
aquifer, up to 110 gpm compared with approximately 5 to 50 gpm in the shallow deposits<br />
(Hogan 1995). Drinking water quality near Big Lake is generally good; however, some wells<br />
contain constituent concentrations that exceed regulatory st<strong>and</strong>ards. These include TDS (as<br />
12/18/07 3-131
<strong>Knik</strong> <strong>Arm</strong> Crossing DraftFinal EIS<br />
<strong>Affected</strong> <strong>Environment</strong><br />
high as 1,430 milligrams per liter [mg/L]), iron (as high as 7.2 mg/L), chlorides (700 mg/L),<br />
sulfates (130 mg/L) <strong>and</strong> manganese (0.46 mg/L).<br />
Shallow ground water close to the northwestern portion of the Study Area is reportedly<br />
brackish or salty. The water quality problem occurs in the vicinity of Nancy Lake, at depths<br />
as shallow as 50 to 100 feet bgs, or nearly 180 feet above sea level. The cause for the salinity<br />
has not been determined; however, it is believed to be attributable either to connate water<br />
(water trapped in the sedimentary rock at the time of its deposit) or to inundation of the area<br />
by an ancestral Cook Inlet.<br />
In the Point MacKenzie portion of the Study Area, unconsolidated materials are known to<br />
provide potable water from unconfined as well as from confined aquifer sources. Unconfined<br />
aquifer yield in this portion of the Study Area is estimated by Glass (1983) to be 5 to 35 gpm,<br />
while the confined aquifer yield may range widely from less than 1 gpm to more than<br />
300 gpm. Ground water quality in the Point MacKenzie area varies widely. High salinity was<br />
reported in a 300-foot-deep well west of Horseshoe Lake, close to the Little Susitna River.<br />
Water samples collected during test well drilling near Lake Lorraine indicate increasing<br />
chlorides with depth; however, concentrations meet drinking water quality st<strong>and</strong>ards.<br />
3.5.6.1.2 Ground water quality concerns<br />
Arsenic<br />
Conditions favorable to the occurrence of arsenic in ground water are found throughout the<br />
Study Area. These include the presence of iron oxide <strong>and</strong> sulfide minerals in the aquifer<br />
materials <strong>and</strong> phosphates <strong>and</strong> organic carbon in alkaline (high pH) ground water. Several<br />
wells in the Study Area were identified with concentrations of arsenic between<br />
10 micrograms per liter (µg/L) <strong>and</strong> 50 µg/L (USGS 2001a). USEPA’s maximum<br />
contaminant level for arsenic in drinking water is 10 µg/L.<br />
Contaminated sites<br />
The Alaska Department of <strong>Environment</strong>al Conservation (ADEC) on-line databases were<br />
searched for incidents of “open” leaking underground storage tank sites (ADEC 2005a) <strong>and</strong><br />
“active” contaminated sites (ADEC 2005b) located in Big Lake, Houston, <strong>and</strong> Wasilla. No<br />
other location references from within the Study Area are used in the existing databases. The<br />
search resulted in the identification of seven sites in Big Lake, one site in Houston <strong>and</strong><br />
32 sites in Wasilla. The locations of the Wasilla sites were not researched to determine the<br />
number of sites situated within the Study Area.<br />
3.5.6.1.3 Ground water recharge areas<br />
Regional hydrogeologic mapping has not previously been conducted for the Mat-Su. Based<br />
on general geological conditions in the Study Area, recharge to unconfined aquifers is<br />
through downward percolation of precipitation. Recharge to deeper aquifers is by infiltration<br />
of ground water through aquitards <strong>and</strong> “leaky” confining layers, by lateral migration from<br />
other aquifers, <strong>and</strong>/or by direct infiltration of precipitation where the till or other confining<br />
3-132 12/18/07
<strong>Knik</strong> <strong>Arm</strong> Crossing DraftFinal EIS<br />
<strong>Affected</strong> <strong>Environment</strong><br />
layers are absent. Ground water recharge occurs over most of the l<strong>and</strong> surface, with discharge<br />
occurring locally to low-lying areas such as lakes, streams, <strong>and</strong> wetl<strong>and</strong>s.<br />
3.5.6.2 Anchorage<br />
The Anchorage portion of the Study Area is underlain by two primary freshwater aquifers<br />
within glacial outwash s<strong>and</strong>s <strong>and</strong> gravel. The upper unconfined aquifer (0–50 feet bgs) is<br />
separated from the lower, confined aquifer (70–300 feet bgs) by impermeable clay deposits<br />
of the Bootlegger Cove Formation. These aquifers flow west <strong>and</strong> generally thicken with<br />
distance from the Chugach Mountains.<br />
Recharge of the Anchorage-area aquifers has been estimated at 75 mgd. Recharge primarily<br />
occurs from bedrock seepage (25 mgd); infiltration by perennial surface streams <strong>and</strong> seepage<br />
along the Chugach front <strong>and</strong> foothills (20 mgd); <strong>and</strong> through direct recharge of rainfall,<br />
snowmelt, <strong>and</strong> water body losses within the lowl<strong>and</strong> areas (30 mgd) (Barnwell et al. 1972).<br />
Saltwater intrusion into the aquifers has been documented near Point Woronzof.<br />
Previous studies have used a value of 22 to 33 mgd for the ground water yield for the<br />
Anchorage Bowl. This number was originally obtained from a 1972 study (Barnwell et al.). It<br />
appears that the Barnwell study has been the basis for all Anchorage Bowl estimates of<br />
ground water yield since that time. Water quality is generally good; however, high arsenic<br />
levels have been found in some locations, S<strong>and</strong> Lake area for example.<br />
3.6 Cultural <strong>Environment</strong><br />
3.6.1 Archaeology <strong>and</strong> Historic Preservation<br />
3.6.1.1 Section 106 of the National Historic Preservation Act consultation<br />
To conduct project consultation with SHPO, the Study Team combined compliance with<br />
NEPA regulations [43 C.F.R. § 1500.5(i)] with the process it used to comply with<br />
Section 106 of the National Historic Preservation Act (NHPA) (16 U.S.C. § 470f, as<br />
amended). Section 106 requires that:<br />
The head of any Federal agency having direct or indirect jurisdiction over a proposed<br />
Federal or federally assisted undertaking … take into account the effect of the<br />
undertaking on any district, site, building, structure, or object that is included in or<br />
eligible for inclusion in the National Register. The head of any such Federal agency<br />
shall afford the Advisory Council on Historic Preservation … a reasonable<br />
opportunity to comment with regard to such undertaking.<br />
As lead federal agency, FHWA is carrying out this responsibility for itself <strong>and</strong> on behalf of<br />
USACE, USCG, <strong>and</strong> any other cooperating federal agency with the same legal requirements<br />
[43 C.F.R. § 1500.5(h)], but not including Elmendorf, or BLM acting on Elmendorf’s behalf,<br />
as it relates to the Anchorage approach. [see 36 C.F.R.§ 800.2(2)].<br />
The regulations implementing Section 106 are found at 36 C.F.R. Part 800, Protection of<br />
Historic Properties.<br />
12/18/07 3-133
<strong>Knik</strong> <strong>Arm</strong> Crossing DraftFinal EIS<br />
<strong>Affected</strong> <strong>Environment</strong><br />
3.6.1.2 Agency <strong>and</strong> tribal consultation<br />
SHPO was invited <strong>and</strong> agreed to participate in the NEPA process as a cooperating agency<br />
(43 C.F.R. § 1501.6). Consultation under Section 106 was also initiated with SHPO, <strong>and</strong> the<br />
following were invited to be consulting parties under 36 C.F.R. § 800.3(c): Federally<br />
Recognized Alaska Native Governments <strong>and</strong> Native villages <strong>and</strong> regional corporations<br />
(Native Village of Eklutna; Eklutna Incorporated; <strong>Knik</strong> Tribal Council, <strong>Knik</strong>atnu Inc.; Native<br />
Village of Tyonek; Tyonek Native Corporation; Chickaloon Village Traditional Council;<br />
Chickaloon-Moose Creek Native Association; <strong>and</strong> the Cook Inlet Region, Inc.), the<br />
Municipality of Anchorage Certified Local Government (CLG), the Mat-Su Borough CLG,<br />
the Government Hill Community Council, the Chugiak-Eagle River Historical Society, the<br />
Wasilla-<strong>Knik</strong>-Willow Creek Historical Society, <strong>and</strong> the Cook Inlet Historical Society. The<br />
general public was also invited to participate through a series of public scoping meetings.<br />
SHPO, Federally Recognized Alaska Native Governments <strong>and</strong> organizations, <strong>and</strong> the two<br />
CLGs have participated throughout the process. Native Village of Eklutna Resolution<br />
No. 2005–24, Preservation of Historical <strong>and</strong> Cultural Resources, is provided in Appendix D.<br />
The <strong>Knik</strong> Tribal Council’s Historic <strong>and</strong> Cultural Protection Ordinance 2006-02 is also found<br />
in Appendix D.<br />
3.6.1.3 Identification of historic properties<br />
Stephen R. Braund & Associates (SRB&A) completed an inventory <strong>and</strong> evaluation of historic<br />
properties on behalf of FHWA for compliance with 36 C.F.R. § 800.4 (SRB&A 2006; <strong>Knik</strong><br />
<strong>Arm</strong> Crossing, Section 106 Report, Volumes I <strong>and</strong> II, 2006). SRB&A conducted literature<br />
reviews for the Study Area, reviewed Alaska Heritage Resource Survey files (AHRS) for<br />
previously identified sites <strong>and</strong> then requested site numbers for documentation of properties<br />
within the general vicinity of the Anchorage approach, <strong>and</strong> conducted library, archival, <strong>and</strong><br />
oral interviews to obtain further information about historic properties in the Study Area.<br />
Throughout the scoping process SRB&A conducted windshield surveys of various<br />
Anchorage approaches <strong>and</strong> completed a field inventory <strong>and</strong> testing program on both proposed<br />
alternatives in the Mat-Su . Site-specific inventories of the area of potential effect (APE) for<br />
the Degan <strong>and</strong> Erickson Alternatives were then completed. FHWA consulted with the<br />
SHPO, 32 who requested additional information regarding the possibility of establishing a<br />
historic district. SRB&A then inventoried all of the 281 buildings on Government Hill.<br />
SRB&A also conducted extensive interviews with elders from the <strong>Knik</strong> Tribal Council <strong>and</strong><br />
Native Village of Eklutna for a Dena’ina fish camp called Tak’at (ANC-01337) <strong>and</strong>, with<br />
their assistance, prepared a traditional cultural property (TCP) recommendation for a<br />
determination of eligibility for the National Register (SRB&A 2006, Vol. I).<br />
Permission for access to complete inventories on Elmendorf l<strong>and</strong> was not granted. If the<br />
proposed project is approved with a USDOT easement or title transfer, those portions of the<br />
Study Areas on Elmendorf property will be inventoried for Section 106 compliance prior to<br />
construction.<br />
32 In this document, the noun form “the SHPO” means “the State Historic Preservation Officer.”<br />
3-134 12/18/07
<strong>Knik</strong> <strong>Arm</strong> Crossing DraftFinal EIS<br />
<strong>Affected</strong> <strong>Environment</strong><br />
3.6.1.4 Evaluation of historic significance<br />
36 C.F.R. § 800.4(c) requires that the agency official 1) apply the National Register criteria to<br />
properties identified in the APE, in consultation with the SHPO <strong>and</strong> federally recognized<br />
tribes that may attach religious <strong>and</strong> cultural significance, <strong>and</strong> 2) determine whether a property<br />
is eligible. The criteria, set out in 36 C.F.R. Part 63, are:<br />
The quality of significance in American history, architecture, archeology,<br />
engineering, <strong>and</strong> culture is present in districts, sites, buildings, structures, <strong>and</strong> objects<br />
that possess integrity of location, design, setting, materials, workmanship, feeling,<br />
<strong>and</strong> association <strong>and</strong><br />
(a) that are associated with events that have made a significant contribution to the<br />
broad patterns of our history; or<br />
(b) that are associated with the lives of persons significant in our past; or<br />
(c) that embody the distinctive characteristics of a type, period, or method of<br />
construction, or that represent the work of a master, or that possess high artistic<br />
values, or that represent a significant <strong>and</strong> distinguishable entity whose<br />
components may lack individual distinction; or<br />
(d) that have yielded, or may be likely to yield, information important in prehistory<br />
or history.<br />
National Register Bulletin 38, Guidelines for Evaluating <strong>and</strong> Documenting<br />
Traditional Cultural Properties, provides further instruction on how to apply the<br />
criteria to TCPs. Examples of properties possessing such significance include (among<br />
others) locations where a community or members of a community have traditionally<br />
carried out cultural practices or beliefs important in maintaining their historic identity.<br />
3.6.1.5 Determination of eligibility<br />
FHWA applied the National Register criteria to the properties identified by SRB&A, in<br />
consultation with the SHPO <strong>and</strong> appropriate Native Alaska governments, <strong>and</strong> made the<br />
following determinations.<br />
3.6.1.5.1 The Mat-Su<br />
The field inventory <strong>and</strong> testing program found no historic properties (SRB&A 2006, Vol. I);<br />
therefore, no identified historic properties would be affected by the implementation of any<br />
alternative presented in this Draft EIS.<br />
3.6.1.5.2 Anchorage<br />
SRB&A inventoried all of the 281 properties on Government Hill (SRB&A 2006).<br />
Government Hill had two historic properties, the Brown’s Point Cottages, ANC-0048 <strong>and</strong><br />
ANC-1205, already listed in the National Register. FHWA, 33 in consultation with SHPO, has<br />
determined that there are four historic districts <strong>and</strong> six additional individual properties that<br />
are eligible for the National Register <strong>and</strong> therefore meet the criteria for protection under<br />
33 Personal communication, Edrie Vinson, letter to Judith Bittner, June 23, 2006 (see Appendix D).<br />
12/18/07 3-135
<strong>Knik</strong> <strong>Arm</strong> Crossing DraftFinal EIS<br />
<strong>Affected</strong> <strong>Environment</strong><br />
Section 106 of NHPA <strong>and</strong> Section 4(f) of the Department of Transportation Act of 1966 (as<br />
amended). 34 The eligible districts <strong>and</strong> properties are (see Figure 3.32):<br />
• Government Hill Railroad Housing Historic District (ANC-2108)<br />
• Government Hill Quonset Hut Historic District (ANC-2111)<br />
• Government Hill Urban Renewal Historic District (ANC-2128)<br />
• Panoramic View Historic District (ANC-2126)<br />
• Quonset Hut (ANC-1843), 100½ West Cook Avenue<br />
• Wireless Station (ANC-0306), 124, 132, <strong>and</strong> 140 East Manor Avenue<br />
• Loxtave House (ANC-1860), 308½ East Manor<br />
• Weaver House, Atomic Ranch (ANC-1869), 301 East Harvard Avenue<br />
• Alaska Railroad Employees Club/Square & Round Dance Club (ANC-1932),<br />
32 East Harvard Avenue<br />
• Alaska Railroad Water Tower (ANC-1933), 232 East Harvard Avenue<br />
The basis for these eligibility determinations are documented in SRB&A 2006; <strong>Knik</strong> <strong>Arm</strong><br />
Crossing, Section 106 Report, Volumes I <strong>and</strong> II, 2006 <strong>and</strong> in consultation letters between<br />
FHWA <strong>and</strong> SHPO, which are contained in Appendix D.<br />
AHRS site ANC-01337, a Dena’ina fish camp called Tak’at, is located north of Ship Creek<br />
near an eddy where fish congregate before migrating up local streams to spawn. This springsummer<br />
habitation site, the location of the traditional First Salmon Ceremony <strong>and</strong> of one of<br />
the last potlatch ceremonies in this area, was determined eligible by FHWA under<br />
criterion (a) as a TCP site. This place is where the peoples of the <strong>Knik</strong> <strong>and</strong> Eklutna Tribes<br />
traditionally gathered <strong>and</strong> preserved fish as a staple food source <strong>and</strong> participated in<br />
ceremonies important in maintaining their historic cultural identities (SRB&A 2006, Vol. I).<br />
The SHPO did not concur in the eligibility determination on Tak’at due to the presence of<br />
military debris <strong>and</strong> toxic wastes, as well as the port <strong>and</strong> military security preventing the site<br />
being used for traditional purposes. FHWA discussed the SHPO’s finding with the tribes, <strong>and</strong><br />
advised them of their right to request an official determination by the Keeper of the National<br />
Register. 35 However, the tribes agreed that preservation in place was not possible, <strong>and</strong> that its<br />
importance to them was in having their story told. Therefore, while not considered eligible<br />
under Section 106, for the purposes of compliance, Tak’at is given special consideration here<br />
in light of its significant history to the tribes.<br />
34 Personal communication, Judith Bittner, letter to Edrie Vinson, July 17, 2006 (see Appendix D).<br />
35 Personal communication, Judith Bittner, State Historic Preservation Officer, letter to Edrie Vinson, March 28,<br />
2006 (see Appendix D).<br />
3-136 12/18/07
<strong>Knik</strong> <strong>Arm</strong> Crossing DraftFinal EIS<br />
<strong>Affected</strong> <strong>Environment</strong><br />
Figure 3.32. Government Hill Historic Districts<br />
12/18/07 3-137
<strong>Knik</strong> <strong>Arm</strong> Crossing DraftFinal EIS<br />
<strong>Affected</strong> <strong>Environment</strong><br />
3.6.2 Recreational Resources, Parks, <strong>and</strong> Wildlife Refuges<br />
The following sections summarize recreational resources, parks, <strong>and</strong> wildlife refuges in the<br />
Mat-Su, <strong>Knik</strong> <strong>Arm</strong>, <strong>and</strong> Anchorage areas that could be affected indirectly by the proposed<br />
action. See Section 3.7 of this Draft EIS <strong>and</strong> the accompanying Section 4(f) Evaluation for<br />
information on specific Section 4(f) resources.<br />
No l<strong>and</strong>s in the project area were identified that are subject to provisions of Section 6(f) of<br />
the L<strong>and</strong> <strong>and</strong> Water Conservation Fund Act (LWCF Act) based on consultations with the<br />
State of Alaska’s designated LWCF Act Liaison.<br />
3.6.2.1 The Mat-Su<br />
This section describes specific recreational facilities <strong>and</strong> resources in the Mat-Su that could<br />
be indirectly affected by the proposed project, including scenic roadways, state game refuges,<br />
wayside parks <strong>and</strong> campgrounds, fishing <strong>and</strong> hunting areas, <strong>and</strong> miscellaneous existing <strong>and</strong><br />
planned recreational areas. The focus is on those facilities <strong>and</strong> resources in the Mat-Su that<br />
are within convenient travel distance of Anchorage <strong>and</strong> also readily accessible to Mat-Su<br />
communities (Figure 3.33). The analysis emphasizes recreational facilities <strong>and</strong> resources that<br />
are in natural settings. Heritage sites <strong>and</strong> museums are, however, also found throughout the<br />
region, including the Dorothy Page Museum <strong>and</strong> Frontier Village in Wasilla, Alpine<br />
Historical Park in Sutton, <strong>Knik</strong> Museum <strong>and</strong> Dog Mushers’ Hall of Fame on <strong>Knik</strong> Road,<br />
Palmer Visitor Center <strong>and</strong> Museum, Independence Mine State Historical Park near Hatcher<br />
Pass, <strong>and</strong> the Museum of Alaska Transportation <strong>and</strong> Industry in Wasilla. Community<br />
recreational facilities in the Mat-Su include five golf courses, three motor sports racing<br />
tracks, the Wasilla Multi-Use Sports Complex, Palmer Ice Arena, Palmer <strong>and</strong> Wasilla public<br />
pools, <strong>and</strong> numerous neighborhood parks, playgrounds, <strong>and</strong> ball fields (MSB 2003a).<br />
3.6.2.1.1 Scenic roadways<br />
Recreational resources that could be affected by implementation of the proposed project<br />
include certain scenic roadways in the Mat-Su. Driving on these roads may itself be<br />
perceived as a recreational activity. “Highway-oriented” recreational facilities along these<br />
roads include pull-outs, interpretative or information signs, designated fishing areas near<br />
bridges, <strong>and</strong> waysides. In addition, these roadways provide access to major natural, historic,<br />
<strong>and</strong> cultural attractions that provide recreational opportunities. The two major highways that<br />
traverse the Mat-Su are especially noteworthy: the Glenn Highway (a designated National<br />
Scenic Byway) <strong>and</strong> the Parks Highway (designated a National Scenic<br />
Byway in the northern Susitna Valley) as previously discussed in Section 3.2.2.1. A 135-mile<br />
portion of the Glenn Highway from Anchorage to the Little Nelchina River <strong>and</strong> a 16-mile<br />
portion of the Parks Highway from Denali State Park to Healy are designated by ADOT&PF<br />
as Alaska Scenic Byways.<br />
3-138 12/18/07
<strong>Knik</strong> <strong>Arm</strong> Crossing DraftFinal EIS<br />
<strong>Affected</strong> <strong>Environment</strong><br />
Figure 3.33. Recreational resources, parks, <strong>and</strong> wildlife refuges – the Mat-Su<br />
12/18/07 3-139
<strong>Knik</strong> <strong>Arm</strong> Crossing DraftFinal EIS<br />
<strong>Affected</strong> <strong>Environment</strong><br />
3.6.2.1.2 State game refuges<br />
A state game refuge (SGR) is a specially protected area managed by ADF&G. The Alaska<br />
State Legislature has deemed these areas essential to the protection of fish <strong>and</strong> wildlife<br />
habitat. Most SGRs provide for fishing, hunting, wildlife viewing, <strong>and</strong> other seasonal<br />
recreational opportunities. Three SGRs are located within the Mat-Su: Susitna Flats SGR,<br />
Goose Bay SGR, <strong>and</strong> Palmer Hay Flats SGR. These units are dominated by wetl<strong>and</strong>s <strong>and</strong><br />
coastal estuaries that provide regionally important habitat for waterfowl, shorebirds, <strong>and</strong><br />
other wildlife.<br />
3.6.2.1.3 Parks <strong>and</strong> campgrounds<br />
Table 3-21 lists the major parks <strong>and</strong> campgrounds in the area of indirect effects. Fish Creek<br />
Parkis administered by the Mat-Su Borough. The Alaska Division of Parks <strong>and</strong> Outdoor<br />
Recreation manages state recreation areas <strong>and</strong> related sites. There are also numerous<br />
privately operated campgrounds <strong>and</strong> recreational vehicle (RV) parks in the Mat-Su portion of<br />
the Study Area.<br />
Table 3-21. Major public parks <strong>and</strong> campgrounds in the Mat-Su<br />
Facility<br />
Location/Features<br />
Overnight<br />
visitor capacity<br />
Fish Creek Park (Big Lake) S. Big Lake Rd. at Fish Creek day use area<br />
Big Lake North State Recreation Site Mile 5 of N. Big Lake Road 60 campsites<br />
Big Lake South State Recreation Site Mile 5.2 of S. Big Lake Road 20 campsites<br />
Rocky Lake State Recreation Site Mile 3.5 of Big Lake Road; fishing; boating 10 campsites<br />
Little Susitna Public Use Facility Susitna Flats SGR; fishing; boating 40 campsites<br />
Sources: Mat-Su Borough, 2005e; Alaska Department of Natural Resources, 2005<br />
According to records maintained by the Mat-Su Borough Recreation <strong>and</strong> Library Services<br />
(MSB 2005g), none of the Borough recreational facilities is operating at full capacity on a<br />
regular basis. Trailheads for snowmachine access to the Susitna River are popular during<br />
winter weekends with optimal snow conditions. Day use parks are at full capacity on sunny<br />
<strong>and</strong> warm summer weekends <strong>and</strong> evenings.<br />
All the state parks in the Mat-Su are closed during the winter. Mid-July is generally the peak<br />
period for most of the parks.<br />
According to Heikes, 37 use of some state parks has declined in recent years for various<br />
reasons.<br />
37 Personal communication, Dennis Heikes, Superintendent, Mat-Su/Copper Basin Area, Alaska Division of<br />
Parks <strong>and</strong> Outdoor Recreation, with Donald Shug, Northern Economics, Inc., May 19, 2005.<br />
3-140 12/18/07
<strong>Knik</strong> <strong>Arm</strong> Crossing DraftFinal EIS<br />
<strong>Affected</strong> <strong>Environment</strong><br />
3.6.2.1.4 Fishing <strong>and</strong> hunting<br />
The Mat-Su portion of the Study Area lies within the <strong>Knik</strong> <strong>Arm</strong> Management Unit of the<br />
Northern Cook Inlet Sport Fish Management Area (NCIMA). Most of the freshwater rivers<br />
<strong>and</strong> streams in the Mat-Su are open to sport fishing; regulations vary by location. Open<br />
season is June 15 to April 14 for most of the Mat-Su portion of the Study Area. (The Little<br />
Susitna River is open year-round for all species except Chinook salmon.) Fishing <strong>and</strong> hunting<br />
are important recreational activities in the Point MacKenzie area <strong>and</strong> other parts of the<br />
Mat-Su. The Little Susitna River is the most heavily fished stream in the <strong>Knik</strong> <strong>Arm</strong><br />
Management Unit (Sweet et al. 2003). The Little Susitna River produces all five species of<br />
Pacific salmon found in Alaska <strong>and</strong> is famous as one of the state’s best silver salmon streams<br />
(it has the second-largest freshwater harvest of silver salmon in Alaska). It is one of the<br />
Mat-Su’s most popular fisheries, receiving over 50,000 angler-days of use per year<br />
Game harvest data collected by the ADF&G for Game Management Unit 14A, which<br />
encompasses most of the Mat-Su including the Point MacKenzie area <strong>and</strong> Upper Cook Inlet,<br />
are presented in the Terrestrial Mammal Technical Report (KABATA 2006p). In 2002–<br />
2003, 2,910 individuals engaged in moose hunting, which is the primary hunting activity in<br />
the Mat-Su. Black bear is the other large game species hunted in the area. In 2000–2001,<br />
there were 137 black bear permittees in Game Management Unit 14 (Healy 2002). Waterfowl<br />
hunting <strong>and</strong> furbearer trapping also occur in the Mat-Su.<br />
3.6.2.1.5 Trails<br />
Trails play a key role in the recreation of residents <strong>and</strong> visitors throughout the Mat-Su<br />
(MSB 2003a). According to the Recreational Trails Plan prepared by the Mat-Su Borough<br />
(2000), 2,000 miles of regionally significant recreational trails cross much of the Mat-Su.<br />
These traditional trails provide for a wide range of functional <strong>and</strong> recreational activities, from<br />
dog mushing to snowmachining, skiing, hiking, biking, wood hauling, hunting, <strong>and</strong> trapping<br />
(Section 3.2.2.5). Some winter trails are groomed weekly for Nordic skiing, <strong>and</strong> several track<br />
<strong>and</strong> skate skiing trails are maintained throughout the winter.<br />
Many commonly used trails within the Mat-Su that are not dedicated. While some of these<br />
undedicated trails lie entirely on public l<strong>and</strong>s, the Mat-Su Borough (2000) estimates that<br />
approximately 80 percent of the trails cross private l<strong>and</strong>. Without legal public access, these<br />
trails can be closed at the discretion of the l<strong>and</strong>owner.<br />
The Mat-Su Borough has established the Point MacKenzie Recreational Trailhead, an access<br />
point for snowmachiners where a major power transmission line crosses Point MacKenzie<br />
Road (Figure 3.34). The trailhead provides access to a series of informal, undesignated trails<br />
that are used by snowmachines in winter <strong>and</strong> by all-terrain vehicles in summer. It also<br />
provides access along the power line to the Susitna Flats SGR <strong>and</strong> points west, as well as to<br />
points east along the power transmission line easement. While the trails are not officially <strong>and</strong><br />
formally dedicated, the trailhead was established expressly to provide recreational access. It<br />
was upgraded <strong>and</strong> formalized with funding from a 2002 Recreational Trails Grant<br />
administered by the State of Alaska <strong>and</strong> paid for principally with taxes on snowmachine <strong>and</strong><br />
12/18/07 3-141
<strong>Knik</strong> <strong>Arm</strong> Crossing DraftFinal EIS<br />
<strong>Affected</strong> <strong>Environment</strong><br />
Figure 3.34. Recreational resources – Point MacKenzie Road<br />
3-142 12/18/07
<strong>Knik</strong> <strong>Arm</strong> Crossing DraftFinal EIS<br />
<strong>Affected</strong> <strong>Environment</strong><br />
off-road vehicle sales. FHWA determined that the Point MacKenzie Recreational Trailhead<br />
is a Section 4(f) resource; it is discussed in greater detail in Section 3.7.<br />
3.6.2.1.6 Iditarod Trail/Sled Dog Race<br />
The Iditarod National Historic Trail stretches from Seward to Nome. Alaska’s best known<br />
dog mushing contest, the 1,049-mile Iditarod Trail Sled Dog Race, starts at Wasilla <strong>and</strong><br />
follows the trail, crossing the Mat-Su portion of the Study Area from Wasilla to Yentna.<br />
Most of the National Historic Trail is usable only during winter, when rivers <strong>and</strong> tundra are<br />
frozen. Aside from the annual sled dog race, use of the Iditarod Trail is primarily recreational<br />
(e.g., ATV, snowmachining, cross-country skiing).<br />
3.6.2.2 <strong>Knik</strong> <strong>Arm</strong><br />
Because of its heavy silt content, strong currents, high tidal fluctuations, <strong>and</strong> winter ice, <strong>Knik</strong><br />
<strong>Arm</strong> is not considered a recreational resource. Nonetheless, fishing boats <strong>and</strong> pleasure craft<br />
are used in <strong>Knik</strong> <strong>Arm</strong> to fish off the mouth of Ship Creek, cross to Fire Isl<strong>and</strong>, or cross to the<br />
Susitna River flats. A small public dock <strong>and</strong> a boat ramp at the mouth of Ship Creek are used<br />
in summer, but Anchorage has no small boat harbor. Most pleasure or sportfishing boats<br />
owned by Anchorage or Mat-Su residents are moored in Whittier, Seward, or Homer. In<br />
comparison with these locations, use of <strong>Knik</strong> <strong>Arm</strong> for recreational boating is minimal.<br />
3.6.2.3 Anchorage<br />
The Anchorage discussion begins with recreational resources in the broader geographic sense<br />
(Anchorage Bowl) <strong>and</strong> then focuses in <strong>and</strong> around the Anchorage portion of the Study Area<br />
(narrower focus). Recreational resources, parks, <strong>and</strong> wildlife refuges outside the Study Area<br />
are not expected to be directly or indirectly affected by the proposed project.<br />
3.6.2.3.1 Anchorage Bowl<br />
The Anchorage Bowl, as shown in Figure 3.35, includes more than 10,800 acres of municipal<br />
parkl<strong>and</strong>, 200 parks, 40 recreational facilities, <strong>and</strong> over 400 miles of trails (Section 3.2.2.5)<br />
linking neighborhoods with surrounding natural open space <strong>and</strong> wildlife habitat. Publicprivate<br />
partnerships <strong>and</strong> commercial enterprises are fast-growing components of<br />
Anchorage’s recreational activities. 38 Parks <strong>and</strong> open spaces in the Anchorage Bowl make<br />
important contributions to the quality of life for local residents.<br />
3.6.2.3.2 Anchorage portion of Study Area<br />
In the Anchorage portion of the Study Area, there are approximately 58 acres of parkl<strong>and</strong>,<br />
open space, <strong>and</strong> greenbelt areas (Figure 3.36). All of these amenities were considered in the<br />
alternatives screening, alignment location <strong>and</strong> design, <strong>and</strong> further refinement <strong>and</strong> avoidance<br />
of the build alternatives discussed in Sections 2 <strong>and</strong> 4 <strong>and</strong> in the Draft Section 4(f)<br />
Evaluation.<br />
38 Park <strong>and</strong> trail information gathered from municipal Web sites: <strong>and</strong> .<br />
12/18/07 3-143
<strong>Knik</strong> <strong>Arm</strong> Crossing DraftFinal EIS<br />
<strong>Affected</strong> <strong>Environment</strong><br />
Figure 3.35. Recreational resources, parks, <strong>and</strong> wildlife refuges – Anchorage Bowl<br />
3-144 12/18/07
<strong>Knik</strong> <strong>Arm</strong> Crossing DraftFinal EIS<br />
<strong>Affected</strong> <strong>Environment</strong><br />
Figure 3.36. Recreational resources, parks, <strong>and</strong> wildlife refuges – Anchorage<br />
12/18/07 3-145
<strong>Knik</strong> <strong>Arm</strong> Crossing DraftFinal EIS<br />
<strong>Affected</strong> <strong>Environment</strong><br />
Table 3-22 summarizes the study area parks <strong>and</strong> features.<br />
Table 3-22. Parks <strong>and</strong> features in the Anchorage portion of the Study Area<br />
Facility<br />
Susan Nightingale McKay<br />
Memorial Park<br />
Government Hill Elementary School<br />
Playground<br />
Cunningham Park<br />
Government Hill Greenbelt (East <strong>and</strong><br />
West Bluffs)<br />
Brown’s Point Park<br />
Al Miller Memorial Park<br />
Richardson Vista Park<br />
Alderwood Park<br />
Harvard Park<br />
Sunset Park<br />
Quyana Park<br />
Barrow Park<br />
Ben Crawford Memorial Park<br />
Location/Features<br />
Government Hill/open space<br />
Government Hill/playground<br />
Government Hill/open space<br />
Government Hill/open space, buffer<br />
Government Hill/open space, buffer<br />
Government Hill/open space, picnic area<br />
Government Hill/playground<br />
Government Hill/playground<br />
Government Hill/curling club <strong>and</strong> dance club<br />
buildings, basketball <strong>and</strong> tennis courts,<br />
Government Hill/playground, picnic tables,<br />
sledding area<br />
Ship Creek/open space, views, bluff<br />
Ship Creek/open space, views<br />
Ship Creek/open space, views<br />
About 46 acres of parkl<strong>and</strong> are located in the Government Hill neighborhood. Harvard Park<br />
<strong>and</strong> Sunset Park are located closest to the alternatives evaluated in Section 4.6.2 <strong>and</strong><br />
comprise about 10.1 acres of the total parkl<strong>and</strong>. These <strong>and</strong> selected smaller parks in<br />
Government Hill are shown on Figure 3.36. Harvard <strong>and</strong> Sunset Parks have recreational open<br />
areas <strong>and</strong> amenities. Sunset Park includes a playground, picnic tables, sledding area, <strong>and</strong> a<br />
parking lot. Harvard Park includes a building used by the Anchorage Square & Round Dance<br />
Club <strong>and</strong> another building owned by the Anchorage Curling Club, as well as basketball <strong>and</strong><br />
tennis courts. The Municipality of Anchorage permits use of the dance club building <strong>and</strong><br />
leases l<strong>and</strong> for the curling club building to the private nonprofit user groups. Therefore, those<br />
buildings do not receive Section 4(f) protection as park or recreation facilities, although the<br />
dance club building does quality for Section 4(f) protection as an historic site. In addition,<br />
not all parks <strong>and</strong> greenbelt areas in the project area qualify for Section 4(f) protection. See<br />
the separate Draft Section 4(f) Evaluation following this EIS for detail.<br />
About 12 acres of parkl<strong>and</strong> are located in the Ship Creek area, including Ship Creek<br />
Overlook, Quyana Park, Barrow Park, <strong>and</strong> the Ben Crawford Memorial Park. Existing <strong>and</strong><br />
planned portions of the Ship Creek Trail are also in the area.<br />
The Ship Creek Trail consists of existing <strong>and</strong> proposed trails along Ship Creek. When<br />
complete, it will connect the Mountain View neighborhood <strong>and</strong> existing Glenn Highway<br />
Trail with the existing Tony Knowles Coastal Trail (a National Recreation Trail). All three<br />
3-146 12/18/07
<strong>Knik</strong> <strong>Arm</strong> Crossing DraftFinal EIS<br />
<strong>Affected</strong> <strong>Environment</strong><br />
trails are designed as long-distance trails with minimal road <strong>and</strong> driveway crossings. A<br />
planned portion of the Ship Creek Trail would be located on l<strong>and</strong> owned by ARRC, which.<br />
has granted a permit to the Municipality of Anchorage for construction <strong>and</strong> maintenance of<br />
this portion of the trail. This l<strong>and</strong> was transferred to the state railroad for transportation<br />
purposes. On the basis of this factor <strong>and</strong> the terms of the permit, FHWA has determined that<br />
the portion of the trail that would be constructed on this ARRC parcel is not subject to<br />
Section 4(f) protection<br />
Details of the sites considered by FHWA to be Section 4(f) resources are discussed in<br />
Section 3.7 of this Draft EIS <strong>and</strong> are provided in greater detail in Sections 1.2.1, 1.2.2,<br />
<strong>and</strong> 1.2.5 of the Draft Section 4(f) Evaluation, located at the end of this document.<br />
3.6.2.3.3 Anchorage Bowl draft parks planning<br />
The (Draft) Anchorage Bowl – Park, Natural Resources, <strong>and</strong> Recreation Facility Plan,<br />
which was adopted by the Assembly in April 2006, (MOA 2005g) identifies the need to<br />
develop new facilities, parking, <strong>and</strong> play areas at two Government Hill Parks: Brown’s Point<br />
Park <strong>and</strong> Richardson Vista Park. The draft plan also identifies completion of the Ship Creek<br />
Trail as well as a Government Hill connection to the Ship Creek Trail as priorities. Other trail<br />
improvements identified in the draft plan near the Anchorage portion of the Study Area are<br />
development of the Midtown Trail along the C Street corridor <strong>and</strong> completion of 5th <strong>and</strong><br />
6th Avenue improvements from C Street to Ingra Street.<br />
The draft plan also includes recommendations for research, signs, <strong>and</strong> reconstruction of the<br />
historically accurate Iditarod Trail. Connecting trails in the study area—part of the Iditarod<br />
National Historic Trail system—include routes along Ship Creek <strong>and</strong> from Ship Creek<br />
northward. .<br />
3.6.3 Visual <strong>Environment</strong><br />
FHWA’s <strong>Environment</strong>al Impact Statement Visual Impact Discussion (n.d.) requires that a<br />
system be used to evaluate the visual character <strong>and</strong> quality of an area. The process used for<br />
this analysis is adopted from FHWA’s Visual Impact Assessment for Highway Projects<br />
(1981) <strong>and</strong> includes subdividing the corridor into l<strong>and</strong>scape units <strong>and</strong> defining viewsheds,<br />
viewer groups, <strong>and</strong> the visual character <strong>and</strong> quality of the units. The results of the existing<br />
visual character <strong>and</strong> quality analysis provide the framework for comparing the visual impacts<br />
of the proposed project.<br />
3.6.3.1 Regional context<br />
L<strong>and</strong>scape components are the physical elements that make up the l<strong>and</strong>scape, including<br />
l<strong>and</strong>form, water, vegetation, <strong>and</strong> man-made development. The general l<strong>and</strong>scape setting of<br />
the area is characterized by a broad, glacial-fed arm of Cook Inlet, bordered by bluffs that lie<br />
below relatively low upl<strong>and</strong> areas. The upl<strong>and</strong> areas tend to be flat to gently rolling, typical<br />
of remnant glacial l<strong>and</strong>forms.<br />
12/18/07 3-147
<strong>Knik</strong> <strong>Arm</strong> Crossing DraftFinal EIS<br />
<strong>Affected</strong> <strong>Environment</strong><br />
The Study Area provides a full range of l<strong>and</strong>scapes, from urban to undisturbed. The urban<br />
l<strong>and</strong>scapes are generally industrial in nature in the Ship Creek drainage <strong>and</strong> industrial to<br />
residential <strong>and</strong> undeveloped on the bluff north of the Ship Creek drainage. Across <strong>Knik</strong> <strong>Arm</strong>,<br />
a seldom-traveled arm of Cook Inlet over which the proposed bridge would be located, they<br />
are of open water, tidal flats, <strong>and</strong> wooded bluffs. Along the western portion of the Study<br />
Area, l<strong>and</strong>scape settings vary from rural to undisturbed.<br />
3.6.3.2 Viewsheds<br />
The Study viewsheds—the more or less linear areas from which it would be possible to see<br />
the proposed project—includes the Mat-Su, the Government Hill neighborhood, the Ship<br />
Creek area, locations south of Ship Creek, Downtown Anchorage, <strong>and</strong> local parks, as well as<br />
the proposed roadway <strong>and</strong> bridge.<br />
3.6.3.2.1 L<strong>and</strong>scape units<br />
To provide a framework for analyzing the visual environment, six l<strong>and</strong>scape units have been<br />
identified based on the interaction of l<strong>and</strong> use, l<strong>and</strong> cover, <strong>and</strong> building form. Each unit has a<br />
distinct visual character <strong>and</strong> would be an important element in managing any visual effects of<br />
the proposed project. See Figure 3.37 for the l<strong>and</strong>scape unit locations.<br />
Mat-Su Borough Upl<strong>and</strong>s<br />
This l<strong>and</strong>scape unit extends north from the bridge l<strong>and</strong>ing at the western edge of <strong>Knik</strong> <strong>Arm</strong><br />
<strong>and</strong> includes all l<strong>and</strong>s between the l<strong>and</strong>ing <strong>and</strong> <strong>Knik</strong>-Goose Bay Road. It is an area generally<br />
composed of upl<strong>and</strong> boreal forest with smaller wetl<strong>and</strong> areas interspersed throughout. The<br />
upl<strong>and</strong> forest is characterized by mixed st<strong>and</strong>s of paper birch <strong>and</strong> white spruce, with<br />
occasional balsam poplar, quaking aspen, willow, <strong>and</strong> alder. The interior lowl<strong>and</strong>s are mostly<br />
wetl<strong>and</strong>s of the bog <strong>and</strong> fen type, consisting of sedge <strong>and</strong> sphagnum mat with ericaceous<br />
shrubs <strong>and</strong> occasional st<strong>and</strong>s of black spruce. Other than roadways <strong>and</strong> intermittent clearings,<br />
there is little disturbance to the natural setting.<br />
<strong>Knik</strong> <strong>Arm</strong><br />
This l<strong>and</strong>scape unit encompasses the water region that extends from the shore north of Port<br />
MacKenzie on the west to the bluff along the Anchorage side on the east.<br />
Eastern Bluff<br />
This l<strong>and</strong>scape unit stretches from the l<strong>and</strong>ing where the proposed KAC bridge would<br />
connect with the bluff along the north edge of the POA. The unit generally is a steeply<br />
sloping (approximately 2:1, vertical-to-horizontal) bluff, varying from 50 to 150 feet in<br />
height, <strong>and</strong> generally wooded.<br />
3-148 12/18/07
<strong>Knik</strong> <strong>Arm</strong> Crossing DraftFinal EIS<br />
<strong>Affected</strong> <strong>Environment</strong><br />
Figure 3.37. Study Area l<strong>and</strong>scape units<br />
12/18/07 3-149
<strong>Knik</strong> <strong>Arm</strong> Crossing DraftFinal EIS<br />
<strong>Affected</strong> <strong>Environment</strong><br />
Government Hill<br />
This l<strong>and</strong>scape unit includes the neighborhood north of the Ship Creek drainage composed of<br />
a predominantly residential neighborhood with some businesses located along East Loop<br />
Road; Hollywood Drive; <strong>and</strong> Erickson, Degan, <strong>and</strong> Bilbo Streets.<br />
Ship Creek/Port<br />
For the purposes of this study, this l<strong>and</strong>scape unit includes the Ship Creek valley <strong>and</strong> the<br />
POA, bordered by the Government Hill neighborhood to the north <strong>and</strong> the Anchorage central<br />
business district to the south. The area is generally industrial in character, with the exception<br />
of some retail businesses on the south side of Ship Creek. It also includes arterial roadways<br />
that serve the POA, a rail yard, Elmendorf, <strong>and</strong> the hillside below the Government Hill<br />
neighborhood.<br />
Ingra-Gambell<br />
This l<strong>and</strong>scape unit starts south of Ship Creek <strong>and</strong> is bound by 4th Avenue to the south,<br />
Eagle Street to the west, <strong>and</strong> Karluk Street to the east. This neighborhood is a mix of<br />
residential <strong>and</strong> commercial uses, with a large portion being a vacant lot.<br />
3.6.3.3 Viewer groups<br />
There are four major types of viewer groups in the Study Area. The groups were identified<br />
based on the existing l<strong>and</strong> uses <strong>and</strong> travel routes. Table 3-23 identifies viewer groups who,<br />
according to Study Team assumptions, have the following expectations <strong>and</strong> values:<br />
Table 3-23. Viewer groups descriptions, expectations, <strong>and</strong> values<br />
Viewer group Description Expectations <strong>and</strong> values<br />
Tourists/Recreationists<br />
Government Hill residents<br />
Port of Anchorage <strong>and</strong><br />
Alaska Railroad workers<br />
Motorists/Pedestrians<br />
Visitors from out-of-state,<br />
anglers, tourists in the Ship<br />
Creek area<br />
Residents of Government Hill<br />
neighborhood<br />
Workers at locations in the<br />
industrial district<br />
Residents <strong>and</strong> visitors using<br />
roadways within the Study<br />
Area<br />
Generally high appreciation for visual<br />
quality of an area <strong>and</strong> desire for undisturbed<br />
l<strong>and</strong>s<br />
Generally a desire for protection of visual<br />
quality, including views from parks, trails,<br />
<strong>and</strong> individual residences; generally<br />
cautious concerning changes to visual<br />
environment<br />
Generally not focused on visual quality or<br />
character <strong>and</strong> usually accustomed to<br />
physical changes to visual environment<br />
High variability in visual values <strong>and</strong> the<br />
acceptance of changes to existing visual<br />
conditions<br />
3-150 12/18/07
<strong>Knik</strong> <strong>Arm</strong> Crossing DraftFinal EIS<br />
<strong>Affected</strong> <strong>Environment</strong><br />
3.6.3.3.1 Viewer response issues<br />
Viewer exposure<br />
Viewer exposure is expressed by the number, distance, duration, <strong>and</strong> speed of view for each<br />
of the viewer groups.<br />
While people reside in a given home, the pace <strong>and</strong> context of life is at a regional scale.<br />
People spend considerable amount of time out of their homes, traveling to <strong>and</strong> from<br />
neighborhood <strong>and</strong> city parks, schools, <strong>and</strong> work <strong>and</strong> retail centers. In pursuing these<br />
destinations—whether on foot, by bicycle, or by car or bus—the proposed project could be<br />
glimpsed from numerous locations <strong>and</strong> for variable lengths of time.<br />
Motorists <strong>and</strong> pedestrians would generally be exposed to the proposed project for the time<br />
during which they would transit the project. For motorists, the period of exposure would tend<br />
to be of short duration—measured in seconds—while for pedestrians, the exposure period<br />
would tend to be long, measured in minutes. For those using other roadways, the proposed<br />
project would generally be out of the frame of view of motorists, but would be more exposed<br />
to pedestrian viewers.<br />
Tourists/Recreationists<br />
Tourists <strong>and</strong> recreationists generally frequent the Downtown Anchorage area <strong>and</strong> Ship Creek<br />
area. Many arrive by the Alaska Railroad. These users number in the tens of thous<strong>and</strong>s <strong>and</strong><br />
are generally limited to the May-to-September period. They typically use the Ship Creek <strong>and</strong><br />
Downtown Anchorage areas for periods of one to several hours <strong>and</strong> would have views of the<br />
proposed project of from 0.1 to 1.0 mile distance. Users of the Ship Creek Trail, which are<br />
expected to number in the hundreds of users per day, would travel directly under the<br />
proposed Ingra-Gambell Viaduct. Generally, trail users <strong>and</strong>/or tourists move at a relatively<br />
low rate of speed; thus, exposure time to the KAC project, if built, could be measured in<br />
terms of seconds, minutes, or hours, depending on whether the users would be walking,<br />
fishing, or shopping.<br />
Government Hill residents<br />
Approximately 158 residents located on the north side of the Ship Creek valley, north of the<br />
bluff, would have views of the proposed project from varying angles.<br />
Tourists/Shoppers<br />
The Ship Creek area is becoming a tourism destination with increasing restaurant <strong>and</strong> retail<br />
development along Ship Creek. This viewer group is generally located in the western portion<br />
of the Ship Creek valley, west of Cordova Avenue <strong>and</strong> removed from proximity to the<br />
proposed project. They would, however, have visual access to it. Typically, the group has a<br />
high level of appreciation for scenic quality, travels at a slow pace, <strong>and</strong> has time to view the<br />
full context of their settings’ foreground, middleground, <strong>and</strong> background points of interest.<br />
12/18/07 3-151
<strong>Knik</strong> <strong>Arm</strong> Crossing DraftFinal EIS<br />
<strong>Affected</strong> <strong>Environment</strong><br />
Motorists/Pedestrians<br />
The Motorists/Pedestrians viewer group includes those using the proposed project as well as<br />
those using the A-C Viaduct <strong>and</strong> roadways in the Ship Creek area.<br />
3.6.3.3.2 Viewer sensitivity<br />
Viewer sensitivity is defined by expected viewer response to various levels of change to the<br />
visual environment.<br />
Tourists/Recreationists<br />
This viewer group is likely to have a high level of concern for aesthetic issues because<br />
expectations of a high-quality experience are what will have drawn them to Anchorage <strong>and</strong> to<br />
the Ship Creek area. Expectations are likely not as high in the Ship Creek area because of its<br />
proximity to nearby industrial development.<br />
Government Hill Residents<br />
This viewer group is likely to have a high level of concern about the effect of the roadway on<br />
foreground views <strong>and</strong> neighborhood character.<br />
Motorists/Pedestrians<br />
Motorists are generally focused on the immediate travel path, although they would have<br />
interest in opportunities for views to Ship Creek <strong>and</strong> <strong>Knik</strong> <strong>Arm</strong>. Pedestrians tend to be more<br />
sensitive to views because the exposure period would be longer <strong>and</strong> there would be time to<br />
focus on the view beyond the limits of the proposed roadway itself.<br />
Port of Anchorage <strong>and</strong> Alaska Railroad Workers<br />
This viewer group is likely to have a low level of concern for views of the proposed project.<br />
3.6.3.4 Local values<br />
Anchorage residents generally have a high concern for visual quality, as evidenced by a long<br />
history of opposition to billboards, overhead utilities, <strong>and</strong> some types of signs. Also,<br />
residents in most neighborhoods have dem<strong>and</strong>ed that road projects provide enhancements<br />
such as l<strong>and</strong>scaping <strong>and</strong> trails.<br />
Neighborhoods have become interested in <strong>and</strong> empowered to protect their own immediate<br />
environments as infrastructure projects are undertaken. In Government Hill, this has<br />
manifested itself through vocal community concerns for existing <strong>and</strong> proposed tank farm<br />
development <strong>and</strong> controls for the POA. The community has also been vocal in its concerns<br />
for solutions that will negate neighborhood impacts related to the proposed project. These<br />
concerns are often voiced in terms of aesthetic values such as the care residents take in<br />
maintaining <strong>and</strong> improving neighborhood parks at their own expense.<br />
Although Ship Creek is generally an industrial zone, the area has seen increased use by<br />
anglers, tourists, <strong>and</strong> trail users in recent years. In fact, the Ship Creek area has recently<br />
received rezoning with imposition of design guidelines <strong>and</strong> construction of a number of new<br />
3-152 12/18/07
<strong>Knik</strong> <strong>Arm</strong> Crossing DraftFinal EIS<br />
<strong>Affected</strong> <strong>Environment</strong><br />
visitor-related projects that recognize its future as a visitor destination transportation transfer<br />
area. This has raised the level of concerns for aesthetic issues within the area.<br />
3.6.3.5 Visual character <strong>and</strong> quality<br />
A “key view” approach, as detailed in FHWA’s Visual Impact Assessment for Highway<br />
Projects (1981), was used to assess the existing visual resources of the Study Area. Ten key<br />
views were selected to establish a baseline visual character <strong>and</strong> quality that were then used to<br />
evaluate the impacts of the proposed project (see Section 4.6.3). The key views are<br />
representative of what viewer groups can now see <strong>and</strong> what they could see if the proposed<br />
project were to be built.<br />
Visual character refers to the form, line, color, <strong>and</strong> texture of a key view’s l<strong>and</strong>scape<br />
components. Visual quality refers to the qualitative appraisal of the relative excellence of a<br />
view. The approach used in the evaluation of visual quality includes using vividness,<br />
intactness, <strong>and</strong> unity criteria to indicate the quality of the l<strong>and</strong>scape. The combined result of<br />
all three criteria indicates the degree of quality of the l<strong>and</strong>scape. Key view locations are<br />
designated in Figures 3.38 <strong>and</strong> 3.39. Key view locations <strong>and</strong> visual quality results are<br />
summarized in Table 3-24.<br />
Table 3-24. Key view locations <strong>and</strong> their visual quality<br />
View<br />
number<br />
Key view location<br />
Visual quality<br />
1 Mat-Su gravel road Moderate<br />
2 East across <strong>Knik</strong> <strong>Arm</strong> from the Mat-Su High<br />
3 East Bluff Drive Low to moderate<br />
4 Erickson Street Moderate/Low<br />
5 Degan Street Moderate<br />
6 Harvard Park Moderate to high<br />
7 Sunset Park Moderate to high<br />
8 Port of Anchorage High<br />
9 Ship Creek Low to moderate<br />
10 3rd Avenue <strong>and</strong> Gambell Street Low to moderate<br />
12/18/07 3-153
<strong>Knik</strong> <strong>Arm</strong> Crossing DraftFinal EIS<br />
<strong>Affected</strong> <strong>Environment</strong><br />
Figure 3.38. Locations of key views – the Mat-Su<br />
3-154 12/18/07
<strong>Knik</strong> <strong>Arm</strong> Crossing DraftFinal EIS<br />
<strong>Affected</strong> <strong>Environment</strong><br />
Figure 3.39. Locations of key views – Anchorage<br />
12/18/07 3-155
<strong>Knik</strong> <strong>Arm</strong> Crossing DraftFinal EIS<br />
<strong>Affected</strong> <strong>Environment</strong><br />
Figure 3.40. Key view 1: Looking west-northwest along Point<br />
MacKenzie Road from near the bluffs above Port MacKenzie<br />
Figure 3.40, the first key view, is from a gravel road near Port MacKenzie. The road <strong>and</strong><br />
l<strong>and</strong>scape are typical of the undeveloped Mat-Su l<strong>and</strong>scape in the Study Area. The open<br />
forest consists of white spruce, paper birch, black spruce, <strong>and</strong> quaking aspen with an<br />
understory of devil’s club, low- <strong>and</strong> highbush cranberry, Labrador tea, ledum, willow,<br />
bunchberry dogwood, bluejoint reedgrass, horsetail, prickly rose, etc. Scattered patches of<br />
moss cover the forest floor. The interior lowl<strong>and</strong>s are mostly wetl<strong>and</strong>s of the bog <strong>and</strong> fen<br />
type, consisting of sedge <strong>and</strong> sphagnum mat with ericaceous shrubs <strong>and</strong> occasional st<strong>and</strong>s of<br />
black spruce. While undeveloped <strong>and</strong> natural in appearance, the view is of moderate quality.<br />
Kevin G Smith Photography<br />
Figure 3.41. Key view 2: Looking east-southeast from<br />
above Port MacKenzie, across <strong>Knik</strong> <strong>Arm</strong><br />
Figure 3.41, the second key view, is a view from the bluffs north <strong>and</strong> above Port MacKenzie<br />
looking across <strong>Knik</strong> <strong>Arm</strong> at the bluffs north of the POA, visible across <strong>Knik</strong> <strong>Arm</strong> on the right<br />
side of the photograph. The Chugach Mountains are in the background from this view, <strong>and</strong><br />
3-156 12/18/07
<strong>Knik</strong> <strong>Arm</strong> Crossing DraftFinal EIS<br />
<strong>Affected</strong> <strong>Environment</strong><br />
Anchorage Bowl is to the south. This vista offers a striking, often-photographed view of<br />
urban Anchorage with the mountain backdrop. Key view 2 roughly shows the area where the<br />
proposed KAC bridge would span <strong>Knik</strong> <strong>Arm</strong>. Overall l<strong>and</strong>scape quality is high.<br />
Figure 3.42. Key view 3: East Cook Avenue <strong>and</strong> East Bluff<br />
Drive<br />
Figure 3.42, the third key view, is a view from East Bluff Drive to a vacant area that has<br />
served military <strong>and</strong> port uses in the past. Chugach Electric Association provides<br />
commercial/industrial building types visible in the right side of the photograph. In the<br />
distance are trees located on Elmendorf. To the right, in the background, are the Chugach<br />
Mountains. A chain-link fence with barbed-wire top provides a strongly institutional<br />
character. While the view to the open field provides a view of moderate l<strong>and</strong>scape quality,<br />
the chain-link fence is a compromising element that contributes overall to a view of low to<br />
moderate l<strong>and</strong>scape quality.<br />
12/18/07 3-157
<strong>Knik</strong> <strong>Arm</strong> Crossing DraftFinal EIS<br />
<strong>Affected</strong> <strong>Environment</strong><br />
Figure 3.43. Key view 4: Erickson (from Harvard Avenue<br />
intersection)<br />
Figure 3.43, the fourth key view, illustrates the Erickson Street character, showing residential<br />
use on the west side of the street <strong>and</strong> a hotel on the east side of the street. The west side<br />
shows mature vegetation on small, single-family home lots. Overhead utilities are also visible<br />
on the west side of the street. The view of the east side of the street is dominated by the hotel<br />
that occupies most of the streetfront; it has little vegetation or other elements that could<br />
provide l<strong>and</strong>scape character. The west side of the street is a view of moderate visual quality.<br />
The hotel is a view of low visual quality.<br />
Figure 3.44. Key view 5: Degan Street (from intersection<br />
with Harvard Avenue)<br />
This view of Degan Street (Figure 3.44), the fifth key view, shows a residential district with a<br />
mix of relatively newer <strong>and</strong> older buildings. At the far end of the street, on the right side of<br />
the photograph, is a church served by a parking lot on the left-h<strong>and</strong> side of the street, out of<br />
view in the photograph. Overhead utilities are visible <strong>and</strong> vegetation is mature on many of<br />
3-158 12/18/07
<strong>Knik</strong> <strong>Arm</strong> Crossing DraftFinal EIS<br />
<strong>Affected</strong> <strong>Environment</strong><br />
the lots on the east side of the street. The street is primarily of neighborhood use, excepting<br />
church traffic. It is typical of many Anchorage neighborhoods <strong>and</strong> provides a moderate level<br />
of visual quality.<br />
Figure 3.45. Key view 6: Harvard Park (intersection of<br />
Harvard Avenue <strong>and</strong> Degan Street)<br />
The sixth key view (Figure 3.45) is of Harvard Park <strong>and</strong> the Anchorage Curling Club facility<br />
located near the intersection of Harvard Avenue <strong>and</strong> East Loop Road. The area is actively<br />
used for recreation, including tennis <strong>and</strong> curling. Harvard Park receives residential traffic <strong>and</strong><br />
provides views to the Chugach Mountains in the distance. Foreground views are of the park<br />
<strong>and</strong> nearby residential development. The visual quality of this view is moderate-to-high,<br />
owing to the park setting <strong>and</strong> views to the Chugach Mountains.<br />
Figure 3.46. Key view 7: Sunset Park (intersection of Vine<br />
Avenue <strong>and</strong> Birch Street)<br />
12/18/07 3-159
<strong>Knik</strong> <strong>Arm</strong> Crossing DraftFinal EIS<br />
<strong>Affected</strong> <strong>Environment</strong><br />
Figure 3.46, the seventh key view, is of Sunset Park, in the Government Hill neighborhood.<br />
The view shows an open lawn area with picnic tables <strong>and</strong> play areas. The lawn is surrounded<br />
to the south by a forest of cottonwood trees that form a barrier to longer views to the south.<br />
Visual quality is moderately high given the pastoral setting provided by the lawn <strong>and</strong><br />
bordering trees.<br />
Figure 3.47. Key view 8: Port of Anchorage, facing north<br />
The eighth key view (Figure 3.47) is from the western end of Ship Creek Point, which<br />
functions as the small boat harbor serving Anchorage boaters seeking access to <strong>Knik</strong> <strong>Arm</strong>.<br />
The location affords views to <strong>Knik</strong> <strong>Arm</strong> to the west <strong>and</strong> north, industrial development to the<br />
north <strong>and</strong> east, <strong>and</strong> the skyline of Anchorage to the east <strong>and</strong> south. The Chugach Mountains<br />
are visible in the background. The visual quality is high, given views to <strong>Knik</strong> <strong>Arm</strong>, adjacent<br />
wetl<strong>and</strong>s <strong>and</strong> mud flats, <strong>and</strong> to the Anchorage skyline <strong>and</strong> the Chugach Mountains. The POA<br />
development imposes a conflicting visual element, but is below the skyline of Government<br />
Hill, which is in the middleground.<br />
3-160 12/18/07
<strong>Knik</strong> <strong>Arm</strong> Crossing DraftFinal EIS<br />
<strong>Affected</strong> <strong>Environment</strong><br />
Figure 3.48. Key view 9: Ship Creek, facing north from<br />
the creek’s southern bank<br />
Figure 3.48, the ninth key view, is from the southern bank of Ship Creek looking toward the<br />
north from a location that would be just west of the proposed bridge crossing over the creek.<br />
The view shows vegetation bordering Ship Creek in the immediate foreground, with an open<br />
area adjoining a commercial building barely visible behind the trees located in the right<br />
portion of the image. The density of vegetation precludes views to industrial areas north of<br />
Ship Creek. Ship Creek Trail, under construction, is located along the banks of Ship Creek,<br />
passing through the area in this view.<br />
The view is typical of those in the Ship Creek corridor, with second generation growth of<br />
alder <strong>and</strong> cottonwood. Even though Ship Creek is partly visible through openings in the<br />
cottonwood <strong>and</strong> alder brush, visual quality is low–to-moderate because of the restricted<br />
views to foreground elements of little interest <strong>and</strong> the character of the adjoining World Trade<br />
Center commercial/industrial development.<br />
12/18/07 3-161
<strong>Knik</strong> <strong>Arm</strong> Crossing DraftFinal EIS<br />
<strong>Affected</strong> <strong>Environment</strong><br />
Figure 3.49. Key view 10: Third Avenue toward Ingra <strong>and</strong><br />
Gambell Streets, facing east<br />
Figure 3.49, the tenth key view, is of the 3rd Avenue <strong>and</strong> Gambell Street intersection. A<br />
vacant lot behind chain-link fencing in the foreground is the remnant of a hospital that was<br />
razed in the early 1990s. Beyond the open lot is a greenbelt of trees that follows the contours<br />
at the top of the bluff that frames the south side of the Ship Creek valley. The lot shown in<br />
the photo is atypical of the general area because almost all l<strong>and</strong> within the immediate vicinity<br />
have been developed over many years, while this lot has remained undeveloped, in<br />
anticipation <strong>and</strong> accordance with the Official Streets <strong>and</strong> Highway Plan (MOA 1996b), that a<br />
roadway improvement project will extend Gambell <strong>and</strong> Ingra Streets into the Ship Creek<br />
area. The general area fronting 3rd Avenue, as shown in Figure 3.37, is typified by<br />
residential buildings transitioning to commercial use, as well as by small commercial<br />
structures that have in-filled where residences had been. Five-foot-wide sidewalks are located<br />
on both sides of 3rd Avenue. Visual quality is low-to-moderate, owing to the residential<br />
character of the general neighborhood <strong>and</strong> the distant views to the Chugach Mountains.<br />
Views are diminished in quality by the presence of overhead powerlines <strong>and</strong> the chain-link<br />
fencing with barbed-wire top.<br />
3.7 Section 4(f) Resources<br />
This section provides information on properties known as Section 4(f) resources, which<br />
include parks, recreation areas, wildlife <strong>and</strong> waterfowl refuges, <strong>and</strong> publicly or privately<br />
owned historic properties. Section 3.6.1 provides greater detail on archaeology <strong>and</strong> historic<br />
preservation. Section 3.6.2 has more information regarding recreation resources, parks, <strong>and</strong><br />
wildlife refuges in the Study Area.<br />
3-162 12/18/07
<strong>Knik</strong> <strong>Arm</strong> Crossing DraftFinal EIS<br />
<strong>Affected</strong> <strong>Environment</strong><br />
Section 4(f) of the Department of Transportation Act (1966) (as amended), 23 U.S.C. § 138,<br />
states:<br />
The Secretary shall not approve any program or project (other than any project for a<br />
park road or parkway under Section 204 of this title) which requires the use of any<br />
publicly owned l<strong>and</strong> from a public park, recreation area, or wildlife <strong>and</strong> waterfowl<br />
refuge of national, State, or local significance as determined by the Federal, State, or<br />
local officials having jurisdiction thereof, or any l<strong>and</strong> from an historic site of national,<br />
State, or local significance as so determined by such officials unless (1) there is no<br />
feasible <strong>and</strong> prudent alternative to the use of such l<strong>and</strong>, <strong>and</strong> (2) such program includes<br />
all possible planning to minimize harm to such park, recreational area, wildlife <strong>and</strong><br />
waterfowl refuge, or historic site resulting from such use.<br />
A separate Draft Section 4(f) Evaluation, located at the back of this Draft EIS, responds to<br />
the Section 4(f) requirements. This section summarizes information on the Section 4(f)<br />
resources.<br />
The Study Team investigated all parks, recreation areas, <strong>and</strong> wildlife <strong>and</strong> waterfowl refuges<br />
in the Study Area <strong>and</strong> focused on those that would be affected by implementation of the<br />
alignments <strong>and</strong> their proposed access-controlled rights-of-way. In addition, Study Team<br />
history specialists reviewed the Study Area with a complete literature search, “windshield<br />
surveys,” <strong>and</strong> follow-up field research <strong>and</strong> investigations of hundreds of buildings,<br />
properties, <strong>and</strong> sites. FHWA, in consultation with SHPO, has concluded that four areas of<br />
Government Hill qualify as historic districts <strong>and</strong> that there are six individually eligible<br />
properties on Government Hill. Figure 3.50 shows the Government Hill Historic Districts <strong>and</strong><br />
eligible properties, <strong>and</strong> the multiple parks considered. See Sections 3.6.1 <strong>and</strong> 4.6.1 of the<br />
Draft EIS regarding historic properties <strong>and</strong> applicability of NHPA Section 106 <strong>and</strong><br />
EO 13175, which requires consultation <strong>and</strong> coordination with Indian or Alaska Native tribal<br />
governments. See also Sections 3.6.2 <strong>and</strong> 4.6.2 of the Draft EIS for related information<br />
regarding park, recreation, <strong>and</strong> wildlife refuge resources in <strong>and</strong> around the Study Area.<br />
FHWA has determined that two parks, one recreation area, one residential area that qualifies<br />
as a historic district, <strong>and</strong> one building individually eligible for the National Register of<br />
Historic Places would be affected by implementation of the project alternatives <strong>and</strong> would be<br />
subject to Section 4(f) protection. These are listed in Table 3-25 <strong>and</strong> shown in Figures 3.51<br />
<strong>and</strong> 3.52.<br />
12/18/07 3-163
<strong>Knik</strong> <strong>Arm</strong> Crossing DraftFinal EIS<br />
<strong>Affected</strong> <strong>Environment</strong><br />
Figure 3.50. Section 4(f) Study Area<br />
3-164 12/18/07
<strong>Knik</strong> <strong>Arm</strong> Crossing DraftFinal EIS<br />
<strong>Affected</strong> <strong>Environment</strong><br />
Figure 3.51. Section 4(f) resources – the Mat-Su<br />
12/18/07 3-165
<strong>Knik</strong> <strong>Arm</strong> Crossing DraftFinal EIS<br />
<strong>Affected</strong> <strong>Environment</strong><br />
Figure 3.52. Section 4(f) resources – Anchorage<br />
3-166 12/18/07
<strong>Knik</strong> <strong>Arm</strong> Crossing DraftFinal EIS<br />
<strong>Affected</strong> <strong>Environment</strong><br />
Table 3-25. Applicable Section 4(f) resources: size, l<strong>and</strong> status, <strong>and</strong> features<br />
Resource<br />
Point MacKenzie<br />
Recreational<br />
Trailhead<br />
Size<br />
(acres)<br />
Harvard Park 4.65<br />
Sunset Park 5.45<br />
ARREC/Square &<br />
Round Dance Club<br />
Government Hill<br />
Urban Renewal<br />
Historic District<br />
a<br />
ARRC = Alaska Railroad Corporation<br />
L<strong>and</strong> status<br />
1.61 Mat-Su Borough l<strong>and</strong><br />
ARRC a lease to<br />
Municipality of Anchorage<br />
Parks<br />
Municipality of<br />
Anchorage-dedicated<br />
park l<strong>and</strong><br />
ARRC owns the l<strong>and</strong>,<br />
Municipality of Anchorage<br />
owns the building<br />
Privately owned<br />
residential parcels<br />
Features<br />
Gravel parking lot configured for<br />
snowmachine trailers, with<br />
informational kiosk<br />
Basketball court, tennis courts,<br />
automobile parking, open space areas<br />
Playground equipment, picnic shelter,<br />
picnic table area, sledding area,<br />
automobile parking, open space<br />
areas, historic site of school damaged<br />
by 1964 earthquake<br />
Historic social hall for Alaska Railroad<br />
families <strong>and</strong> teens. Contains dance<br />
hall, stage, meeting rooms.<br />
Residences<br />
FHWA determined that other potential Section 4(f) properties would not be affected by<br />
project alternatives. Further detail is included in the separate Draft Section 4(f) Evaluation.<br />
3.8 Natural <strong>Environment</strong><br />
3.8.1 Surface Water Resources<br />
<strong>Knik</strong> <strong>Arm</strong>, north of Point MacKenzie, draws on a total watershed of approximately<br />
4,570 square miles. The watershed consists of three main subwatersheds: the <strong>Knik</strong>-<br />
Matanuska Watershed, the Southeast Watershed, <strong>and</strong> the Northwest Watershed (Figure 3.53).<br />
The <strong>Knik</strong>-Matanuska Watershed encompasses the major portion of the area (3,250 square<br />
miles) <strong>and</strong> lies east of the upper end of <strong>Knik</strong> <strong>Arm</strong> <strong>and</strong> includes the <strong>Knik</strong> <strong>and</strong> Matanuska<br />
Rivers. The Southeast Watershed (725 square miles) includes Anchorage <strong>and</strong> the front range<br />
of the Chugach Mountains <strong>and</strong> is drained by Ship <strong>and</strong> Peters Creeks, the Eagle <strong>and</strong> Eklutna<br />
Rivers, <strong>and</strong> several smaller tributaries. The Northwest Watershed (385 square miles) includes<br />
Point MacKenzie <strong>and</strong> the <strong>Knik</strong>/Goose Bay area <strong>and</strong> is drained by Goose, Fish, Cottonwood,<br />
<strong>and</strong> Wasilla Creeks. The remainder of the area (210 square miles) is occupied by <strong>Knik</strong> <strong>Arm</strong><br />
proper <strong>and</strong> the large delta at the mouth of the Matanuska <strong>and</strong> <strong>Knik</strong> Rivers (HNTB 1972).<br />
12/18/07 3-167
<strong>Knik</strong> <strong>Arm</strong> Crossing DraftFinal EIS<br />
<strong>Affected</strong> <strong>Environment</strong><br />
3.8.1.1 The Mat-Su<br />
3.8.1.1.1 Water bodies (lakes, streams, ponds)<br />
Within the Mat-Su, three river systems, the Susitna, Matanuska, <strong>and</strong> <strong>Knik</strong>, provide the<br />
majority of the freshwater entering Upper Cook Inlet during spring, summer, <strong>and</strong> fall<br />
(Mat-Su Borough 2005f) (Figure 3.53). With their headwaters in the mountains, these large<br />
rivers are fed by glaciers. Other water bodies of importance for fisheries include Wasilla<br />
Creek, Cottonwood Creek, Willow Creek, Fish Creek, <strong>and</strong> Little Susitna River. The average<br />
discharge for these rivers is typically exceeded in the months of May through September,<br />
when rainfall, glacier melt, <strong>and</strong> snowmelt are at a maximum. Peak flows typically occur in<br />
June, July, <strong>and</strong> August. As temperatures decrease in October <strong>and</strong> precipitation turns to snow,<br />
the glacier melt <strong>and</strong> snowmelt are dramatically reduced.<br />
Lowest flows typically occur in February <strong>and</strong> March. All streams freeze over, <strong>and</strong> many of<br />
the smaller ones freeze to their bed. Streams in the Study Area typically begin to freeze over<br />
in late October or early November <strong>and</strong> do not break up until late April or May (Mat-Su<br />
Borough 2005f).<br />
There are over 22 lakes in the Mat-Su portion of the Study Area. The largest of these include<br />
Big Lake, Wasilla Lake, <strong>and</strong> Nancy Lake, which are all used for recreation (Mat-Su<br />
Borough 2005f). Most lakes feed small streams <strong>and</strong>, therefore, contribute to their flow<br />
regulation (Mat-Su Borough 2005f).<br />
Three surface water bodies exist within the immediate Mat-Su portion of the Study Area:<br />
Lake Lorraine, located approximately 1 mile west of <strong>Knik</strong> <strong>Arm</strong> <strong>and</strong> 500 feet north of the<br />
existing Point MacKenzie Road; Twin Isl<strong>and</strong> Lake, located approximately 1¾ miles<br />
northwest of Lake Lorraine <strong>and</strong> 1,000 feet east of Point MacKenzie Road; <strong>and</strong> Lost Lake,<br />
located approximately 1,000 feet north of Twin Isl<strong>and</strong> Lake <strong>and</strong> 3,500 feet east of Point<br />
MacKenzie Road (Figure 3.53). The three lakes are all partially bordered by wetl<strong>and</strong> areas<br />
with no distinct inflow or outflow channels. The surface area of each of these lakes is<br />
approximately 0.2–0.3 square mile. Numerous smaller, unnamed lakes <strong>and</strong> ponds exist<br />
between <strong>Knik</strong> <strong>Arm</strong> <strong>and</strong> along Point MacKenzie Road. Two are located just south of Twin<br />
Isl<strong>and</strong> Lake <strong>and</strong> near Point MacKenzie Road, while several smaller lakes are located between<br />
Twin Isl<strong>and</strong> Lake <strong>and</strong> Lake Lorraine. Two additional smaller unnamed lakes are located<br />
northeast of Lake Lorraine.<br />
Existing mapping shows an unnamed stream crossing the Study Area in the vicinity of Twin<br />
Isl<strong>and</strong> Lake (Figure 3.53). Field investigations, however, determined that there was no<br />
discernable stream channel present (KABATA 2006q). The area is considered a wetl<strong>and</strong> bog<br />
<strong>and</strong> is included in the discussion of wetl<strong>and</strong>s in Section 3.8.2.<br />
3-168 12/18/07
<strong>Knik</strong> <strong>Arm</strong> Crossing DraftFinal EIS<br />
<strong>Affected</strong> <strong>Environment</strong><br />
Figure 3.53. Study area water bodies <strong>and</strong> streams<br />
12/18/07 3-169
<strong>Knik</strong> <strong>Arm</strong> Crossing DraftFinal EIS<br />
<strong>Affected</strong> <strong>Environment</strong><br />
3.8.1.1.2 Water quality<br />
While most water bodies in the Mat-Su portion of the Study Area are assumed to have good<br />
water quality, two water bodies in the Mat-Su area are reported as impaired in the Alaska<br />
Integrated Water Quality Monitoring <strong>and</strong> Assessment Report (ADEC 2003). Cottonwood<br />
Creek <strong>and</strong> the Matanuska River are both identified as Category 5, Clean Water Act (CWA)<br />
Section 303(d) impaired water bodies requiring establishment of total maximum daily loads<br />
(TMDL). 39<br />
The entire 13-mile stretch of Cottonwood Creek is listed for nonattainment of the residues<br />
st<strong>and</strong>ard for foam <strong>and</strong> debris; this has been observed to be a recurring problem, with foam<br />
being observed in the creek in 1998, 2000, 2001, <strong>and</strong> 2002. The origin of the foam is<br />
unknown, but there are numerous homes along its course using septic systems. Urban runoff<br />
<strong>and</strong> urban development are listed as the most probable causes of degradation.<br />
A one-half-mile section of the Matanuska River is listed on the 2003 Section 303(d) list for<br />
nonattainment of the residues st<strong>and</strong>ard for debris. There is an active open dump located on<br />
<strong>and</strong> within the waters of the Matanuska River just north of Eagle River Drive in Palmer.<br />
Visible refuse includes vehicles, household refuse, fuel cans, possible 55-gallon drums with<br />
unknown contents, <strong>and</strong> miscellaneous metal debris. Sheens have also been observed on the<br />
river.<br />
Most water bodies within the Mat-Su portion of the Study Area have not been studied.<br />
However, USGS did conduct water quality sampling on Lake Lorraine in 1981 <strong>and</strong> 1982<br />
(Glass 1983). Based on the study, Lake Lorraine has a maximum depth of 24 feet <strong>and</strong> good<br />
water quality conditions.<br />
Existing pollutant sources<br />
Existing water pollutant sources in the Mat-Su portion of the Study Area are limited <strong>and</strong> are<br />
primarily nonpoint sources. Pollutant runoff from roadways, including deicing substances<br />
<strong>and</strong> vehicle fluids, exists in developed areas. Runoff from residential development could<br />
include nutrients <strong>and</strong> chemicals from lawns, illicit discharges of household hazardous waste,<br />
<strong>and</strong> gray water/sewage from faulty septic systems. Recreational activities on water bodies,<br />
such as boating <strong>and</strong> personal watercraft operation, have the potential to affect water quality<br />
through accidental fuel spills <strong>and</strong> output from two-stroke engines.<br />
39 A TMDL is a process through which pollution sources are identified. The study analyzes pollution sources of<br />
a water body <strong>and</strong> calculates the amount, or “load,” of that specific pollutant that the water can receive <strong>and</strong> still<br />
maintain Water Quality St<strong>and</strong>ards. TMDLs are a necessary first step toward water body recovery <strong>and</strong> are<br />
required for a water body to be “delisted” from the Alaska 303(d) Category 5 Impaired Waters List<br />
(ADEC 2005).<br />
3-170 12/18/07
<strong>Knik</strong> <strong>Arm</strong> Crossing DraftFinal EIS<br />
<strong>Affected</strong> <strong>Environment</strong><br />
3.8.1.2 <strong>Knik</strong> <strong>Arm</strong><br />
3.8.1.2.1 Hydrology – tides<br />
<strong>Knik</strong> <strong>Arm</strong> experiences the second-largest tidal range in the world—approximately 30 feet.<br />
Tides are semidiurnal, with two unequal high tides <strong>and</strong> two unequal low tides per day. The<br />
range of tides at Anchorage is 29 feet <strong>and</strong> the observed extreme low water is 6.4 feet below<br />
MLLW (Table 3-26). Tidal energy is the most dominant force driving water circulation in<br />
<strong>Knik</strong> <strong>Arm</strong>. Because of predominantly shallow depths, tides within <strong>Knik</strong> <strong>Arm</strong> have a much<br />
larger range than in the main body of Cook Inlet (KABATA 2006r).<br />
Table 3-26. Anchorage tidal data<br />
Tidal measure<br />
Abbreviation<br />
Magnitude<br />
(in feet with<br />
respect to MLLW)<br />
Highest observed water level (October 24, 1980) NA a 34.6<br />
Mean higher high water MHHW 29.2<br />
Mean high water MHW 28.4<br />
Mean sea level MSL 16.5<br />
Mean tide level MTW 15.3<br />
Mean low water MLW 2.2<br />
Mean lower low water MLLW 0.0<br />
Lowest observed water level (December 25, 1999) NA a -6.4<br />
a not applicable<br />
Source: NOAA 2004<br />
3.8.1.2.2 Hydrology – currents<br />
Currents in the Study Area are primarily influenced by tidal flow. However, freshwater<br />
inputs into the <strong>Knik</strong> <strong>Arm</strong> result in a stronger ebb (westerly) flow than flood (easterly) flow<br />
(KABATA 2006r). Maximum current speeds in <strong>Knik</strong> <strong>Arm</strong>, observed during spring ebb tide,<br />
exceed 7 knots (12 feet/second) <strong>and</strong> are approximately 6 knots (10 feet/second) within the<br />
Study Area. Maximum current speeds persist for about an hour before subsiding to near-zero<br />
speed <strong>and</strong> then reversing. The time between slack water times is about 6.2 hours.<br />
3.8.1.2.3 Hydrology –sea ice<br />
When air temperatures begin to drop below 20°F, sea ice begins to form in <strong>Knik</strong> <strong>Arm</strong> as<br />
frazil (loose, r<strong>and</strong>omly oriented ice crystals), but will not persist because of wind or tidal<br />
mixing of the water column. By late November, ice in <strong>Knik</strong> <strong>Arm</strong> typically will be either new<br />
or frazil-formed “shuga,” or pancake ice sheets (up to 4 inches thick). Shuga ice can cover up<br />
to 50 percent of the area of Upper Cook Inlet by the end of December. In spite of the<br />
coverage, ice in <strong>Knik</strong> <strong>Arm</strong> rarely forms columnar layers of crystals because of tidal<br />
turbulence. Nonetheless, ice rafts (formed from fusion of these pancake ice sheets) <strong>and</strong> brash<br />
ice (ice that has been broken up by turbulent tidal movement) as thick as 2½ feet thick has<br />
been reported in the Upper Cook Inlet area (Mulherin et al. 2001).<br />
Ice forming in <strong>Knik</strong> <strong>Arm</strong> will typically not be as strong as the river ice entering from the<br />
<strong>Knik</strong> <strong>and</strong> Matanuska Rivers or from other contributing drainages, but will be comparably<br />
12/18/07 3-171
<strong>Knik</strong> <strong>Arm</strong> Crossing DraftFinal EIS<br />
<strong>Affected</strong> <strong>Environment</strong><br />
stronger than ice formed in the main body of the inlet, where salinity is greater<br />
(Michel 1978). Outgoing tides carry ice out of the <strong>Knik</strong> <strong>Arm</strong> <strong>and</strong> mix it with ice from other<br />
sources in the main body of Cook Inlet before it flows back into <strong>Knik</strong> <strong>Arm</strong>. Ice also develops<br />
on the tidal flats during tidal inundations, particularly as the tide flows out from the flats. The<br />
resulting frozen material comprises the majority of any l<strong>and</strong>-fast ice that may be encountered<br />
in <strong>Knik</strong> <strong>Arm</strong>.<br />
Ice also forms on structures placed into either the tidal flats or offshore, much in the same<br />
manner as beach ice. Cold metal pilings are particularly susceptible to ice formation, <strong>and</strong><br />
successive layers of structural ice coatings will form enlarged “ice collars” that increase the<br />
cross-sectional width of such pilings. When these “collars” thaw, they may release essentially<br />
intact <strong>and</strong> are thus capable of damage to their host structure (KABATA 2006r).<br />
3.8.1.2.4 Hydrology – sedimentation<br />
Bluff erosion <strong>and</strong> glacially fed rivers are the primary contributors to the sediment load of<br />
<strong>Knik</strong> <strong>Arm</strong> waters. The <strong>Knik</strong> <strong>and</strong> Matanuska Rivers contribute the largest suspended load to<br />
<strong>Knik</strong> <strong>Arm</strong>, with average summer loads (mid-May to mid-October) estimated at 6.84 million<br />
tons <strong>and</strong> 5.45 million tons, respectively. Additionally, the bluffs along <strong>Knik</strong> <strong>Arm</strong> are<br />
believed to provide a significant contribution to the inlet water sediment load<br />
(KABATA 2006r). The bluffs originally formed as a result of tidal forces cutting through the<br />
area following glacial withdrawal (Lade 1985), <strong>and</strong> are being continuously eroded by wind,<br />
rain, slope failure, <strong>and</strong> intermittent exposure of the toe to wave action.<br />
Smith et al. (2005) conclude that <strong>Knik</strong> <strong>Arm</strong> has two distinct types of sediment transport in<br />
the vicinity of the proposed crossing alignment. S<strong>and</strong>y bed sediment is transported along the<br />
bed surface, <strong>and</strong> finer silt <strong>and</strong> clay particles remain in suspension <strong>and</strong> are carried past the<br />
corridor of the proposed crossing location by prevalent strong tidal currents.<br />
KABATA (2006r) <strong>and</strong> Smith et al. (2005) report that s<strong>and</strong> is the dominant material of the<br />
bed in the vicinity of the proposed crossing <strong>and</strong> is transported through this area in large<br />
patches of mobile s<strong>and</strong> waves. Areas of coarser material do exist (e.g., the west channel sideslope),<br />
which suggests that currents in this area are consistently strong enough to sweep<br />
smaller particles away. Little of the Study Area appears naturally prone to accumulation of<br />
silt <strong>and</strong> clay. Isolated areas dominated by silt appear in deeper areas of the channel <strong>and</strong> on the<br />
southeast tidel<strong>and</strong>s of the proposed crossing corridor.<br />
In areas of the <strong>Knik</strong> <strong>Arm</strong> where water velocity is sufficiently low, such as areas of shallow<br />
water or around natural or human-made protrusions, suspended fines can settle from the<br />
water column <strong>and</strong> deposit on the seafloor. Protrusions into <strong>Knik</strong> <strong>Arm</strong> function essentially like<br />
groins, with sediment accumulating until stable “fillets” are formed on both sides. One<br />
example in the vicinity of the Study Area is the Port MacKenzie dock, which protrudes<br />
850 feet from the shoreline to a water depth of about 40 feet. The sediment fillets that formed<br />
on both sides extend about 1,000 feet along the original shoreline <strong>and</strong> appear to have reached<br />
a stable form within 2 years after dock construction.<br />
3-172 12/18/07
<strong>Knik</strong> <strong>Arm</strong> Crossing DraftFinal EIS<br />
<strong>Affected</strong> <strong>Environment</strong><br />
3.8.1.2.5 Sixmile Creek<br />
During low tide, Sixmile Creek flows within a confined intertidal channel within <strong>Knik</strong> <strong>Arm</strong>.<br />
Until recently, Sixmile Creek’s tidel<strong>and</strong> channel was outside the Study Area, running directly<br />
westward <strong>and</strong> perpendicular to the coastal bluffs. However, for unknown reasons sometime<br />
after May 18, 2005 (most recent aerial photo coverage date) the course of the intertidal<br />
channel changed <strong>and</strong> now runs through the Study Area. It now flows south in a broad,<br />
dispersed, shallow channel approximately 150 to 300 feet seaward of the toe of the bluff for<br />
approximately 2.5 miles before reaching MLLW offshore from Cairn Point. This change in<br />
tidel<strong>and</strong> channel location is unprecedented, based on observations from intermittent aerial<br />
photo coverage at low tide over the past 50 years.<br />
3.8.1.2.6 Water quality<br />
The waters of <strong>Knik</strong> <strong>Arm</strong> are generally described as brackish, with salinities ranging from<br />
10 to 12 practical salinity units (PSU, equivalent to grams of dissolved solids per kilogram of<br />
seawater) at Fire Isl<strong>and</strong> (Gatto 1976) <strong>and</strong> 4 to 6 PSU north of Cairn Point. Water<br />
temperatures in <strong>Knik</strong> <strong>Arm</strong> range from freezing (about 31°F) to 63°F or more (in surface<br />
pockets observed during the summer months). Measurements of suspended sediment at<br />
several locations from near the river mouths to Point Woronzof tend to be similar, showing<br />
concentrations of up to 1,000 mg/L between water surface <strong>and</strong> depths of 15 feet, then<br />
increasing to more than 4,000 mg/L at greater depths (Smith 2005).<br />
Water quality data were collected from <strong>Knik</strong> <strong>Arm</strong> at control locations north of Point<br />
MacKenzie <strong>and</strong> in the vicinity of Point Woronzof. These samples were taken as part of the<br />
AWWU Asplund Waste Water Treatment Facility (WWTF) National Pollutant Discharge<br />
<strong>and</strong> Elimination System (NPDES) permit receiving water monitoring program (Kinnetic<br />
Laboratories, Inc. [KLI] 2000, 2001, 2002, 2003, 2004, 2005). The main notable<br />
characteristic of all the surveys was that the water column was found to be vertically wellmixed<br />
from top to bottom. Measurements of temperature, salinity, dissolved oxygen, pH, <strong>and</strong><br />
trace metals <strong>and</strong> cyanide fell within the ranges specified in the State of Alaska Water Quality<br />
St<strong>and</strong>ards (AWQS).<br />
Total aromatic hydrocarbons (TAH) analyses performed for AWWU’s Asplund monitoring<br />
program were determined by summing benzene, ethylbenzene, toluene, <strong>and</strong> total xylenes<br />
(BETX), as specified in the AWQS. Between 1999 <strong>and</strong> 2005, all total aromatic hydrocarbon<br />
results were less than the reporting limit <strong>and</strong> well below the receiving water st<strong>and</strong>ard.<br />
Concentrations of total aqueous hydrocarbons (TAqH), as defined in the AWQS, were also<br />
well below the receiving water quality st<strong>and</strong>ard. The average natural turbidity of Upper Cook<br />
Inlet <strong>and</strong> <strong>Knik</strong> <strong>Arm</strong> is typically in the range of 400 to 600 nephelometric turbidity units<br />
(NTUs) <strong>and</strong>, thus, naturally exceeds the State’s water quality criterion.<br />
Existing pollutant sources<br />
Existing point source inputs into the <strong>Knik</strong> <strong>Arm</strong> region include Anchorage’s Asplund WWTF,<br />
Anchorage’s Eagle River WWTF, Palmer WWTF, <strong>and</strong> the discharges from Fort Richardson<br />
<strong>and</strong> Elmendorf. The Asplund WWTF discharges primary treated effluent from the Anchorage<br />
area into <strong>Knik</strong> <strong>Arm</strong> offshore of Point Woronzof; the Eagle River WWTF discharges<br />
12/18/07 3-173
<strong>Knik</strong> <strong>Arm</strong> Crossing DraftFinal EIS<br />
<strong>Affected</strong> <strong>Environment</strong><br />
secondary treated effluent into Eagle River, which enters <strong>Knik</strong> <strong>Arm</strong>; the Palmer WWTF<br />
discharges secondary treated effluent into the Matanuska River, which flows into <strong>Knik</strong> <strong>Arm</strong>;<br />
<strong>and</strong> the two military bases discharge into Anchorage’s wastewater treatment system, which is<br />
processed by the Asplund WWTF. Wastewater from the Wasilla WWTF is discharged to a<br />
State of Alaska-permitted, 9-acre drain field, <strong>and</strong> no pollutants from this source enter <strong>Knik</strong><br />
<strong>Arm</strong>.<br />
Eight polluted water bodies flow into <strong>Knik</strong> <strong>Arm</strong> <strong>and</strong> serve as sources of water pollution into<br />
<strong>Knik</strong> <strong>Arm</strong>. Cottonwood Creek <strong>and</strong> the Matanuska River input near the head of <strong>Knik</strong> <strong>Arm</strong>.<br />
Eagle River inputs into <strong>Knik</strong> <strong>Arm</strong> north of Anchorage. Five creeks—Ship, Campbell,<br />
Chester, Fish, <strong>and</strong> Little Campbell—input into <strong>Knik</strong> <strong>Arm</strong> from Anchorage. Water quality<br />
information on these five water bodies is given below.<br />
3.8.1.3 Anchorage<br />
3.8.1.3.1 Water bodies (lakes, streams, ponds)<br />
Major water bodies on the east side of <strong>Knik</strong> <strong>Arm</strong> (Anchorage area) include Ship Creek, the<br />
Eagle River, Peters Creek, Sixmile Creek, <strong>and</strong> the Eklutna River (Figure 3.53). The Eagle<br />
River is a glacial waterway that originates at the base of the Eagle Glacier in the Chugach<br />
Mountains. Eagle River discharge is generally high from June through September. A midsummer<br />
peak discharge coincides with the maximum melting of Eagle Glacier followed by a<br />
later peak in response to early fall precipitation (U.S. <strong>Arm</strong>y 2004). Lowest discharge is from<br />
December through April (USGS 2005). Important lakes within the Anchorage area include<br />
Sixmile Lake, Eklutna Lake, Mirror Lake, <strong>and</strong> Beach Lake.<br />
Perennial streams within the Anchorage portion of the Study Area include Ship Creek, the<br />
mouth of Sixmile Creek, <strong>and</strong> Cherry Hill Ditch. Ship Creek is a nonglacial stream that<br />
originates at Ship Lake in the Chugach Mountains <strong>and</strong> flows to <strong>Knik</strong> <strong>Arm</strong>. Numerous water<br />
diversions from Ship Creek occur as it flows through Fort Richardson, Elmendorf, <strong>and</strong><br />
Anchorage. Sixmile Creek occupies a valley created by an old channel of the Eagle River.<br />
Sixmile Creek was once a spring-fed stream, <strong>and</strong> is now flooded for most of its length by<br />
Upper <strong>and</strong> Lower Sixmile Lakes (Rothe et al. 1983). Cherry Hill Ditch, a smaller stream<br />
draining the developed areas of Elmendorf, flows to the eastern side of the POA before being<br />
diverted into a storm drainage structure <strong>and</strong> flowing west into <strong>Knik</strong> <strong>Arm</strong>.<br />
Intermittent streams are present along the coastal bluff from the POA north to Cairn Point.<br />
These seasonal streams are typically high-gradient, low-flow streams with gravel or cobble<br />
streambed substrate. A small pond is also located north of Ship Creek <strong>and</strong> south of Whitney<br />
Road. Figure 3.53 shows the water bodies in the Anchorage <strong>and</strong> Mat-Su portions of the<br />
Study Area.<br />
3.8.1.3.2 Water quality<br />
According to ADEC’s Integrated Water Quality Assessment Report, five Anchorage-area<br />
creeks—Ship, Campbell, Chester, Fish, <strong>and</strong> Little Campbell—are identified as Category 5,<br />
CWA Section 303(d) impaired water bodies requiring TMDL (ADEC 2003).<br />
3-174 12/18/07
<strong>Knik</strong> <strong>Arm</strong> Crossing DraftFinal EIS<br />
<strong>Affected</strong> <strong>Environment</strong><br />
Ship Creek flows through the Study Area <strong>and</strong> according to ADEC (2003), the water quality<br />
of the creek is degraded as it flows from its source to its mouth. However, only the section of<br />
the creek from the Glenn Highway <strong>Bridge</strong> to the mouth is listed as impaired. This section of<br />
Ship Creek was originally placed on the 1990 Section 303(d) list <strong>and</strong> is now listed for<br />
nonattainment of the fecal coliform bacteria, petroleum hydrocarbon, <strong>and</strong> oil <strong>and</strong> grease<br />
water quality st<strong>and</strong>ards. Urban runoff from storm drain outfalls <strong>and</strong> industrial activity are<br />
thought to be major contributors to the degradation. Ship Creek water samples contained<br />
several metals; however, only aluminum was detected at concentrations exceeding the<br />
National Recommended Water Quality Criteria for freshwater. Other water quality<br />
constituents were all found to be below the method reporting limits (Hart Crowser 2004).<br />
According to the Anchorage Wetl<strong>and</strong>s Atlas, four storm drains currently discharge into Ship<br />
Creek in the vicinity of the A-C Viaduct (MOA 2004d).<br />
Campbell Creek has been on the Section 303(d) list since 1990 for nonattainment of the fecal<br />
coliform bacteria st<strong>and</strong>ard. A water quality assessment was completed for Campbell Creek<br />
in 1994 that identified several additional parameters of concern, including temperature,<br />
turbidity, zinc, <strong>and</strong> lead. Urban runoff is thought to be the major contributor to the<br />
degradation to this creek. Chester, Fish, <strong>and</strong> Little Campbell Creeks have also been on the<br />
Section 303(d) list since 1990 for nonattainment of the fecal coliform st<strong>and</strong>ard<br />
(ADEC 2003).<br />
The Eagle River is listed in the report as a Category 4a water body, which is identified as<br />
impaired but not in need of a TMDL. The Eagle River is unique because it was never listed<br />
as a Section 303(d) water body; however, a total maximum daily load for ammonia <strong>and</strong><br />
metals was completed by USEPA on April 12, 1995, for the wastewater treatment plant that<br />
discharges to the river (ADEC 2003).<br />
Existing pollutant sources<br />
Pollutants <strong>and</strong> their sources have been studied extensively over recent years in Anchorage.<br />
Although many pollutants exist, the primary pollutants of concern are chloride, sediment,<br />
metals, petroleum products, oil <strong>and</strong> lubricants, toxics, <strong>and</strong> pathogens (MOA Watershed<br />
Management Services [WMS] 2004e). Chloride sources include street applications, primarily<br />
salt used in winter street s<strong>and</strong>, <strong>and</strong> magnesium chloride deicer. Particulate pollutants come<br />
from street <strong>and</strong> l<strong>and</strong> development carried by stormwater runoff <strong>and</strong> in-stream channel<br />
erosion. Metals, petroleum products, oil <strong>and</strong> lubricants <strong>and</strong> toxics are pollutants that are most<br />
commonly found adsorbed to streets sediments. Although there are a wide range of potential<br />
sources for pathogens, the most probable source is pets <strong>and</strong> urban wildlife.<br />
Since January 5, 1999, Anchorage, with co-applicant ADOT&PF, has been operating under a<br />
permit to discharge from all municipal separate storm sewer outfalls (NPDES Permit<br />
No. AKS 05255-8 “NPDES Permit for Storm Water Discharges from the Municipal Separate<br />
Storm Sewer System of Anchorage Alaska”). The permit requires Anchorage to organize <strong>and</strong><br />
manage programs to ensure receiving waters are protected from pollutants traveling through<br />
the Municipal separate storm sewer system. This permit expired, <strong>and</strong> USEPA, the<br />
12/18/07 3-175
<strong>Knik</strong> <strong>Arm</strong> Crossing DraftFinal EIS<br />
<strong>Affected</strong> <strong>Environment</strong><br />
Municipality, <strong>and</strong> ADOT&PF are drafting the new permit <strong>and</strong> conditions. In the interim, the<br />
original permit is in effect.<br />
In the vicinity of the POA, a number of nonpoint source inputs of pollution have been<br />
identified. The POA is operated under an NPDES permit (AK-05255-8) developed for the<br />
Municipality. POA uses specific pollution prevention measures during construction <strong>and</strong><br />
operation <strong>and</strong> follows a stormwater management program that includes monitoring. POA is<br />
currently coordinating with USEPA for a site-specific NPDES permit (Anchorage Port<br />
Expansion Team [APET] 2005). There are four major stormwater drains on POA’s property:<br />
North TOTE (Totem Ocean Trailer Express Inc.), TOTE, Horizon/Cherry Hill, <strong>and</strong> Tesoro<br />
systems. The Horizon/Cherry Hill drainage system provides storm runoff for most of<br />
Elmendorf <strong>and</strong> drains through the POA on its way to <strong>Knik</strong> <strong>Arm</strong> (APET 2005).<br />
3.8.2 Wetl<strong>and</strong>s<br />
EO 11990, “Protection of Wetl<strong>and</strong>s,” <strong>and</strong> Section 404 of the Clean Water Act require FHWA<br />
to avoid <strong>and</strong> minimize adverse effects on wetl<strong>and</strong>s. Implementation of the proposed KAC<br />
project must avoid harming wetl<strong>and</strong>s unless there is no practicable alternative. If it must be<br />
located in wetl<strong>and</strong>s, the proposed project must employ all possible measures to minimize<br />
adverse effects on wetl<strong>and</strong>s. The regulatory definition of wetl<strong>and</strong>s is “those areas that are<br />
inundated or saturated by surface or ground water at a frequency <strong>and</strong> duration sufficient to<br />
support, <strong>and</strong> that under normal circumstances do support, a prevalence of vegetation typically<br />
adapted for life in saturated soil conditions” (33 C.F.R. § 328.3[b]). Note that this narrow<br />
definition does not include unvegetated water bodies; those are described in Sections 3.8.1<br />
<strong>and</strong> 3.8.7.1.<br />
The Cook Inlet region has a transitional maritime-continental climate, <strong>and</strong> wetl<strong>and</strong>s are<br />
common in the region. The cool climate, nearly-level topography, <strong>and</strong> glacial deposits<br />
characteristic of the region create conditions that promote the formation of abundant<br />
wetl<strong>and</strong>s. Figure 3.54 shows the locations of wetl<strong>and</strong>s, water bodies, <strong>and</strong> upl<strong>and</strong>s<br />
(nonwetl<strong>and</strong>) in the general Study Area, as mapped by the National Wetl<strong>and</strong> Inventory.<br />
Identification of wetl<strong>and</strong>s within most of the Study corridor was based on field surveys<br />
conducted by Study Team biologists in September <strong>and</strong> October 2005 (KABATA 2006q). For<br />
part of the Study Area located on Elmendorf l<strong>and</strong>s—to which the Study Team could not gain<br />
access—an existing report (MOA, DEDP, <strong>and</strong> HDR 1991) <strong>and</strong> file notes from a past<br />
investigation were used to delineate <strong>and</strong> describe the wetl<strong>and</strong>s. The Study Team identified<br />
wetl<strong>and</strong> boundaries within an approximately 300-foot-wide corridor along each alternative,<br />
classified wetl<strong>and</strong>s according to the system of Cowardin et al. (1979), <strong>and</strong> considered how<br />
those wetl<strong>and</strong>s function within the natural environment. The wetl<strong>and</strong> types in this “direct<br />
effects Study Area” are described below.<br />
A wetl<strong>and</strong>’s ecological functions <strong>and</strong> social values depend on many variables, such as its<br />
topographic <strong>and</strong> geomorphic setting; how, when, <strong>and</strong> from what sources it receives water <strong>and</strong><br />
how the water leaves the wetl<strong>and</strong>; its vegetation structure <strong>and</strong> plant species; its macro-<br />
3-176 12/18/07
<strong>Knik</strong> <strong>Arm</strong> Crossing DraftFinal EIS<br />
<strong>Affected</strong> <strong>Environment</strong><br />
Figure 3.54. Study area wetl<strong>and</strong> habitat types<br />
12/18/07 3-177
<strong>Knik</strong> <strong>Arm</strong> Crossing DraftFinal EIS<br />
<strong>Affected</strong> <strong>Environment</strong><br />
<strong>and</strong> microtopography; its position relative to other vegetation types <strong>and</strong> to human<br />
development; <strong>and</strong> its soil type. The functions <strong>and</strong> values often attributed to wetl<strong>and</strong>s include:<br />
ground water recharge or discharge, flood attenuation, shoreline <strong>and</strong> sediment stabilization,<br />
pollutant retention, primary production <strong>and</strong> export of organic material to other sites, wildlife<br />
habitat, fish habitat, <strong>and</strong> human use for recreation, education, open space <strong>and</strong> aesthetics, <strong>and</strong><br />
food harvest. Individual wetl<strong>and</strong>s perform these functions, however, to different degrees—or<br />
not at all. Many of these functions are not unique to wetl<strong>and</strong>s, <strong>and</strong> may also be performed by<br />
upl<strong>and</strong>s.<br />
3.8.2.1 The Mat-Su<br />
General wetl<strong>and</strong> types found within the indirect effects Study Area are described briefly<br />
below, based on information developed by the National Wetl<strong>and</strong>s Inventory (USFWS n.d.a).<br />
Wetl<strong>and</strong> types in the more specific direct effects Study Area are also described. The direct<br />
effects Study Area is generally located on well-drained l<strong>and</strong>, but does cross or skirt the<br />
margin of several large wetl<strong>and</strong> complexes that occupy the lowest-lying areas. These<br />
wetl<strong>and</strong>s are generally formed on large flats, with black spruce forests on the margins,<br />
grading into stunted black spruce scrub in slightly wetter areas <strong>and</strong> into open sedgedominated<br />
wetl<strong>and</strong>s in the wettest areas. Generally, the wetl<strong>and</strong>s are saturated to the surface,<br />
with some ponding of water between hummocks.<br />
3.8.2.1.1 Forested wetl<strong>and</strong>s<br />
In the indirect effects Study Area, forested wetl<strong>and</strong>s are common in two situations.<br />
Seasonally-flooded forests of balsam poplar (Populus balsamifera ssp. balsamifera) or black<br />
cottonwood (P. balsamifera ssp. trichocarpa) are often found on stream floodplains, often<br />
including tall willow <strong>and</strong> alder species, <strong>and</strong> sometimes paper birch (Betula papyrifera), or<br />
black (Picea mariana) or white spruce (P. glauca). Forested wetl<strong>and</strong>s dominated by taller<br />
black spruce typically form a better-drained fringe along extensive shrub bogs or as tree<br />
isl<strong>and</strong>s within bogs (USFWS n.d.a).<br />
The forested wetl<strong>and</strong>s in the direct effects Study Area are of the bog or nutrient-poor fen<br />
type, which are also sometimes referred to loosely as “muskegs.” These forested wetl<strong>and</strong>s are<br />
dominated by black spruce <strong>and</strong>, within the Study Area, Sitka alder (Alnus sinuata) <strong>and</strong> paper<br />
birch are also common. Labrador tea (Ledum groenl<strong>and</strong>icum), black crowberry (Empetrum<br />
nigrum), dwarf birch (Betula nana), <strong>and</strong> lowbush cranberry (Vaccinium vitis-idaea) comprise<br />
the shrub understory. The groundcover is dominated by bluejoint reedgrass (Calamagrostis<br />
canadensis), cloudberry (Rubus chamaemorus), horsetail (Equisetum spp.), <strong>and</strong> mosses.<br />
The spruce-dominated wetl<strong>and</strong>s are generally considered to be low in nutrients. Evergreen<br />
species dominate, <strong>and</strong> these provide browse of limited quality. Berry-producing shrubs,<br />
however, are common in these wetl<strong>and</strong>s <strong>and</strong> the berries provide food for a variety of<br />
mammals <strong>and</strong> birds. Canopy cover of forested <strong>and</strong> scrub wetl<strong>and</strong>s provides shelter to large<br />
<strong>and</strong> small mammals <strong>and</strong> songbirds. Some of the Study Area’s forested wetl<strong>and</strong>s are ground<br />
water discharge areas, <strong>and</strong> release ground water into these <strong>and</strong> the adjacent scrub wetl<strong>and</strong>s.<br />
3-178 12/18/07
<strong>Knik</strong> <strong>Arm</strong> Crossing DraftFinal EIS<br />
<strong>Affected</strong> <strong>Environment</strong><br />
Where located near roads or other ground disturbance, forested <strong>and</strong> scrub wetl<strong>and</strong>s may filter<br />
pollutants from runoff before releasing the water to down slope wetl<strong>and</strong>s.<br />
3.8.2.1.2 Scrub <strong>and</strong> shrub wetl<strong>and</strong>s<br />
Wetl<strong>and</strong>s dominated by shrubs <strong>and</strong> by scrub trees in the indirect effects Study Area include<br />
thickets of willow <strong>and</strong> alder on stream floodplains, alder swamps, extensive bogs with a<br />
dense <strong>and</strong> diverse cover of deciduous <strong>and</strong> evergreen shrubs, bogs with a dense sedge cover,<br />
patterned bogs with higher shrubby areas <strong>and</strong> lower flooded sedge-filled ponds, <strong>and</strong> bogs<br />
dominated by scrubby black spruce (“muskegs”).<br />
In the direct effects Study Area, most scrub or shrub wetl<strong>and</strong>s are dominated by stunted black<br />
spruce <strong>and</strong> are similar to the forested wetl<strong>and</strong>s described above. Additional species include<br />
sweetgale (Myrica gale) <strong>and</strong> shrubby cinquefoil (Dasiphora floribunda). Groundcover<br />
includes bluejoint reedgrass, meadow horsetail (Equisetum pratense), <strong>and</strong> marsh five-finger<br />
(Comarum palustre). The scrub spruce wetl<strong>and</strong>s in the project corridor have functions similar<br />
to those of the spruce forested wetl<strong>and</strong>s described above. One wetl<strong>and</strong> dominated by shrubheight<br />
paper birch was located in the direct effects Study Area, with bluejoint reedgrass <strong>and</strong><br />
meadow horsetail in the understory.<br />
3.8.2.1.3 Sedge <strong>and</strong> grass wetl<strong>and</strong>s<br />
Wetl<strong>and</strong>s dominated by sedges <strong>and</strong> grasses in the indirect effects Study Area include<br />
saturated bogs with dense sedge <strong>and</strong> moss cover, sedge-dominated fens similar to the bogs<br />
but where there is input of relatively mineral-rich water, <strong>and</strong> seasonally flooded marshes<br />
along streams <strong>and</strong> surrounding ponds.<br />
Bog- <strong>and</strong> fen-type sedge wetl<strong>and</strong>s predominate in the direct effects Study Area. Tufted<br />
bulrush (Trichophoum caespitosum), sweetgale, shrubby cinquefoil, <strong>and</strong> sedges (Carex spp.)<br />
are dominant species in these broad flats. These sedge-dominated wetl<strong>and</strong>s are often found in<br />
the lowest areas of extensive wetl<strong>and</strong>s. Bluejoint reedgrass meadows also occur in the Study<br />
Area in small depressions.<br />
The open meadows provide travel corridors for large mammals such as moose <strong>and</strong> bear.<br />
Open water occurs in these meadows, providing habitat for waterfowl. Where near roads,<br />
sedge- or grass-dominated wetl<strong>and</strong>s may filter pollutants from road runoff before releasing<br />
the water downstream. No creeks run through these wetl<strong>and</strong>s, limiting the export of nutrients<br />
or organic matter by way of these water bodies.<br />
3.8.2.2 <strong>Knik</strong> <strong>Arm</strong><br />
3.8.2.2.1 Sedge wetl<strong>and</strong><br />
A narrow fringe of coastal marsh occurs north of POA between the toe of the coastal bluff<br />
<strong>and</strong> unvegetated intertidal mud flats of <strong>Knik</strong> <strong>Arm</strong>. This wetl<strong>and</strong> has been permitted to be<br />
filled during Phase 1 of the POA Expansion Project under Department of <strong>Arm</strong>y Permit<br />
POA-2003-502-2 <strong>and</strong> is not addressed further in this analysis.<br />
12/18/07 3-179
<strong>Knik</strong> <strong>Arm</strong> Crossing DraftFinal EIS<br />
<strong>Affected</strong> <strong>Environment</strong><br />
3.8.2.3 Anchorage<br />
The Anchorage side of the direct effects Study Area is also primarily within upl<strong>and</strong>s.<br />
Wetl<strong>and</strong>s formed as a result of ground water discharge, however, are common on the slopes<br />
east of the POA. Also, riparian wetl<strong>and</strong>s have formed along two drainage ways east of the<br />
POA <strong>and</strong> along Ship Creek. The water bodies in this area are discussed in Section 3.8.1.3.<br />
3.8.2.3.1 Forested wetl<strong>and</strong>s<br />
A paper birch forest forms a wetl<strong>and</strong> riparian corridor along drainage channels east of<br />
Terminal Road, on Elmendorf, that flow to the southeast corner of the POA (see Figure 4.31<br />
in Section 4.8.2.2). (Access to Elmendorf was not granted; it is possible that closer<br />
investigation would show that the riparian corridor is primarily upl<strong>and</strong>.) Sitka alder <strong>and</strong><br />
bluejoint reedgrass are also prominent in this area.<br />
This riparian forest may be subject to periodic flooding, <strong>and</strong> the streamside plants would<br />
stabilize the banks against erosion. During periods of high flows, plant material produced in<br />
these wetl<strong>and</strong>s may be carried downstream <strong>and</strong> support the food web of <strong>Knik</strong> <strong>Arm</strong>. These<br />
forested wetl<strong>and</strong>s also provide foraging <strong>and</strong> resting habitat for a variety of animals.<br />
3.8.2.3.2 Shrub wetl<strong>and</strong>s<br />
Wetl<strong>and</strong>s are formed on the slopes east of the POA where ground water is discharged to the<br />
surface at a complex of seeps between drier upl<strong>and</strong> rises (Figure 3.54). These wetl<strong>and</strong>s are<br />
primarily swamps, dominated by alders (Alnus species), bluejoint reedgrass, devil’s club<br />
(Oplopanax horridus), <strong>and</strong> ferns. Several culverts direct water from these wetl<strong>and</strong>s through<br />
the POA to <strong>Knik</strong> <strong>Arm</strong>.<br />
The ground water released into these wetl<strong>and</strong>s may pick up decaying plants <strong>and</strong> other organic<br />
matter <strong>and</strong> carry it to <strong>Knik</strong> <strong>Arm</strong>, where that material supports the marine food web. These<br />
wetl<strong>and</strong>s may receive pollutants in the surface water runoff from nearby developed areas. To<br />
the degree the pollutants are bound by the wetl<strong>and</strong> soils, the wetl<strong>and</strong>s help protect the water<br />
quality of <strong>Knik</strong> <strong>Arm</strong>. The shrub vegetation may provide foraging, breeding, <strong>and</strong> resting<br />
habitat for a variety of birds <strong>and</strong> mammals, serving as a remnant of habitat within a highly<br />
developed area.<br />
3.8.2.3.3 Sedge <strong>and</strong> grass wetl<strong>and</strong>s<br />
An emergent wetl<strong>and</strong> has formed in a disturbed site between the POA <strong>and</strong> the western<br />
residential area of Government Hill (Figure 3.54). It supports cattails (Typha latifolia) <strong>and</strong><br />
bluejoint reedgrass in the wetter low-lying depressions, <strong>and</strong> nonnative species including<br />
white clover (Trifolium repens) <strong>and</strong> annual bluegrass (Poa annua) in the drier areas. This<br />
wetl<strong>and</strong> also drains through a storm drain system to <strong>Knik</strong> <strong>Arm</strong>. This wetl<strong>and</strong> has functions<br />
similar to those described for the shrub wetl<strong>and</strong>s above.<br />
A wetl<strong>and</strong> next to Ship Creek support sedges (Carex spp.), the weedy marsh forget-me-not<br />
(Myosotis scorpioides), bluejoint reedgrass, <strong>and</strong> horsetails. Its ecological functions may<br />
include retaining pollutants it receives in storm water, slightly moderating the flow in Ship<br />
3-180 12/18/07
<strong>Knik</strong> <strong>Arm</strong> Crossing DraftFinal EIS<br />
<strong>Affected</strong> <strong>Environment</strong><br />
Creek, producing <strong>and</strong> exporting plant material, <strong>and</strong> providing limited wildlife habitat. The<br />
sedge wetl<strong>and</strong> adjacent to a pond may provide resting <strong>and</strong> staging habitat for migratory<br />
waterfowl; however, habitat quality is limited in this urban environment.<br />
3.8.3 Floodplains<br />
Floodplains are defined in EO 11988 as “the lowl<strong>and</strong> <strong>and</strong> relatively flat areas adjoining<br />
inl<strong>and</strong> <strong>and</strong> coastal waters including floodprone areas of offshore isl<strong>and</strong>s, including at a<br />
minimum, that area subject to a one percent or greater chance of flooding in any given year”<br />
(Federal Register 1977). EO 11988 directs federal agencies, <strong>and</strong> the activities undertaken or<br />
authorized by them, to reduce the risk of flood loss <strong>and</strong> to minimize flood impacts to human<br />
inhabitants of an area. Additionally, a location hydraulic study (KABATA 2006c) has been<br />
prepared in accordance with 23 C.F.R. 650 Subpart A, to assess impacts from encroachments<br />
associated with implementation of the proposed KAC project.<br />
3.8.3.1 The Mat-Su<br />
The Federal Emergency Management Agency (FEMA) has mapped base flood elevations<br />
(i.e., 100-year flood elevations) along the Little Susitna River <strong>and</strong> Lucile Creek within the<br />
Mat-Su; however, FEMA maps are not available for the majority of the Mat-Su portion of the<br />
Study corridor. Unmapped floodplains exist within the Goose Creek tributaries <strong>and</strong> closeddrainage<br />
lakes along the Study corridor. Floodplain areas associated with these water bodies<br />
are small in area <strong>and</strong> immediately adjacent to the creek or lake.<br />
Inundation of these floodplains is generally associated with spring snowmelt or large<br />
precipitation events. Because the drainage basin of each water body is small, precipitation<br />
events that cause flooding are localized to the immediate area around the water body.<br />
Flooding adjacent to the creeks has a short duration because the creeks can drain quickly.<br />
Flooding in the closed-drainage lakes lasts longer because the lakes have no stream outlet<br />
<strong>and</strong> the water must percolate into the ground to dissipate. A detailed flood study would be<br />
required to determine the actual possible flood extents, but it is likely that most of these<br />
flood-prone areas are within 100 feet of either side of the stream bank or lakeshore.<br />
3.8.3.2 <strong>Knik</strong> <strong>Arm</strong><br />
The <strong>Knik</strong> <strong>Arm</strong> shoreline within Anchorage is subject to tidal flooding <strong>and</strong> is mapped as base<br />
floodplain Zone A. This zonal type designates areas where the base flood elevations have not<br />
been determined. However, based on FEMA (2002) data, the Municipality of Anchorage<br />
established <strong>and</strong> regulates the coastal base flood elevation as 19 feet above its datum for<br />
coastal areas of <strong>Knik</strong> <strong>Arm</strong> north of Anchorage. This base flood elevation is approximately<br />
36.4 feet relative to MLLW.<br />
Flooding within these areas is associated with storm events, including high winds (but not<br />
waves) <strong>and</strong> extremely low atmospheric pressure. Inundated areas during these floods include<br />
nearshore lowl<strong>and</strong>s <strong>and</strong> creek <strong>and</strong> river estuaries. Flood duration is short because the flood<br />
peak is associated with high tide.<br />
12/18/07 3-181
<strong>Knik</strong> <strong>Arm</strong> Crossing DraftFinal EIS<br />
<strong>Affected</strong> <strong>Environment</strong><br />
3.8.3.3 Anchorage<br />
Within the Anchorage portion of the Study Area, FEMA maps show the POA as Zone X<br />
(FEMA n.d.). This zone designates areas determined to be outside the 0.2 percent annualchance<br />
floodplain. Ship Creek, up to the first dam, is mapped as base floodplain Zone A.<br />
Above the first Ship Creek dam, the flood hazard designation changes to Zone AE <strong>and</strong><br />
consists of riverine flooding from flow in Ship Creek (FEMA n.d.). Inundation of the<br />
floodplain is generally associated with spring snowmelt or large precipitation events.<br />
Flooding adjacent to the Ship Creek in this area could have a long duration because the<br />
drainage basin is large <strong>and</strong> primarily within the Chugach Mountains. Precipitation events in<br />
the mountains can last for some time <strong>and</strong> take a long period to drain from the basin, causing<br />
lengthy floodplain inundation.<br />
Other floodplains within the Study Area in Anchorage include lakes in the Elmendorf. These<br />
floodplains are not mapped. While these areas are not mapped, the flood-prone areas usually<br />
exist immediately adjacent to the water body in hilly glacial topography <strong>and</strong> small<br />
watersheds. A detailed flood study would be required to determine the actual possible flood<br />
extents, but it is likely that most of these flood-prone areas are within 100 feet of either side<br />
of the stream bank or lake shore.<br />
3.8.4 Wild <strong>and</strong> Scenic Rivers<br />
The Wild <strong>and</strong> Scenic Rivers Act of 1968, (PL 90-542 as amended; 16 U.S.C. §§ 1271-87)<br />
established a method for providing federal protection for certain of our country’s remaining<br />
free-flowing rivers, preserving them <strong>and</strong> their immediate environments for use <strong>and</strong><br />
enjoyment by present <strong>and</strong> future generations. Rivers are included in the system so that they<br />
may benefit from the protective management <strong>and</strong> control of the development for which the<br />
Act provides.<br />
The rivers <strong>and</strong> streams located within the Study Area are not designated Wild <strong>and</strong> Scenic<br />
Rivers (USGS 2001b).<br />
3.8.5 Coastal Barriers<br />
Coastal barriers include l<strong>and</strong>scape features such as isl<strong>and</strong>s, mangroves, <strong>and</strong> spits, which can<br />
act to protect the mainl<strong>and</strong> from wind, wave, <strong>and</strong> tidal forces. The intent of the Coastal<br />
Barrier Resources Act of 1982 (16 U.S.C. § 3501) was to minimize loss of human life;<br />
wasteful expenditure of federal revenues; <strong>and</strong> damage to fish, wildlife, <strong>and</strong> other natural<br />
resources associated with the development of coastal barriers.<br />
There are no coastal barriers in Alaska, <strong>and</strong>, therefore, within the Study Area, as defined in<br />
16 U.S.C. § 3501 <strong>and</strong> as reauthorized in the Coastal Barrier Improvement Act of 1990.<br />
3.8.6 Coastal Zone<br />
The U.S. Congress passed the Coastal Zone Management Act of 1972 in an effort to create a<br />
coastal resource management partnership among federal, state, <strong>and</strong> local governments. Five<br />
3-182 12/18/07
<strong>Knik</strong> <strong>Arm</strong> Crossing DraftFinal EIS<br />
<strong>Affected</strong> <strong>Environment</strong><br />
years later, the State of Alaska passed the Alaska Coastal Management Act (ACMA) to<br />
provide a st<strong>and</strong>ardized, statewide policy <strong>and</strong> guidance for projects proposed within the<br />
Coastal Management Boundary. The ACMA also served to guide the development of the<br />
Alaska Coastal Management Program (ACMP) which promulgated statewide development<br />
st<strong>and</strong>ards. The ACMA called for creation of district coastal management programs <strong>and</strong><br />
locally relevant coastal management plans consistent with the st<strong>and</strong>ards of the ACMP. Once<br />
approved, these local district plans become part of the ACMP <strong>and</strong> m<strong>and</strong>ate that state <strong>and</strong><br />
federal agencies administer permit requests within the Alaska Coastal Management<br />
Boundary consistent with both statewide <strong>and</strong> local policies.<br />
In 2003, the Alaska State Legislature passed House Bill 191, which amended the ACMA by<br />
revising ACMP regulations <strong>and</strong> requiring updates to all district coastal management plans<br />
(CMP) by July 2005. All CMPs are currently undergoing revision, <strong>and</strong> the deadline for<br />
updating CMPs was extended to March 2006 under House Bill 102.<br />
Most of the Study Area for the proposed KAC project is located within the coastal area (see<br />
Figure 3.55 in Section 3.8.7.3) <strong>and</strong> is, therefore, subject to the ACMP, the Matanuska-Susitna<br />
Coastal Management Plan (Mat-Su Borough 1983), <strong>and</strong> the Anchorage Coastal Management<br />
Plan (MOA 1987).<br />
3.8.6.1 Alaska<br />
3.8.6.1.1 Alaska Coastal Management Program<br />
Statewide st<strong>and</strong>ards serve as benchmarks for evaluating projects that are within or affect<br />
resources within the Coastal Management Boundary. St<strong>and</strong>ards defined within the ACMP<br />
11 AAC 112) <strong>and</strong> subject to the program include nine major coastal uses or activities <strong>and</strong><br />
three resources. Activities associated with the proposed KAC project would trigger a review<br />
under four of the nine uses <strong>and</strong> all three of the resources:<br />
Uses or activities<br />
• coastal development – the ACMP st<strong>and</strong>ards give priority to water-dependent <strong>and</strong> waterrelated<br />
development<br />
• natural hazard areas – the ACMP st<strong>and</strong>ards guide the appropriate siting, design,<br />
construction, <strong>and</strong> operation of facilities to ensure that the public safety, services <strong>and</strong><br />
environment are protected from potential damage<br />
• coastal access – the ACMP typically requires projects to maintain or improve access to<br />
<strong>and</strong> from as well as along coastal waters<br />
• transportation <strong>and</strong> facilities – transportation <strong>and</strong> facilities projects are regulated to avoid,<br />
minimize, or mitigate changes to surface <strong>and</strong> ground water drainage patterns, disruption<br />
of wildlife transit, <strong>and</strong> blockage of traditional access<br />
Resources<br />
• habitat – several coastal zone habitats are subject to ACMP st<strong>and</strong>ards including<br />
avoidance, minimization, or mitigation of alterations to water flow <strong>and</strong> drainage patterns<br />
of tidal flats<br />
12/18/07 3-183
<strong>Knik</strong> <strong>Arm</strong> Crossing DraftFinal EIS<br />
<strong>Affected</strong> <strong>Environment</strong><br />
• air, l<strong>and</strong>, <strong>and</strong> water quality – the ACMP incorporates Alaska Department of<br />
<strong>Environment</strong>al Conservation statutes <strong>and</strong> regulations regarding protection of air, l<strong>and</strong>,<br />
<strong>and</strong> water quality (AS § 46.40.040[b]), as guidance for protection of those resources<br />
• historic, prehistoric, <strong>and</strong> archaeological resources – the ACMP st<strong>and</strong>ards require<br />
compliance with AS §§ 41.35.010-240 <strong>and</strong> 11 AAC 16.010 to 11 AAC 16.900 for those<br />
areas within the coastal zone that have been designated by DNR as important to the study<br />
or project<br />
The ACMP st<strong>and</strong>ards are implemented through permit authorizations. The State of Alaska<br />
uses a multiagency project consistency review (11 AAC 110) to evaluate <strong>and</strong> process<br />
resource permits required for projects proposed within the coastal zone. During the<br />
consistency review process, project proposals are reviewed to determine the project's<br />
consistency with ACMP st<strong>and</strong>ards <strong>and</strong> the enforceable policies of district coastal<br />
management programs. The consistency review begins once a complete consistency review<br />
packet, consisting of a completed Coastal Project Questionnaire along with all applicable<br />
resource agency authorization applications, is deemed complete <strong>and</strong> the scope of the review<br />
has been determined. A copy of the review packet would then be made available to the public<br />
<strong>and</strong> the 50-day 40 consistency review process would start. A final consistency determination<br />
would be issued after any adverse comments have been resolved or when the application<br />
would become final. The Coastal Project Questionnaire for the proposed KAC project is<br />
included as an appendix to the permit application package submitted in conjunction with this<br />
Draft EIS.<br />
3.8.6.2 The Mat-Su<br />
3.8.6.2.1 Matanuska-Susitna Borough Coastal Management Plan<br />
The original Mat-Su Borough CMP was adopted in 1984 (Mat-Su Borough 1983), with<br />
minor amendments in 1988. The Mat-Su Borough CMP is currently undergoing revision to<br />
update resource information <strong>and</strong> to comply with the 2003 ACMA amendments <strong>and</strong><br />
2004 ACMP regulatory changes. Enforceable policies within the draft 2006 Mat-Su Borough<br />
CMP reflect the 2004 ACMP changes. Because these policies have not been finalized,<br />
however, the more restrictive 1984 enforceable policies will be used as reference for this<br />
document.<br />
In 1993, the Point MacKenzie Area Which Merits Special Attention (AMSA) Plan, as<br />
designated by the Mat-Su Borough CMP, was adopted by the Mat-Su Borough (Mat-Su<br />
Borough 1983). The purpose of the plan was threefold:<br />
• facilitate development of a port, associated upl<strong>and</strong> uses, <strong>and</strong> transportation corridors,<br />
including anticipating permit approval requirements<br />
• protect other important uses <strong>and</strong> values of the area, <strong>and</strong> minimize conflicts with port<br />
development<br />
40 Projects are subject to 50-day consistency reviews unless all required authorizations for the activities are<br />
included on the C-List of the List of Expedited Consistency Reviews.<br />
3-184 12/18/07
<strong>Knik</strong> <strong>Arm</strong> Crossing DraftFinal EIS<br />
<strong>Affected</strong> <strong>Environment</strong><br />
• plan for future development of the port district <strong>and</strong> wise utilization of its coastal<br />
resources<br />
The Point MacKenzie AMSA Plan identifies as one of its 12 issues, “providing access<br />
between Point MacKenzie <strong>and</strong> the Anchorage area.” To address this issue, the plan set forth<br />
Goal 2.5: “Develop a direct transportation connection between Point MacKenzie <strong>and</strong> the<br />
Anchorage urban area as the need arises.”<br />
The plan goes on to state that “The <strong>Knik</strong> <strong>Arm</strong> Crossing proposal … could in the future be<br />
very important to the future growth <strong>and</strong> development of the Point MacKenzie area by<br />
improving access to the heavily populated areas across Cook Inlet.” Applicable enforceable<br />
policies are listed <strong>and</strong> discussed in Section 4.8.6.<br />
3.8.6.3 Anchorage<br />
3.8.6.3.1 Anchorage Coastal Management Plan<br />
The Municipality of Anchorage approved its first Coastal Management Plan in 1980 <strong>and</strong><br />
subsequently updated the plan in 1982, with the addition of the Anchorage Wetl<strong>and</strong>s<br />
Management Plan. In 1987, the Anchorage CMP was revised with additional maps but no<br />
substantive changes to the policies or st<strong>and</strong>ards (MOA 1987). The Municipality is currently<br />
revising its CMP to comply with the 2003 ACMA amendments <strong>and</strong> 2004 ACMP regulatory<br />
changes. A revised CMP is scheduled for release in March 2006. For this Draft EIS, the 1987<br />
enforceable policies will be used. Applicable enforceable policies are listed <strong>and</strong> discussed in<br />
Section 4.8.6.<br />
3.8.7 Habitats<br />
3.8.7.1 Marine habitat<br />
3.8.7.1.1 Intertidal zone<br />
The most prevalent intertidal habitat types within <strong>Knik</strong> <strong>Arm</strong> are mud <strong>and</strong> s<strong>and</strong> flats, which<br />
usually begin at the mid- to lower intertidal zone. 41 From Eagle Bay <strong>and</strong> Goose Bay<br />
southwest, intertidal substrates vary above elevations of about +4 to +6 feet MLLW. In<br />
general, the middle <strong>and</strong> upper beaches north of the POA, on the southern shore, <strong>and</strong> north of<br />
Point MacKenzie, on the northern shore, consist of gravel <strong>and</strong> cobble mixes with occasional<br />
b<strong>and</strong>s of s<strong>and</strong> at the high tide line <strong>and</strong> more widespread silt/clay deposits in the middle<br />
intertidal range. The extreme conditions of tide, currents, icing, <strong>and</strong> beach instability result in<br />
a very low primary productivity on the beaches <strong>and</strong> in the water column (e.g., Bakus et<br />
al. 1979; FHWA <strong>and</strong> ADOT&PF 1983a).<br />
Field observations completed for this project indicate that intertidal habitat <strong>and</strong> vegetation of<br />
the upper beach on the east side of <strong>Knik</strong> <strong>Arm</strong> consist of gravel <strong>and</strong> cobble with scattered<br />
larger boulders (KABATA 2005b). The middle beach is composed of soft or hard clay, while<br />
the lower beach often has large boulders <strong>and</strong> a broad <strong>and</strong> irregular gravel, boulder, <strong>and</strong> s<strong>and</strong><br />
41 In general, the intertidal zone is the area between highest observed tide <strong>and</strong> lowest observed tide.<br />
12/18/07 3-185
<strong>Knik</strong> <strong>Arm</strong> Crossing DraftFinal EIS<br />
<strong>Affected</strong> <strong>Environment</strong><br />
reef at about +8 feet MLLW. To the north of Cairn Point, grain size is reduced <strong>and</strong> the reef<br />
broadens into a wide s<strong>and</strong> flat in the lower intertidal zone that continues north all the way to<br />
the south entrance to Eagle Bay. Intertidal vegetation is limited to small patches of bluegreen<br />
algal felt growing on the clay <strong>and</strong> scattered small green algae, Enteromorpha spp.,<br />
including E. linza, mostly on cobbles. No algae were observed on the low intertidal bench.<br />
Observations from the west side of <strong>Knik</strong> <strong>Arm</strong> characterize the upper beach north of Port<br />
MacKenzie as a mix of s<strong>and</strong> <strong>and</strong> gravel with occasional large boulders. The middle beach<br />
consists of a b<strong>and</strong> of relatively hard gray clay with some eroded ridges. The lower beach face<br />
is a coarse gravel <strong>and</strong> cobble substrate that grades into an irregular cobble bench extending<br />
several hundred feet offshore. Intertidal vegetation includes patches of blue-green algae on<br />
clay <strong>and</strong> scattered small green algae, E. linza, mostly on cobble but also on clay.<br />
E. intestinalis <strong>and</strong> E. prolifera are also present in the lower beach with rockweed<br />
(Fucus gardneri) found in relatively dense patches typically attached to cobbles.<br />
3.8.7.1.2 Subtidal zone<br />
The subtidal zone 42 of <strong>Knik</strong> <strong>Arm</strong> within the Study Area is characterized by flat, silty, <strong>and</strong><br />
fine- to medium-grained s<strong>and</strong> bottoms as well as cobble <strong>and</strong> boulder bottoms in areas of<br />
greater relief (up to 10°). Tidal activity within <strong>Knik</strong> <strong>Arm</strong> provides insufficient time for<br />
flocculation <strong>and</strong> settlement of flocs within the deeper mid-sections of the channel<br />
(to -70 MLLW within the Study Area) where strong currents scour the seafloor clear of all<br />
but heavier s<strong>and</strong> particles (KABATA 2006r). S<strong>and</strong> particles themselves are carried as bed<br />
load in saltation mode (rolling <strong>and</strong> hopping), creating s<strong>and</strong> waves in deeper faster water.<br />
These mobile s<strong>and</strong> waves have been measured to 6 feet high in the vicinity of the Study Area<br />
(FHWA <strong>and</strong> ADOT&PF 1983b).<br />
42 In general, the subtidal zone is that area below the lowest observed tide.<br />
3-186 12/18/07
<strong>Knik</strong> <strong>Arm</strong> Crossing DraftFinal EIS<br />
<strong>Affected</strong> <strong>Environment</strong><br />
3.8.7.2 Freshwater habitat<br />
3.8.7.2.1 The Mat-Su<br />
Freshwater habitat types within the Mat-Su portion of the Study Area include rivers, streams,<br />
lakes, ponds, <strong>and</strong> wetl<strong>and</strong>s. (Section 3.8.1.1 describes the major water bodies of the Mat-Su,<br />
<strong>and</strong> wetl<strong>and</strong>s are described in detail in Section 3.8.2.) The majority of these streams, rivers,<br />
<strong>and</strong> riparian areas are important for sustaining freshwater <strong>and</strong> anadromous fish populations<br />
(Mat-Su Borough 2005f). These habitats are also important to furbearers, <strong>and</strong> all terrestrial<br />
mammals described in Section 3.8.8 rely on freshwater habitats.<br />
3.8.7.2.2 Anchorage<br />
Freshwater habitat within the Anchorage area includes rivers, streams, lakes, ponds, <strong>and</strong><br />
wetl<strong>and</strong>s. These habitats are important to all species of wildlife inhabiting the area.<br />
(Anchorage water bodies <strong>and</strong> wetl<strong>and</strong>s are described in detail in Section 3.8.1.3 <strong>and</strong><br />
Section 3.8.2.3, respectively.)<br />
3.8.7.3 Terrestrial habitat<br />
3.8.7.3.1 The Mat-Su<br />
Terrestrial habitat types were characterized during field efforts conducted for the proposed<br />
KAC project <strong>and</strong> using readily available existing information. Within a 300-foot-wide<br />
corridor centered on Mat-Su road alternatives, habitat types were examined in the field <strong>and</strong><br />
described in detail (KABATA 2006q). Outside this area, in the indirect effects Study Area,<br />
mapping <strong>and</strong> plant type descriptions were derived from the Alaska Interim L<strong>and</strong> Cover<br />
Mapping Project (USGS 1999) (Figure 3.55). The habitat types described below for the<br />
direct effects Study Area are upl<strong>and</strong> habitats, while those described for the indirect effects<br />
Study Area include both upl<strong>and</strong> <strong>and</strong> wetl<strong>and</strong> habitats. Wetl<strong>and</strong> habitat types in the direct<br />
effects Study Area are described in Section 3.8.2.<br />
Needleleaf forest<br />
In the project direct effects Study Area, needleleaf forests are characterized by a canopy<br />
dominated by white spruce, with an understory composed of Labrador tea, prickly rose,<br />
fireweed, <strong>and</strong> horsetails (KABATA 2006q). This habitat type occurs across wide, flat areas<br />
with well-drained soil.<br />
In the indirect effects Study Area, these forests are dominated by white spruce in welldrained<br />
areas <strong>and</strong> by black spruce in poorly drained areas such as bogs <strong>and</strong> muskegs.<br />
Understory shrubs may include alders, willows, shrub birch, spirea (Spirea beauverdiana),<br />
Labrador tea, blueberry <strong>and</strong> cranberry (Vaccinium spp.), rusty menziesia (Menziesia<br />
ferruginea), devil’s club, currents (Ribes spp.), <strong>and</strong> mosses (USGS 1999).<br />
12/18/07 3-187
<strong>Knik</strong> <strong>Arm</strong> Crossing DraftFinal EIS<br />
<strong>Affected</strong> <strong>Environment</strong><br />
Figure 3.55. Study Area habitat types<br />
3-188 12/18/07
<strong>Knik</strong> <strong>Arm</strong> Crossing DraftFinal EIS<br />
<strong>Affected</strong> <strong>Environment</strong><br />
Broadleaf forest<br />
In the project direct effects Study Area, broadleaf forests are characterized by a canopy<br />
dominated by paper birch with an understory composed of prickly rose, highbush cranberry<br />
(Viburnum edule), fireweed, horsetails, <strong>and</strong> bluejoint reedgrass (KABATA 2006q). This<br />
upl<strong>and</strong> habitat type occurs across wide, flat areas <strong>and</strong> on low hills with well-drained soils.<br />
In the indirect effects Study Area, broadleaf forests are characterized by a canopy of<br />
cottonwood, aspen, or paper birch. Understory vegetation is highly variable, <strong>and</strong> may include<br />
spirea, Labrador tea, tall blueberries, <strong>and</strong> rusty menziesia on more moist sites, <strong>and</strong> prickly<br />
rose, <strong>and</strong> highbush cranberry, on drier sites. Common forbs include bluejoint reedgrass,<br />
horsetails, <strong>and</strong> fireweed (USGS 1999).<br />
Mixed needleleaf/broadleaf forest<br />
In the project direct effects Study Area, mixed needleleaf/broadleaf forests have a canopy<br />
dominated by white spruce <strong>and</strong> paper birch, with an understory of highbush cranberry, dwarf<br />
dogwood (Cornus canadensis), lady fern (Athyrium filix-femina), prickly rose, <strong>and</strong> fireweed<br />
(KABATA 2006q). This upl<strong>and</strong> habitat type is common throughout the direct effects Study<br />
Area, occurring over wide, flat areas with well-drained soil.<br />
In the indirect effects Study Area, mixed forests are composed of an upper canopy mix of<br />
paper birch, cottonwood, aspen, white spruce, <strong>and</strong> black spruce. Understory plant species<br />
may include Labrador tea, horsetails <strong>and</strong> bluejoint reedgrass on more moist sites, <strong>and</strong> prickly<br />
rose, highbush cranberry, dwarf dogwood, lady fern, <strong>and</strong> fireweed, on drier sites<br />
(USGS 1999).<br />
Tall <strong>and</strong> low shrub<br />
In the direct effects Study Area, tall shrub habitat occurs along roadsides <strong>and</strong> on the coastal<br />
bluff. This habitat type is dominated by a thick canopy of alder, with a sparse understory of<br />
devil’s club, lady fern, horsetail, <strong>and</strong> bluejoint reedgrass (KABATA 2006q).<br />
Dwarf shrub<br />
In the indirect effects Study Area, dwarf shrub areas are characterized by plants generally<br />
less than 1 foot tall <strong>and</strong> are dominated by dwarf birch <strong>and</strong> a variety of heath species. This<br />
habitat type is common in peatl<strong>and</strong>. Mosses (primarily Sphagnum sp.) are common in<br />
peatl<strong>and</strong> types (USGS 1999).<br />
Dry <strong>and</strong> moist herb<br />
Upl<strong>and</strong> herb meadows are common throughout the direct effects Study Area, occurring<br />
within the existing transmission line corridor. The dominant plant species is bluejoint<br />
reedgrass, with prickly rose, devil’s club, red raspberry (Rubus idaeus), <strong>and</strong> red elderberry<br />
(Sambucus racemosa) also present (KABATA 2006q).<br />
12/18/07 3-189
<strong>Knik</strong> <strong>Arm</strong> Crossing DraftFinal EIS<br />
<strong>Affected</strong> <strong>Environment</strong><br />
In the indirect effects Study Area, this habitat type is dominated by sedges (primarily Carex<br />
aquatilis <strong>and</strong> C. bigelowii). Most sites have other grasses, sedges, or rushes as well as<br />
scattered willows. Mosses <strong>and</strong> lichens also may be present in varying amounts in the<br />
understory (USGS 1999).<br />
Wet <strong>and</strong> aquatic herb<br />
This habitat type is described in the direct effects Study Area for wetl<strong>and</strong>s described in<br />
Section 3.8.2.<br />
In the indirect effects Study Area, wet herb habitat is generally found in low basins, such as<br />
tidal areas, that are saturated throughout the growing season. Common species include the<br />
grass Arctophila fulva, bluejoint reedgrass, sedges, <strong>and</strong> buckbean (Menyanthes trifoliata).<br />
Aquatic herbs typically grow in shallow to deep water, such as along pond <strong>and</strong> lake<br />
shorelines. Plants may include sedges, Arctophila fulva, mare’s tail (Hippuris vulgaris), pond<br />
lilies (Nuphar sp. <strong>and</strong> Nymphaea tetragona), duckweed (Potamogeton sp.), <strong>and</strong> marsh<br />
fivefinger (USGS 1999).<br />
Agricultural areas<br />
This type of habitat includes hay <strong>and</strong> grazing fields, as well as grain fields (USGS 1999).<br />
Developed areas<br />
In the direct effects study area, this type includes roads, trails, fill embankments, <strong>and</strong> all other<br />
barren or sparsely vegetated areas subject to human disturbance. Plant species colonizing<br />
these areas are typically composed of invasive or weedy species adapted to frequent<br />
disturbance regimes.<br />
In the indirect effects Study Area, this type includes roads, trails, parking lots, gravel borrow<br />
sites, fill embankments, <strong>and</strong> all other barren or sparsely vegetated areas.<br />
Invasive species<br />
An invasive species is defined in EO 13112 as “an alien species whose introduction does or<br />
is likely to cause economic or environmental harm or harm to human health.” This EO<br />
directs federal agencies to address their actions that are likely to influence the presence of<br />
invasive species. Agencies are further directed to develop programs <strong>and</strong> authorities to<br />
prevent the introduction of invasive species, monitor populations, <strong>and</strong> provide for restoration<br />
of native species <strong>and</strong> habitats that have been invaded.<br />
Most nonnative invasive plants are pioneering species that prefer highly disturbed sites such<br />
as areas along rivers <strong>and</strong> streams, trails, trailheads, roadsides, construction sites, wildlife<br />
bedding grounds, <strong>and</strong> campgrounds (Sheley <strong>and</strong> Petroff 1999). Studies have shown that the<br />
presence of exotic plant species highly correlates with sunlit soil <strong>and</strong> frequent, severe<br />
disturbances, such as those resulting from road traffic <strong>and</strong> from road maintenance activities<br />
(e.g., grading, mowing) (Parendes <strong>and</strong> Jones 2000). Once nonnative invasive species<br />
colonize an area, they often crowd out or prevent the establishment of less aggressive native<br />
3-190 12/18/07
<strong>Knik</strong> <strong>Arm</strong> Crossing DraftFinal EIS<br />
<strong>Affected</strong> <strong>Environment</strong><br />
plants <strong>and</strong> plant communities. In some cases, once established, invasives can alter the habitat<br />
<strong>and</strong> behavior patterns of birds <strong>and</strong> other wildlife.<br />
The Alaska Natural Heritage Program (ANHP) has identified 114 nonnative species in<br />
Alaska, <strong>and</strong> has ranked them for invasiveness. 43 The ANHP uses a numeric ranking system<br />
(0 to 100) to classify nonnative species’ invasiveness based on potential ecological impact,<br />
biological characteristics <strong>and</strong> dispersal ability, ecological amplitude <strong>and</strong> distribution, <strong>and</strong><br />
feasibility of control. Thirty-one of the 114 species are found within the Study Area<br />
(Table 3-27). It should be noted that not all nonnative species reported as existing within the<br />
Study Area have been ranked using this system <strong>and</strong> not all nonnative plant species are<br />
considered to be invasive. The ANHP has, however, established that the species displayed in<br />
Table 3-27 generally include the top 20 invasive species of concern within the Study Area. 44<br />
Invasive species are generally not regulated as such by law at the state or federal 45 level.<br />
Noxious weeds 46 are, however, regulated at the federal level <strong>and</strong> by the State of Alaska, <strong>and</strong><br />
include many nonnative invasive plant species. The State of Alaska has identified <strong>and</strong><br />
regulates 31 plant species as noxious weeds (11 AAC 34.020) or as being weed seed as<br />
agricultural seed (11 AAC 34.030). State law prohibits the sale, transport, or planting of<br />
agricultural or vegetable seed that contains prohibited weed seed or restricted noxious weed<br />
seed in excess of the permissible tolerances. Eight of the state’s 31 regulated noxious weeds<br />
are found within the Study Area <strong>and</strong> are listed in Table 3-28 by their ANHP invasiveness<br />
ranking. Federally funded transportation projects may use federal dollars to control noxious<br />
weeds. 47<br />
43 Personal communication, Matt Carlson, Alaska Natural Heritage Program, with Michael Allwright, June 23,<br />
2006.<br />
44 Personal communication, Matt Carlson, Alaska Natural Heritage Program, e-mail to Patrick Blair, June 8,<br />
2006.<br />
45 The National Invasive Species Act of 1996 calls for preventing the spread of nuisance aquatic vegetation<br />
species (e.g., Eurasian watermilfoil, hydrilla, water hyacinth, water chestnut) by regulating <strong>and</strong> managing<br />
shipping vessel ballast waters. The Act does not regulate any specific aquatic species or terrestrial invasive<br />
plant species.<br />
46 Noxious weeds are defined under the Plant Protection Act as “any plant or plant product that can directly or<br />
indirectly injure or cause damage to crops (including nursery stock or plant products), livestock, poultry, or<br />
other interests of agriculture, irrigation, navigation, the natural resources of the United States, the public<br />
health, or the environment.” [7 U.S.C. § 7701 et seq.]<br />
47 The SAFETEA-LU, signed into law in 2005, added a provision at 23 U.S.C. § 329 that makes activities for<br />
the control of noxious weeds <strong>and</strong> the establishment of native species, eligible for NHS <strong>and</strong> STP funds. The<br />
new provisions not only provide for federal-aid eligibility for weed control, but also support ongoing<br />
vegetation management prior to <strong>and</strong> following the construction of a project funded with federal transportation<br />
dollars.<br />
12/18/07 3-191
<strong>Knik</strong> <strong>Arm</strong> Crossing DraftFinal EIS<br />
<strong>Affected</strong> <strong>Environment</strong><br />
Table 3-27. Alaska Natural Heritage Program invasiveness<br />
ranking of nonnative plant species found within the Study Area<br />
Scientific name<br />
Common name<br />
Invasiveness<br />
ranking<br />
(0–100; low–<br />
high)<br />
Centaurea maculosa spotted knapweed 88<br />
Phalaris arundinacea reed canary grass 83<br />
Impatiens gl<strong>and</strong>ulifera ornamental jewel<br />
weed 82<br />
Melilotus officinalis white sweetclover 80<br />
Lythrum salicaria purple loosestrife 79<br />
Bromus tectorum cheatgrass 78<br />
Cirsium arvense Canada thistle 76<br />
Vicia cracca bird vetch 75<br />
Hieracium aurantiacum orange hawkweed 71<br />
Caragana aborenscens Siberian pea shrub 65<br />
Melilotus alba yellow sweetclover 65<br />
Hordeum jubatum foxtail barley 63<br />
Linaria vulgaris yellow toadflax 63<br />
Senecio jacobaea ragwort 63<br />
Bromus inermis ssp. smooth brome 62<br />
Taraxacum officinale common d<strong>and</strong>elion 62<br />
Cirsium vulgare bull thistle 61<br />
Leucanthemum vulgare<br />
Lam.<br />
ox-eye daisy<br />
61<br />
Elymus repens quackgrass 59<br />
Hordeum murinum ssp. leporinum barley 57<br />
Stellaria media common chickweed 57<br />
Tanacetum vulgare common tansy 57<br />
Trifolium hybridum alsike clover 57<br />
Phleum pratense Timothy grass 56<br />
Sonchus arvensis perennial sowthistle 56<br />
Lupinus polyphyllus large-leaf lupine 55<br />
Hypericum perforatum St. John’s-wort 52<br />
Poa annua annual bluegrass 51<br />
Polygonum convolvulus black bindweed 51<br />
Source: Data adapted by HDR Alaska, Inc., from the ANHP nonnative plant invasiveness<br />
ranking dataset provided by Matt Carlson, Alaska Natural Heritage Program. The dataset<br />
was updated as of June 2006.<br />
3-192 12/18/07
<strong>Knik</strong> <strong>Arm</strong> Crossing DraftFinal EIS<br />
<strong>Affected</strong> <strong>Environment</strong><br />
Table 3-28. Regulated noxious weed species found in<br />
the Study Area, as ranked for invasiveness by the<br />
Alaska Natural Heritage Program<br />
Scientific name<br />
Common name<br />
Invasiveness<br />
ranking<br />
(0–100; low–<br />
high)<br />
Cirsium arvense Canada thistle 76<br />
Vicia cracca bird vetch 75<br />
Linaria vulgaris yellow toadflax 63<br />
Taraxacum officinale a common d<strong>and</strong>elion 62<br />
Sonchus arvensis perennial sowthistle 56<br />
Lupinus polyphyllus a large-leaf lupine 55<br />
Poa annua annual bluegrass 51<br />
Polygonum convolvulus black bindweed 51<br />
a According to 11 AAC 34.030, when occurring in agricultural <strong>and</strong> vegetable<br />
seeds, seeds of these species are identified as weed seeds.<br />
3.8.7.3.2 Anchorage<br />
Several upl<strong>and</strong> habitat types occur within the Anchorage portion of the direct effects Study<br />
Area. These include upl<strong>and</strong> broadleaf forest, upl<strong>and</strong> tall shrub, upl<strong>and</strong> herbaceous meadow,<br />
<strong>and</strong> urban areas.<br />
Upl<strong>and</strong> broadleaf forest<br />
Upl<strong>and</strong> broadleaf forest is common throughout the Anchorage Bowl. This habitat type is<br />
characterized by an upper canopy dominated by paper birch <strong>and</strong> an understory composed of<br />
alder, devil’s club, highbush cranberry, prickly rose, mountain ash (Sorbus sitchensis), tall<br />
fireweed, <strong>and</strong> bluejoint reedgrass.<br />
An important feature of this habitat type is its multilayered forest canopy. The upper tree<br />
canopy provides bird nesting habitat <strong>and</strong> perch locations for raptors <strong>and</strong> owls. The midcanopy<br />
provides protective cover for wildlife <strong>and</strong> supports a variety of plants used for food.<br />
The lower canopy provides cover for many small mammals <strong>and</strong> birds, den sites, <strong>and</strong> resting<br />
locations for larger mammals. The annual quantity of biomass exported from this habitat type<br />
is typically high, supplying nutrients to the overall food web. Export of leaf litter, berries,<br />
<strong>and</strong> decomposed woody material to downstream habitats provides streams, wetl<strong>and</strong>s, <strong>and</strong><br />
water bodies with important detritus used by a variety of plant <strong>and</strong> animal species.<br />
Upl<strong>and</strong> tall shrub<br />
Upl<strong>and</strong> tall shrub habitat is common along the coastal bluff, areas adjacent to developments,<br />
<strong>and</strong> along stream corridors. Dominant plant species include alder, devil’s club, salmonberry,<br />
red elderberry, cow parsnip (Heracleum lanatum), <strong>and</strong> tall fireweed.<br />
This habitat type provides cover for both mammals <strong>and</strong> birds, generally supporting excellent<br />
nesting opportunities for songbirds. Along the toe of the coastal bluff north of the POA, this<br />
12/18/07 3-193
<strong>Knik</strong> <strong>Arm</strong> Crossing DraftFinal EIS<br />
<strong>Affected</strong> <strong>Environment</strong><br />
habitat type likely reduces coastal bluff erosion by its plant roots’ binding soil <strong>and</strong> protecting<br />
against erosional forces from intermittent streams <strong>and</strong> ground water discharge. Within the<br />
developed portions of Anchorage, this habitat type acts as a protective visual <strong>and</strong> audible<br />
buffer for undisturbed natural areas <strong>and</strong> developed areas.<br />
Upl<strong>and</strong> herb<br />
Upl<strong>and</strong> herbaceous meadows are common in disturbed areas (previously cleared lots, areas<br />
adjacent to developments, etc.) in Anchorage. These sites are typically dominated by<br />
invasive plant species that colonize naturally or are planted during reseeding efforts<br />
following ground-disturbing construction.<br />
Because of the proximity of this habitat type to developed areas, its habitat use potential is<br />
marginal. Some open fields are used by migratory birds as resting <strong>and</strong> staging locations in the<br />
spring <strong>and</strong> fall. The open fields within <strong>and</strong> nearby Anchorage parks are used heavily by<br />
recreationists.<br />
Developed areas<br />
Barren <strong>and</strong> sparsely vegetated areas, such as roadways, parking lots, buildings, <strong>and</strong> yards, are<br />
abundant throughout the developed portions of Anchorage. These sites likely provide littleto-no<br />
habitat value for most wildlife.<br />
3.8.8 Wildlife<br />
3.8.8.1 Marine invertebrates<br />
Pelagic primary productivity within the estuarine waters of Upper Cook Inlet decrease with<br />
progression up the Inlet (Larrance et al. 1977; Speckman et al. 2005), <strong>and</strong> marine<br />
invertebrates are generally limited by low primary productivity resulting from high<br />
suspended sediment loads, variable salinities, <strong>and</strong> water temperatures near freezing<br />
(KABATA 2005b). Invertebrates most important in the food web of <strong>Knik</strong> <strong>Arm</strong> are primarily<br />
epibenthic <strong>and</strong> possibly planktonic—zooplankton that appear to depend on organic matter<br />
produced outside the <strong>Knik</strong> <strong>Arm</strong> environment (e.g., organic detritus from rivers <strong>and</strong> marshes<br />
adjacent to the <strong>Knik</strong> <strong>Arm</strong>) for an energy source (KABATA 2005b). Despite the general low<br />
primary productivity of <strong>Knik</strong> <strong>Arm</strong>, the nearshore waters of the intertidal zone <strong>and</strong> offshore<br />
waters in the central <strong>Knik</strong> <strong>Arm</strong> support substantial numbers of invertebrates <strong>and</strong> fish.<br />
Beach seine sampling in <strong>and</strong> near the Study Area captured nine taxa of invertebrates,<br />
including at least two species of Crangon shrimp, two species of gammarid amphipods, three<br />
species of shrimp from the Mysidae family, the isopod, Saduria entomon, <strong>and</strong> one species of<br />
polychaete worm (KABATA 2005b). A similar study in 1983 produced a comparable list of<br />
seven epifaunal crustacean species (FHWA <strong>and</strong> ADOT&PF 1983a). Species composition<br />
was relatively similar in nearshore (beach seine) <strong>and</strong> offshore (tow net) samples. Several<br />
species, commonly believed to be benthic or epibenthic, were taken in the surface tow net<br />
samples where water was over 80 feet deep. This may suggest that severe vertical turbulence<br />
in <strong>Knik</strong> <strong>Arm</strong> makes it difficult for invertebrates (<strong>and</strong> fish) to maintain position relative to the<br />
3-194 12/18/07
<strong>Knik</strong> <strong>Arm</strong> Crossing DraftFinal EIS<br />
<strong>Affected</strong> <strong>Environment</strong><br />
shoreline or to the bottom or that their nutriment sources in <strong>Knik</strong> <strong>Arm</strong> are not restricted to<br />
benthic habitats.<br />
Beaches within the Study Area are devoid of obvious macroinvertebrate infauna. 48 Intertidal<br />
benthic core samples taken in the vicinity of the Study Area found only two species of<br />
invertebrates, the most abundant being a nereid polychaete (Neanthes limnicola) <strong>and</strong> the<br />
small bivalve, M. balthica (KABATA 2005b).<br />
Little information is available on the subtidal benthic fauna in the Study Area, but one<br />
investigation near Point Woronzof suggests that subtidal infauna are essentially nonexistent<br />
(Bakus et al. 1979). Mobility of the surface layer may act to limit sessile fauna establishment<br />
within deeper portions of the subtidal zone. Attempts to sample the bottom with a trawl have<br />
had limited success both in 1983 (FHWA <strong>and</strong> ADOT&PF 1983a) <strong>and</strong> 2004–2005<br />
(KABATA 2005b), primarily because of the presence of large cobbles or boulders in areas<br />
where sampling was attempted. Invertebrates taken included only a few representatives of<br />
those taxa also taken in the beach seines.<br />
3.8.8.2 Fish <strong>and</strong> essential fish habitat<br />
3.8.8.2.1 Essential fish habitat<br />
Essential fish habitat (EFH) is defined under the Magnusen-Stevens Fishery <strong>and</strong><br />
Conservation Management Act (PL 94-265), as amended by the Sustainable Fisheries Act<br />
of 1996 (PL 104-267), as “those waters <strong>and</strong> substrate necessary to fish for spawning,<br />
breeding, feeding, or growth to maturity.” EFH designations emphasize the importance of<br />
habitat protection to healthy fisheries <strong>and</strong> serve to protect <strong>and</strong> conserve the habitat of<br />
federally managed marine, estuarine, <strong>and</strong> anadromous finfish as well as certain mollusks <strong>and</strong><br />
crustaceans. Under the definition of EFH, necessary habitat is that which is required to<br />
support a sustainable fishery <strong>and</strong> the managed species’ contribution to a healthy ecosystem.<br />
NOAA’s National Marine Fisheries Service (NOAA Fisheries) is responsible for designating<br />
EFH. In the case of anadromous fish streams (principally salmon), NOAA Fisheries has<br />
designated the anadromous fish maps prepared by ADF&G as the definition of EFH. Mapped<br />
anadromous fish streams exist in the Study Area on the east side of <strong>Knik</strong> <strong>Arm</strong>. The Study<br />
Area also includes marine EFH in <strong>Knik</strong> <strong>Arm</strong> waters. These areas are summarized below <strong>and</strong><br />
detailed in the EFH Assessment in Appendix F.<br />
Most of the fishes with designated EFH within the Study Area are important as sport or<br />
commercial fishery species within Cook Inlet as well as being prey species for beluga<br />
whales. Sport fisheries in the Study area are described in Section 3.6.2, commercial fisheries<br />
are discussed in the Socioeconomic <strong>Affected</strong> <strong>Environment</strong> Technical Report<br />
(KABATA 2006a), <strong>and</strong> a description of beluga diet is found in Section 3.8.8.4.<br />
48 Infauna refers to species living in sediment within soft substrate areas such as shallow mud flats <strong>and</strong> s<strong>and</strong><br />
flats.<br />
12/18/07 3-195
<strong>Knik</strong> <strong>Arm</strong> Crossing DraftFinal EIS<br />
<strong>Affected</strong> <strong>Environment</strong><br />
Consultation with NOAA Fisheries <strong>and</strong> ADF&G confirmed that the following three<br />
groundfish, one forage fish, <strong>and</strong> five Pacific salmon species have designated EFH within the<br />
Study Area. 49<br />
Groundfish<br />
• Pacific cod (Gadus macrocephalus)<br />
• Sculpin (Cottidae spp.)<br />
• Walleye pollock (Theragra chalcogramma)<br />
Forage fish<br />
• Eulachon (Thaleichtys pacificus)<br />
Pacific salmon<br />
• Chinook salmon (Oncorhynchus tshawytscha)<br />
• Chum salmon (O. keta)<br />
• Coho salmon (O. kisutch)<br />
• Pink salmon (O. gorbuscha)<br />
• Sockeye salmon (O. nerka)<br />
The Mat-Su<br />
No anadromous fish streams, <strong>and</strong> thus no EFH-designated waters, are located within the<br />
Mat-Su portion of the Study Area (Figure 3.56). However, there are numerous anadromous<br />
fish streams within the Mat-Su, but outside of the study area that contribute to anadromous<br />
fish populations within <strong>Knik</strong> <strong>Arm</strong>. These streams <strong>and</strong> rivers include Goose Creek, Fish<br />
Creek, Willow Creek, Cottonwood Creek, Wasilla Creek, the Matanuska River, <strong>and</strong> the <strong>Knik</strong><br />
River (ADF&G 2005a).<br />
<strong>Knik</strong> <strong>Arm</strong><br />
Life stages of the EFH species present within <strong>Knik</strong> <strong>Arm</strong> are given in Table 3-29. Detailed<br />
life cycle <strong>and</strong> habitat information for all of these fishes is provided in the Essential Fish<br />
Habitat Assessment (Appendix F) conducted for the proposed KAC project. A summary of<br />
the Assessment findings is provided below.<br />
49 Personal communication, Larry Peltz, Fisheries Scientist, NOAA Fisheries, phone conversation with John<br />
Burnett, September 19, 2005<br />
3-196 12/18/07
<strong>Knik</strong> <strong>Arm</strong> Crossing DraftFinal EIS<br />
<strong>Affected</strong> <strong>Environment</strong><br />
Figure 3.56. Essential fish habitat<br />
12/18/07 3-197
<strong>Knik</strong> <strong>Arm</strong> Crossing DraftFinal EIS<br />
<strong>Affected</strong> <strong>Environment</strong><br />
Table 3-29. Essential fish habitat designations <strong>and</strong> presence in the <strong>Knik</strong> <strong>Arm</strong><br />
portion of the Study Area<br />
Groundfish <strong>and</strong><br />
forage fish<br />
species<br />
Egg<br />
Larvae<br />
Late<br />
juvenile a, b Adulta, b Spawning<br />
Pacific cod • c • c<br />
Sculpin spp. • c •<br />
Walleye pollock • • c<br />
Eulachon • •<br />
Pacific Salmon<br />
species<br />
Egg <strong>and</strong><br />
larvae<br />
(fresh<br />
water d )<br />
Juvenile<br />
(fresh<br />
water d )<br />
Juvenile<br />
estuarine b )<br />
Adult<br />
(marine<br />
waters b )<br />
Spawning<br />
(freshwater<br />
only d )<br />
Chinook salmon • •<br />
Chum salmon • •<br />
Coho salmon • • •<br />
Pink salmon • • •<br />
Sockeye salmon • • •<br />
a<br />
NOAA Fisheries, 2005<br />
b<br />
KABATA, 2005<br />
c<br />
Designated as EFH, but not captured in any studies in <strong>Knik</strong> <strong>Arm</strong><br />
d<br />
ADF&G, 2005<br />
Juveniles <strong>and</strong> adults of all five Pacific salmon species are present in <strong>Knik</strong> <strong>Arm</strong> as well as in<br />
more than a dozen streams <strong>and</strong> rivers that discharge into Upper Cook Inlet. Analysis of<br />
length, frequency, <strong>and</strong> timing patterns suggests that juvenile pink <strong>and</strong> chum salmon move<br />
through <strong>Knik</strong> <strong>Arm</strong> relatively quickly <strong>and</strong> do not grow much in this environment. On the other<br />
h<strong>and</strong> <strong>Knik</strong> <strong>Arm</strong> may be important rearing habitat for the juvenile coho, chinook, <strong>and</strong> sockeye<br />
salmon emerging from streams <strong>and</strong> rivers that discharge into <strong>Knik</strong> <strong>Arm</strong>. Juveniles of these<br />
species appear to be feeding <strong>and</strong> growing actively in <strong>Knik</strong> <strong>Arm</strong> into August (FHWA <strong>and</strong><br />
ADOT&PF 1983a; Moulton 1997; KABATA 2005b; Pentec 2005).<br />
Juvenile salmon use of both shoreline <strong>and</strong> mid-channel habitats in <strong>Knik</strong> <strong>Arm</strong> differs from<br />
that of juvenile salmon use of clearwater estuaries (KABATA 2005b), where early<br />
out-migrants are found primarily residing in nearshore habitats (see reviews by Salo 1991;<br />
S<strong>and</strong>ercock 1991; Healey 1991). A comparison of beach seining <strong>and</strong> tow net data as catch<br />
per unit effort (CPUE), which accounts for bias in relative effort for differences in sampling<br />
efficiency associated with various sampling gear types, suggests a shoreline or intertidal<br />
preference by juvenile chinook <strong>and</strong> coho salmon. Juveniles of chum <strong>and</strong> sockeye salmon<br />
appear to use both nearshore <strong>and</strong> mid-channel habitats, with a markedly higher occurrence in<br />
mid-channel habitat. Juvenile pink salmon were primarily found in mid-channel habitat<br />
(KABATA 2005b).<br />
3-198 12/18/07
<strong>Knik</strong> <strong>Arm</strong> Crossing DraftFinal EIS<br />
<strong>Affected</strong> <strong>Environment</strong><br />
High turbidity <strong>and</strong> active vertical mixing within <strong>Knik</strong> <strong>Arm</strong> limit primary productivity;<br />
however, allochthonous 50 carbon contributions (factored into the primary productivity of<br />
streams <strong>and</strong> rivers) appear to provide sufficient energy inputs to <strong>Knik</strong> <strong>Arm</strong> to sustain growth<br />
<strong>and</strong> development of juvenile salmon migrating through <strong>Knik</strong> <strong>Arm</strong>. For example, substantial<br />
numbers of invertebrates have been found within the waters of Upper Cook Inlet <strong>and</strong> <strong>Knik</strong><br />
<strong>Arm</strong> (FHWA <strong>and</strong> ADOT&PF 1983a; Moulton 1997; Pentec 2005; KABATA 2005b) despite<br />
decreasing euphotic zone depth <strong>and</strong> marine primary productivity with progression up Cook<br />
Inlet (Larrance et al. 1977; Speckman et al. 2005). This suggests that an alternative source of<br />
carbon input, other than from pelagic primary productivity, is available. Moreover, stomach<br />
assays of juvenile salmon within mid-channel waters found that the majority of these fishes<br />
had full bellies <strong>and</strong> were feeding primarily on terrestrial winged insects (FHWA <strong>and</strong><br />
ADOT&PF 1983; Moulton 1997; Pentec 2005), further stressing the potential importance of<br />
allochthonous sources of energy for the subsistence of juvenile salmon within <strong>Knik</strong> <strong>Arm</strong>.<br />
Eulachon (hooligan) likely move through <strong>Knik</strong> <strong>Arm</strong> in early spring to reach spawning<br />
grounds within freshwater streams <strong>and</strong> rivers. While smelt habitat is not documented within<br />
the Study Area or in any streams or rivers emptying into <strong>Knik</strong> <strong>Arm</strong> (ADF&G 2005b),<br />
eulachon have been observed within <strong>Knik</strong> <strong>Arm</strong> waters. KABATA caught gravid eulachon in<br />
April 2005 <strong>and</strong> post-spawn eulachon were subsequently caught in May. The lack of juvenile<br />
eulachon captured in sampling efforts may suggest that they move quickly through <strong>Knik</strong> <strong>Arm</strong><br />
after hatching in mid-summer. No eulachon were observed during <strong>Knik</strong> <strong>Arm</strong> sampling<br />
during July through November of 2004 or 2005 (KABATA 2005b).<br />
The unconsolidated silt, s<strong>and</strong>, <strong>and</strong> cobble bottom areas of <strong>Knik</strong> <strong>Arm</strong> are expected to provide<br />
suitable habitat for groundfish species such as Pacific cod, sculpin, <strong>and</strong> pollock. Prey species<br />
such as epibenthic crustaceans <strong>and</strong> pelagic small fish are available within <strong>Knik</strong> <strong>Arm</strong>.<br />
However, recent trawl <strong>and</strong> beach seine sampling within <strong>Knik</strong> <strong>Arm</strong> produced only three<br />
Pacific staghorn sculpin (Leptocottus armatus), three walleye pollock, <strong>and</strong> no Pacific cod<br />
(KABATA 2005b).<br />
The <strong>Knik</strong> <strong>Arm</strong> portion of the Study Area includes one anadromous stream, Sixmile Creek<br />
(247-50-10090) (Figure 3.56). During low tide, Sixmile Creek flows within a confined<br />
intertidal channel within <strong>Knik</strong> <strong>Arm</strong>. The lower section of the creek <strong>and</strong> Sixmile Lake<br />
includes spawning <strong>and</strong> rearing habitat for Dolly Varden char <strong>and</strong> sockeye <strong>and</strong> coho salmon,<br />
<strong>and</strong> spawning habitat for pink salmon (ADF&G 2005b). However, because the intertidal<br />
channel is very shallow (less than 6 inches), it is unlikely that migrating fish use it during low<br />
tide. Once the tide is high <strong>and</strong> the intertidal channel is indistinguishable from the rest of <strong>Knik</strong><br />
<strong>Arm</strong>, fish likely move into Sixmile Creek. 51<br />
50 Allochthonous refers to something that originates outside of or is not originally produced within a system. In<br />
this instance allochthonous carbon sources include things such as organic detritus <strong>and</strong> vegetative mats that are<br />
transported into the estuarine system by the rivers <strong>and</strong> streams that discharge into <strong>Knik</strong> <strong>Arm</strong>.<br />
51 Personal communication, Jim Glaspell, <strong>Environment</strong>al <strong>and</strong> Planning Group Manager, URS Corporation,<br />
e-mail message to Robin Reich, November 27, 2005<br />
12/18/07 3-199
<strong>Knik</strong> <strong>Arm</strong> Crossing DraftFinal EIS<br />
<strong>Affected</strong> <strong>Environment</strong><br />
Anchorage<br />
The Anchorage portion of the Study Area contains a single anadromous fish stream, Ship<br />
Creek (ADF&G No. 247-50-10060) (Figure 3.56). Ship Creek runs approximately 29 miles<br />
from its headwaters at Ship Lake in Chugach State Park <strong>and</strong> drains approximately 123 square<br />
miles. The Ship Creek estuary extends from the stream mouth to approximately river<br />
mile 0.7, where a dam prevents further tidal influence. According to ADF&G (2005b), four<br />
species of Pacific salmon are present in Ship Creek: chinook, coho, chum, <strong>and</strong> pink (Table<br />
3-30). As a result, Ship Creek is EFH for these four Pacific salmon species. However, only<br />
chinook <strong>and</strong> coho salmon are documented to use the creek for rearing of young. Only<br />
chinook are documented to use the creek for spawning, but spawning by pink <strong>and</strong> coho is<br />
likely. Spawning by chum is also possible.<br />
Table 3-30. Essential fish habitat designations in the Anchorage<br />
portion of the Study Area<br />
Salmon<br />
species<br />
Egg <strong>and</strong><br />
larvae<br />
(freshwater<br />
a )<br />
Juvenile<br />
(freshwater<br />
a )<br />
Juvenile<br />
(estuarine b)<br />
Spawning<br />
(freshwater<br />
only a )<br />
Chinook salmon • • • •<br />
Chum salmon<br />
•<br />
Coho salmon • • • c<br />
Pink salmon • • c<br />
Sockeye salmon<br />
•<br />
a<br />
ADF&G, 2005<br />
b<br />
KABATA, 2005x<br />
c<br />
Matt Miller, Fisheries Biologist, ADF&G, phone conversation with John Burnett, October 19, 2005<br />
Each year, eggs from both chinook <strong>and</strong> coho adults are harvested by ADF&G <strong>and</strong> used for<br />
hatchery production of smolts, which are subsequently released into Ship Creek. As a result,<br />
both stocks are enhanced in large part, if not completely, by ADF&G hatchery plantings.<br />
Coho <strong>and</strong> chinook smolt out-migrate in the spring.<br />
Chinook adults are present in Ship Creek from late May through mid-July, while coho adults<br />
are present from mid-July through September. Harvests of pink <strong>and</strong> chum salmon from Ship<br />
Creek are much smaller than those of either chinook or coho. These species are expected to<br />
inhabit the Creek in small numbers, with little-to-no successful reproduction. 52<br />
52 Personal communication, Matt Miller, Fisheries Biologist, ADF&G, phone conversation with John Burnett,<br />
October 19, 2005<br />
3-200 12/18/07
<strong>Knik</strong> <strong>Arm</strong> Crossing DraftFinal EIS<br />
<strong>Affected</strong> <strong>Environment</strong><br />
3.8.8.2.2 Anadromous fish<br />
The Mat-Su<br />
There are no anadromous fish streams crossed or adjacent to the Mat-Su portion of the<br />
proposed KAC project; therefore, no anadromous fish are expected within this portion of the<br />
Study Area.<br />
<strong>Knik</strong> <strong>Arm</strong><br />
The 2004 <strong>and</strong> 2005 shoreline <strong>and</strong> mid-channel sampling collected both juveniles <strong>and</strong> adults<br />
of all five Pacific salmon species. Juvenile salmon numbers peak within <strong>Knik</strong> <strong>Arm</strong> from May<br />
into August, depending on species, <strong>and</strong> juvenile salmon use both nearshore <strong>and</strong> mid-channel<br />
habitats in <strong>Knik</strong> <strong>Arm</strong> during out-migration to marine feeding areas in lower Cook Inlet <strong>and</strong><br />
the Gulf of Alaska (Moulton 1997; KABATA 2005b, Pentec 2005). Adult salmon migrate<br />
through <strong>Knik</strong> <strong>Arm</strong> between May <strong>and</strong> September to reach spawning grounds in more than a<br />
dozen anadromous streams that empty into <strong>Knik</strong> <strong>Arm</strong> (KABATA 2005b). The Essential Fish<br />
Habitat Assessment (Appendix F) provides additional information on the life history <strong>and</strong><br />
habitat requirements of anadromous salmonids in <strong>Knik</strong> <strong>Arm</strong> as well as their distribution in<br />
the vicinity of the Study Area.<br />
Longfin smelt (Spirinchus thaleichthys) <strong>and</strong> eulachon are seasonally common in <strong>Knik</strong> <strong>Arm</strong>.<br />
Longfin smelt were the second <strong>and</strong> third most abundant species caught during the 2004<br />
<strong>and</strong> 2005 <strong>Knik</strong> <strong>Arm</strong> fish <strong>and</strong> benthos study (KABATA 2005b). Longfin smelt were observed<br />
throughout the summer in the lower <strong>and</strong> middle portions of <strong>Knik</strong> <strong>Arm</strong>, with peak abundances<br />
in October 2004 <strong>and</strong> June 2005. Eulachon move through <strong>Knik</strong> <strong>Arm</strong> in early spring (April <strong>and</strong><br />
May) to spawn in area streams. No eulachon were observed from July through<br />
November 2004 or 2005. More discussion of eulachon can be found in The Essential Fish<br />
Habitat Assessment (Appendix F).<br />
Two species of anadromous sticklebacks (threespine <strong>and</strong> ninespine; Gasterosteus aculeatus<br />
<strong>and</strong> Pungitius pungitius, respectively) are seasonally common in <strong>Knik</strong> <strong>Arm</strong>. Threespine<br />
stickleback has been the most abundant species overall in all systematic sampling programs<br />
conducted north of the Forel<strong>and</strong> Isl<strong>and</strong>s in Lower Cook Inlet (FHWA <strong>and</strong> ADOT&PF 1983;<br />
Moulton 1997; KABATA 2005b; Pentec 2005). In <strong>Knik</strong> <strong>Arm</strong>, densities peaked in June <strong>and</strong><br />
July with recruitment of large numbers of very small (0.5 to 1.0 inch) young-of-the-year fish<br />
(KABATA 2005b; Pentec 2005). Presence of these small fish in offshore as well as<br />
nearshore sampling suggests that they, like smaller juvenile salmonids, are being passively<br />
transported by strong currents.<br />
Subadult Bering cisco (Coregonus laurettae), rainbow trout (Oncorhynchus mykiss), <strong>and</strong><br />
Dolly Varden char (Salvelinus malma) were also occasionally taken in beach seine sampling<br />
in <strong>and</strong> near the Study Area (KABATA 2005b).<br />
Anchorage<br />
Anadromous fish within the Anchorage portion of the Study Area include Dolly Varden char<br />
<strong>and</strong> four Pacific salmon species discussed in the EFH section, above.<br />
12/18/07 3-201
<strong>Knik</strong> <strong>Arm</strong> Crossing DraftFinal EIS<br />
<strong>Affected</strong> <strong>Environment</strong><br />
3.8.8.2.3 Marine fish<br />
Previous studies have identified 15 nonsalmonid species of marine fish known to inhabit the<br />
waters of the Upper Cook Inlet (FHWA <strong>and</strong> ADOT&PF 1983; USEPA 1990;<br />
Moulton 1997). Of these, longfin smelt, eulachon, Pacific herring (Clupea pallasi), walleye<br />
pollock, saffron cod (Eleginus gracilis), two species of stickleback (Gasterosteus aculeatus<br />
<strong>and</strong> Pungitius pungitius), Bering cisco, Pacific staghorn sculpin, <strong>and</strong> ringtail snailfish<br />
(Liparus rutteri) were present in beach seine <strong>and</strong> tow net samples in the Study Area <strong>and</strong><br />
vicinity (KABATA 2005b). KABATA (2005b) also found snake prickleback (Lumpenus<br />
sagitta), a species not identified in previous studies.<br />
Attempts to sample subtidal demersal fish have had limited success both in 1983 (FHWA <strong>and</strong><br />
ADOT&PF) <strong>and</strong> 2004–2005 (KABATA 2005b), primarily because of the presence of large<br />
cobbles or boulders in areas where sampling was attempted. A few clingfish (Liparis rutteri)<br />
<strong>and</strong> starry flounder (Platichthys stellata) were the only fish captured in trawls.<br />
3.8.8.2.4 Freshwater fish<br />
The Mat-Su<br />
The Mat-Su has major fisheries for rainbow trout, Dolly Varden char, Arctic char (Salvelinus<br />
alpinus), Arctic grayling (Thymallus arcticus), lake trout (Salvelinus namaycush), northern<br />
pike (Esox lucius), burbot (Lota lota), whitefish (Coregonus <strong>and</strong> Prosopium spp.),<br />
l<strong>and</strong>locked salmon (Oncorhyncus spp.), <strong>and</strong> eulachon (Sweet et al. 2003). Northern pike are<br />
considered nonnative to the area as a result of illegal introductions into the waters of the<br />
Mat-Su. Other freshwater fish inhabiting the lakes, rivers, <strong>and</strong> streams include sticklebacks,<br />
suckers, <strong>and</strong> sculpins (MSB 2005b).<br />
Anchorage<br />
Creeks <strong>and</strong> rivers in the Anchorage area typically support one or more of the Pacific salmon<br />
species. In addition to salmonids, resident fish that may be found in area freshwater lakes <strong>and</strong><br />
streams include rainbow trout, Dolly Varden char, Arctic char, Arctic grayling, lake trout,<br />
<strong>and</strong> northern pike.<br />
3.8.8.3 Birds<br />
3.8.8.3.1 Freshwater birds<br />
Freshwater bird habitats in the Mat-Su portion of the Study Area include lakes <strong>and</strong> large<br />
ponds, small intermittent <strong>and</strong> perennial streams, <strong>and</strong> vegetated wetl<strong>and</strong>s. These wetl<strong>and</strong>s<br />
include sedge <strong>and</strong> grass bogs, <strong>and</strong> fens; shrub thickets, swamps, <strong>and</strong> bogs; <strong>and</strong> forested<br />
wetl<strong>and</strong>s.<br />
Bird species that utilized these habitats in the Study Area are common to both sides of <strong>Knik</strong><br />
<strong>Arm</strong> <strong>and</strong> include loons <strong>and</strong> grebes, Canada geese (Branta canadensis), several species of<br />
dabbling <strong>and</strong> diving ducks, s<strong>and</strong>hill cranes (Grus canadensis), <strong>and</strong> migrant <strong>and</strong> summer<br />
resident shorebirds, such as greater <strong>and</strong> lesser yellowlegs (Tringa flavipes), short-billed<br />
3-202 12/18/07
<strong>Knik</strong> <strong>Arm</strong> Crossing DraftFinal EIS<br />
<strong>Affected</strong> <strong>Environment</strong><br />
dowitchers (Limnodromus griseus), Wilson’s snipe (Gallinago gallinago), spotted s<strong>and</strong>piper<br />
(Actitis macularia), <strong>and</strong> least s<strong>and</strong>piper (Calidris minutilla) (Rothe et al. 1983; Scher 1993;<br />
West 2002; USGS n.d.). Belted kingfishers (Ceryle alcyon) utilize both the freshwater<br />
habitats <strong>and</strong> the waters of <strong>Knik</strong> <strong>Arm</strong> (KABATA 2006s).<br />
The diversity of freshwater habitat in the Anchorage portion of the Study Area is generally<br />
similar to that of the Mat-Su portion of the Study Area; the habitat may have been degraded,<br />
however, by development or proximity to development. Bird species utilizing these areas are<br />
similar.<br />
3.8.8.3.2 Terrestrial birds<br />
The Mat-Su <strong>and</strong> Anchorage<br />
Terrestrial bird habitats in the project area include the common vegetation communities, such<br />
as closed <strong>and</strong> open mixed needleleaf/deciduous forest <strong>and</strong> woodl<strong>and</strong>s, tall shrub communities<br />
of Sitka alder <strong>and</strong> willow, herbaceous meadows, <strong>and</strong> agricultural <strong>and</strong> developed areas.<br />
Barren <strong>and</strong> vegetated coastal bluffs along <strong>Knik</strong> <strong>Arm</strong> also provide habitat for birds.<br />
Terrestrial bird species are expected to be similar between the east <strong>and</strong> west sides of <strong>Knik</strong><br />
<strong>Arm</strong> <strong>and</strong> include both resident <strong>and</strong> migrant species (Scher 1993; West 2002; Andres 2005).<br />
Of the approximately 98 bird species that occur in the Study Area, 14 species are year-round<br />
residents <strong>and</strong> 44 are confirmed breeders (Roush <strong>and</strong> Andres 1994). Roughly 40 species of<br />
songbirds, or passerines, <strong>and</strong> neotropical migratory birds 53 inhabit terrestrial habitats of the<br />
Study Area. Some of the common types include raptors (hawks <strong>and</strong> owls), woodpeckers,<br />
flycatchers, swallows, corvids (crow family), chickadees <strong>and</strong> kinglets, thrushes, warblers,<br />
sparrows, <strong>and</strong> finches. The primary upl<strong>and</strong> game bird is the spruce grouse (Falcipennis<br />
canadensis), although the ruffed grouse (Bonasa umbellus) has been introduced to the Goose<br />
Bay area. 54<br />
3.8.8.3.3 Marine birds<br />
<strong>Knik</strong> <strong>Arm</strong><br />
Marine bird habitats in the KAC Study Area include estuarine open water habitats of <strong>Knik</strong><br />
<strong>Arm</strong>, intertidal unconsolidated s<strong>and</strong>/gravel beaches <strong>and</strong> mud flats, <strong>and</strong> a small area estuarine<br />
salt marsh north of the POA. 55<br />
Marine birds include species that nest on l<strong>and</strong> but forage in marine waters at least part of the<br />
year. Based on field surveys of <strong>Knik</strong> <strong>Arm</strong> bird use conducted for the proposed KAC project<br />
in April–September 2005 (KABATA 20056s), small numbers of loons, grebes, waterfowl,<br />
53 Neotropical migratory birds are those species that nest in the United States <strong>and</strong> Canada during the summer,<br />
then migrate south to the tropical regions of Mexico, Central <strong>and</strong> South America, <strong>and</strong> the Caribbean for the<br />
nonbreeding season.<br />
54 Personal communication, Steen, N. Retired Wildlife Biologist, ADF&G, with R. Raymond, September 2005.<br />
55 This wetl<strong>and</strong> area is permitted to be filled during Phase I of the POA Expansion Project under the<br />
U.S. Department of the <strong>Arm</strong>y.<br />
12/18/07 3-203
<strong>Knik</strong> <strong>Arm</strong> Crossing DraftFinal EIS<br />
<strong>Affected</strong> <strong>Environment</strong><br />
shorebirds, <strong>and</strong> raptors <strong>and</strong> moderate numbers of several gull species use the Study Area<br />
within <strong>Knik</strong> <strong>Arm</strong>. Four species of gull—herring gulls (Larus argentatus), glaucous-winged<br />
gulls (L. glaucescens), mew gulls (L. canus), <strong>and</strong> Bonaparte’s gulls (L. philidelphia)—are the<br />
primary marine birds using these estuarine habitats within <strong>Knik</strong> <strong>Arm</strong>. Other species,<br />
including small numbers of sea ducks, primarily greater scaup (Aythya marila) <strong>and</strong> scoters<br />
(Melanitte spp.), <strong>and</strong> occasionally dabblers, such as mallards (Anas plattyrhynchos),<br />
American wigeon (Anas americana), <strong>and</strong> green-winged teal (Anas crecca), occasionally<br />
make use of open water habitat. Arctic terns (Sterna paridisaea), listed as a Bird of<br />
Conservation Concern (USFWS 2002), are present on a regular basis on both sides of <strong>Knik</strong><br />
<strong>Arm</strong> in early summer. Other studies have documented 24 species of marine birds within<br />
Eagle River Flats <strong>and</strong> other tidal salt marshes just north of the Study Area (USDOA 2003).<br />
There were very few observations of shorebirds using the tidal flats in the Study Area during<br />
the 2005 field survey (KABATA 2006s). On the west side of <strong>Knik</strong> <strong>Arm</strong>, a few spotted<br />
s<strong>and</strong>pipers (Actitis macularia) were observed along the shore. Several flocks of red-necked<br />
phalaropes (Phalaropus lobatus) <strong>and</strong> small numbers of red phalaropes (Phalaropus fulicaria)<br />
were seen flying <strong>and</strong> swimming off the western shore during migration. One group of<br />
12 small s<strong>and</strong>pipers (“peeps”) l<strong>and</strong>ed on the east side flats during spring migration but flew<br />
off within a few minutes. A pair of greater yellowlegs (Tringa melanoleuca) was observed at<br />
the outflow of Sixmile Creek on a number of occasions, <strong>and</strong> probably nested nearby. At<br />
Cairn Point, one semipalmated plover (Charadrius semipalmatus) <strong>and</strong> a few spotted<br />
s<strong>and</strong>pipers (Actitis macularia) were observed. In comparison, during the peak spring <strong>and</strong> fall<br />
migration periods the tidal flats near Westchester Creek were host to dozens of Hudsonian<br />
godwits (Limosa haemastica), semipalmated plovers, greater <strong>and</strong> lesser yellowlegs, <strong>and</strong><br />
hundreds of dowitchers (Limnodroma griseus), all actively foraging or resting on the mud<br />
flats.<br />
The osprey (P<strong>and</strong>ion haliaetus) is a raptor that occasionally forages in the off-shore <strong>and</strong><br />
nearshore estuarine waters on both sides of <strong>Knik</strong> <strong>Arm</strong> (KABATA 2006s). A pair of osprey<br />
nested on a transmission tower south of Sixmile Creek on Elmendorf in summer 2005. 56<br />
The waters of <strong>Knik</strong> <strong>Arm</strong>, with its heavy silt load, provide little foraging habitat for many<br />
marine birds. However, marine birds have been observed foraging along the tidal rip in Cook<br />
Inlet (Moulton 1997). This behavior was also observed with phalaropes in the fish survey<br />
conducted for this Study in August 2005 (KABATA 2005b). The scarcity of infaunal <strong>and</strong><br />
epifaunal invertebrates in the exposed tidal flats provide little food for waterfowl <strong>and</strong><br />
shorebirds (KABATA 2005b). Based on field studies conducted for the proposed KAC<br />
project, estuarine habitats in lower <strong>Knik</strong> <strong>Arm</strong> are primarily used by birds for moving between<br />
Upper Cook Inlet <strong>and</strong> areas farther up <strong>Knik</strong> <strong>Arm</strong> <strong>and</strong> to a lesser extent for resting or foraging.<br />
In contrast, tidal flats off Ship Creek <strong>and</strong> at Westchester Lagoon at the mouth of Chester<br />
Creek near Anchorage (outside the Study Area) provide habitat for moderate numbers of<br />
migrating shorebirds <strong>and</strong> waterfowl (KABATA 2006s).<br />
56 Personal communication, Herman Greise, Wildlife Biologist, Elmendorf, telephone conversation with David<br />
Erikson, September 2005.<br />
3-204 12/18/07
<strong>Knik</strong> <strong>Arm</strong> Crossing DraftFinal EIS<br />
<strong>Affected</strong> <strong>Environment</strong><br />
3.8.8.3.4 Special status species<br />
Special status bird species were identified as an issue during the scoping process.<br />
Table 3-31 lists species that have been listed as Birds of Conservation Concern for the<br />
Southcentral <strong>and</strong> Interior Alaska Regions by USFWS <strong>and</strong> species of special concern by the<br />
State of Alaska. These lists cover the appropriate regions but include a broader range of<br />
habitat types than occur in the Study Area. Only four of the terrestrial-based species regularly<br />
occur in the Study Area—olive-sided flycatcher, gray-cheeked thrush, Townsend’s warbler,<br />
<strong>and</strong> blackpoll warbler (USGS n.d.; Sauer et al. 2005). Four species of marine-oriented birds<br />
are found near the Study Area.<br />
The terrestrial based species are all neotropical migrants that appear to nest in low densities<br />
in the Study Area, but no local abundance or trend information is available<br />
(Rothe et al. 1983; Scher 1993; USGS n.d.; Andres 2005; Sauer et al. 2005). All of these<br />
species arrive in Alaska in May or early June, forage on insects during the breeding season,<br />
<strong>and</strong> start their southward migrations in August. A major conservation concern for these<br />
species is habitat loss in both nesting <strong>and</strong> wintering areas due to logging, fire suppression,<br />
<strong>and</strong> road building. Pesticide contamination <strong>and</strong> increased predation as a result of habitat<br />
fragmentation are also concerns (Boreal Partners in Flight 1999).<br />
There are hundreds of marine bird species that have been documented to either reside in or<br />
migrate through the Upper Cook Inlet area (Scher 2002; West 2002), including ten marineassociated<br />
species that are listed as Birds of Conservation Concern (USFWS 2002). These<br />
are species that have experienced a long-term decline in abundance or are vulnerable to<br />
environmental disturbance in limited habitats. There is little known of the use of marine<br />
habitats in <strong>Knik</strong> <strong>Arm</strong> by these species, despite the area’s proximity to the major population<br />
centers of Anchorage <strong>and</strong> the Mat-Su. This can be partially attributed to the lack of public<br />
access to the east side of <strong>Knik</strong> <strong>Arm</strong> because of the military bases. Public access is also<br />
somewhat limited on the west side of <strong>Knik</strong> <strong>Arm</strong>.<br />
12/18/07 3-205
<strong>Knik</strong> <strong>Arm</strong> Crossing DraftFinal EIS<br />
<strong>Affected</strong> <strong>Environment</strong><br />
Table 3-31. Bird species of special status that could occur in the Study Area<br />
Common name<br />
Terrestrial-based species<br />
Scientific name<br />
USFWS Birds<br />
of Conservation<br />
Concern<br />
State of Alaska<br />
species of special<br />
concern<br />
American peregrine falcon Falco peregrinus anatum • •<br />
Rufous hummingbird Selasphorus Rufous •<br />
Olive-sided flycatcher Contopus cooperi • •<br />
Gray-cheeked thrush Caltharus minimus • •<br />
Arctic warbler Phylloscopus borealis •<br />
Townsend’s warbler Dendroica townsendi • •<br />
Blackpoll warbler Dendroica striata • •<br />
Marine-oriented species<br />
Arctic tern Sterna paradisaea •<br />
Marbled murrelet Brachyramphus marmoratus •<br />
American golden-plover Pluvialis dominica •<br />
Whimbrel Numenius phaeopus •<br />
Hudsonian godwit Limosa heamastica •<br />
Black turnstone Arenaria melanocephala •<br />
Surfbird Aphriza virgata •<br />
Red knot Calidris canutus •<br />
Rock s<strong>and</strong>piper Calidris ptilocnemis •<br />
Short-billed dowitcher Limnodromus griseus •<br />
Source: USFWS 2002; ADF&G 2005<br />
Bird species of special concern which appeared in the 2005 survey or other surveys are<br />
summarized below.<br />
Olive-sided flycatcher<br />
The olive-sided flycatcher is considered a special status species in the Study Area. The<br />
flycatcher is primarily found in coniferous forest biomes throughout North America, but is<br />
occasionally found in mixed deciduous/coniferous forests. The olive-sided flycatcher is<br />
associated with openings, including muskegs, meadows, disturbed burned <strong>and</strong> logged areas,<br />
streams, beaver ponds, bogs, <strong>and</strong> lakes. The olive-sided flycatcher is recognized by USFWS<br />
as a National Species of Management Concern (USFWS 1995) <strong>and</strong> by ADF&G as a species<br />
of special concern (ADF&G 2005c). The olive-sided flycatcher is listed as “rare” at<br />
Elmendorf <strong>and</strong> Fort Richardson, but occurs in low numbers in the greater Anchorage area<br />
(Rothe et al. 1983; Scher 1993; Andres 2005). Olive-sided flycatchers have been recorded in<br />
small-to-moderate numbers every year in all local breeding bird surveys (Sauer et al. 2005).<br />
Gray-cheeked thrush<br />
Gray-cheeked thrush nest in shrubs <strong>and</strong> low trees in mixed deciduous/coniferous woodl<strong>and</strong>s.<br />
Gray-cheeked thrush are listed as “rare to uncommon” at Elmendorf <strong>and</strong> Fort Richardson<br />
3-206 12/18/07
<strong>Knik</strong> <strong>Arm</strong> Crossing DraftFinal EIS<br />
<strong>Affected</strong> <strong>Environment</strong><br />
(USGS n.d.), but have not been recorded in breeding bird surveys along Burma Road or the<br />
military bases (Sauer et al. 2005).<br />
Townsend’s warbler<br />
Townsend’s warblers nest in coniferous forests, muskegs, <strong>and</strong> occasionally along rivers in<br />
red alder thickets. Large, continuous areas of mature coniferous forests with tall trees are<br />
preferred nesting habitat. Townsend’s warblers are listed as “uncommon” at Elmendorf <strong>and</strong><br />
Fort Richardson (USGS n.d.) but they have not been recorded in breeding bird surveys along<br />
Burma Road or the military bases (Sauer et al. 2005).<br />
Blackpoll warbler<br />
Blackpoll warblers nest in wet coniferous forests <strong>and</strong> mixed deciduous/coniferous<br />
woodl<strong>and</strong>s. Blackpoll warblers are listed as “uncommon” at Elmendorf <strong>and</strong> Fort Richardson<br />
(USGS n.d.) <strong>and</strong> have been recorded in small to moderate numbers every year in all local<br />
breeding bird surveys (Sauer et al. 2005).<br />
Arctic tern<br />
Arctic terns are present on a regular basis on both sides of <strong>Knik</strong> <strong>Arm</strong> in early summer 2005.<br />
Small numbers of Arctic terns were present on the east side of <strong>Knik</strong> <strong>Arm</strong> through July,<br />
usually flying along the water’s edge. This species was more common on the west side, but<br />
individuals were not present after July (KABATA 2006s).<br />
Hudsonian godwits<br />
Hudsonian godwits are common during migration in the Ship Creek <strong>and</strong> Chester Creek flats,<br />
but not in the Study Area (Gill <strong>and</strong> Tibbitts 1999; ASWG 2000; KABATA 2006s). 57<br />
Short-billed dowitchers<br />
Short-billed dowitchers are also common during migration in the Ship Creek <strong>and</strong> Chester<br />
Creek flats, but not in the Study Area (Gill <strong>and</strong> Tibbitts 1999; ASWG 2000;<br />
KABATA 2006s).<br />
Rock s<strong>and</strong>piper<br />
One winter resident shorebird, the rock s<strong>and</strong>piper (Calidris ptilocnemis), ranges throughout<br />
Upper Cook Inlet <strong>and</strong> may use marine habitats in <strong>Knik</strong> <strong>Arm</strong> (Gill <strong>and</strong> Tibbitts 1999;<br />
ASWG 2000). Flocks of rock s<strong>and</strong>pipers typically return to Cook Inlet in late August or early<br />
September (Gill <strong>and</strong> Tibbitts 1999), but were not observed during the 2005 study<br />
(KABATA 2006s).<br />
57 Spring migration usually occurs around the last week of April <strong>and</strong> first week of May. Mid-summer <strong>and</strong> fall<br />
migration occurs between the end of July <strong>and</strong> end of September.<br />
12/18/07 3-207
<strong>Knik</strong> <strong>Arm</strong> Crossing DraftFinal EIS<br />
<strong>Affected</strong> <strong>Environment</strong><br />
Bald eagles<br />
Bald eagles (Haliaeetus leucocephalus) reside <strong>and</strong> breed in the Study Area. They are<br />
commonly seen either perched in trees in forest habitat adjacent to the shoreline or flying<br />
along both sides of <strong>Knik</strong> <strong>Arm</strong>. Nesting territories occur on both sides of <strong>Knik</strong> <strong>Arm</strong> <strong>and</strong><br />
include one nest just north of Cairn Point <strong>and</strong> one near Sixmile Creek (KABATA 2006s;<br />
Shempf 1995) (Figure 3.57). An October 2005 survey conducted within the Study Area<br />
documented one additional nest on the north side of <strong>Knik</strong> <strong>Arm</strong>, on a small lake inl<strong>and</strong> from<br />
the coast north of Anderson Dock. After the breeding season, bald eagles congregate where<br />
food is available <strong>and</strong> may continue to roost near their nest trees.<br />
The bald eagle is protected under the Bald Eagle Protection Act (BEPA) of 1940 as amended<br />
(16 U.S.C. §§ 668-68d) <strong>and</strong> the Migratory Bird Treaty Act (MBTA) of 1918<br />
(16 U.S.C. §§ 703-12). The Bald Eagle Protection Act prohibits anyone from “taking” bald<br />
eagles, their eggs, nest or any part of these birds. The Act defines “taking” as “to pursue,<br />
shoot, shoot at, poison, wound, kill, capture, trap, collect, molest, or disturb.” USFWS<br />
recommends a primary 330-foot buffer zone <strong>and</strong> a secondary 660-foot buffer zone around<br />
eagle nest trees. The management objective of the primary zone is to provide protection of<br />
the juvenile eagles in the nest tree <strong>and</strong> to buffer the tree from human activities during nesting<br />
season (March through August), when nests are most vulnerable to disturbance by human<br />
activity such as logging <strong>and</strong> construction. The management objectives of the secondary zone<br />
are to protect the nest from noise <strong>and</strong> obstructive activities <strong>and</strong> to protect nesting habitat<br />
within the primary zone. The secondary zone extends from the primary zone to a distance of<br />
660 feet from the nesting tree. When topography or vegetation does not adequately protect<br />
the nest from human disturbance, the buffer zone may be increased by ¼ to ½ mile.<br />
However, the actual size of the buffer zone could vary depending on the eagle’s tolerance for<br />
human disturbance (USFWS n.d.).<br />
3-208 12/18/07
<strong>Knik</strong> <strong>Arm</strong> Crossing DraftFinal EIS<br />
<strong>Affected</strong> <strong>Environment</strong><br />
Figure 3.57. Bald eagle nest locations<br />
12/18/07 3-209
<strong>Knik</strong> <strong>Arm</strong> Crossing DraftFinal EIS<br />
<strong>Affected</strong> <strong>Environment</strong><br />
The bald <strong>and</strong> golden eagles were delisted as an endangered species in the Lower 48 states on<br />
August 8, 2007 by an amendment to 50 CFR Part 17 (72 Federal Register [FR] 37346 at<br />
37372, July 9, 2007). 58 Bald <strong>and</strong> golden eagles were not listed as an endangered or<br />
threatened species in Alaska. Accordingly, there is no change in their status under the<br />
Endangered Species Act. However, in connection with the delisting in the Lower 48 states,<br />
the USFWS has proposed a rulemaking to establish criteria for issuance of a permit to<br />
authorize activities that would ‘‘take’’ bald eagles under the BGEPA (72 FR 31141, June 5,<br />
2007). The rule is not yet final. A new regulatory definition of "disturb" at 50 CFR 22.3,<br />
implements the Bald <strong>and</strong> Golden Eagle Protection Act (72 FR 31132 June 5, 2007). The<br />
USFWS has issued National Bald Eagle Management Guidelines dated May 2007 to: (1)<br />
Publicize the provisions of the BGEPA <strong>and</strong> the Migratory Bird Treaty Act that continue to<br />
protect bald eagles to reduce the possibility that the law will be violated, (2) advise<br />
l<strong>and</strong>owners, l<strong>and</strong> managers, <strong>and</strong> the general public of the potential for various activities to<br />
disturb bald eagles, <strong>and</strong> (3) encourage l<strong>and</strong> management practices that benefit bald eagles<br />
<strong>and</strong> their habitat.<br />
3.8.8.4 Marine mammals<br />
Marine mammals that may occur in the Study Area include the Cook Inlet beluga whale<br />
(Delphinapterus leucas), harbor porpoise (Phocoena phocoena), killer whale (Orcinus orca),<br />
Steller sea lion (Eumetopias jubatus), <strong>and</strong> the harbor seal (Phoca vitulina). The Cook Inlet<br />
beluga whale is the most abundant marine mammal in the Study Area. Harbor porpoises <strong>and</strong><br />
killer whales have been observed in <strong>Knik</strong> <strong>Arm</strong>, but are considered rare. There have been no<br />
published sightings of Steller sea lions in <strong>Knik</strong> <strong>Arm</strong>, but a single adult male was documented<br />
in the Susitna Flats area 59 approximately 25 miles from the proposed KAC project area. See<br />
KABATA (2006t) in Appendix F for further discussion of other marine mammals.<br />
58 “This final rule revises 50 CFR 17.11(h) to remove the bald eagle in the lower 48 States from the Federal<br />
List of Endangered <strong>and</strong> Threatened Wildlife, <strong>and</strong> also removes the special rule for the bald eagle at 50 CFR<br />
17.41(a). The prohibitions <strong>and</strong> conservation measures provided by the Act [ESA], particularly sections 7, 9,<br />
<strong>and</strong> 10 no longer apply to this species. Federal agencies will no longer be required to consult with us under<br />
section 7 of the Act in the event that activities they authorize, fund, or carry out may affect the bald eagle.<br />
Critical habitat was not designated for the bald eagle, so the delisting will not affect critical habitat<br />
provisions of the Act.” 72 FR 37346, 37372 July 9, 2007.<br />
59 Personal communication, Matthew Eagleton, NMFS, with LGL Alaska Research Associates, Inc., 2005.<br />
3-210 12/18/07
<strong>Knik</strong> <strong>Arm</strong> Crossing DraftFinal EIS<br />
<strong>Affected</strong> <strong>Environment</strong><br />
During a year-long beluga whale study conducted for this project, 22 sightings of harbor<br />
seals were observed in September <strong>and</strong> October 2004 <strong>and</strong> June through September 2005.<br />
Fourteen of the sightings occurred within the general project area. An additional four<br />
sightings were reported during boat-based studies of the Eagle Bay <strong>and</strong> Sixmile Creek areas<br />
during August through October 2005 (Appendix F). Two of the boat-based sightings were in<br />
the general area of the proposed KAC project. In Alaska, pups are born between May <strong>and</strong><br />
mid-July. After about a month, they are weaned <strong>and</strong> separated from their mothers. Molting<br />
generally occurs in late summer (Kinkhart <strong>and</strong> Pitcher 1994). There are no known harbor seal<br />
haul-out sites in <strong>Knik</strong> <strong>Arm</strong>. 60 The closest established haul-out site to the Study Area is in the<br />
West Forel<strong>and</strong> approximately 72 miles southwest of Point MacKenzie. However, harbor<br />
seals have also been reported to haul-out intermittently near Susitna Flats <strong>and</strong> Turnagain <strong>Arm</strong><br />
at Chickaloon Bay. 61 When harbor seals are observed, they are most likely transiting through<br />
the Study Area, following prey, such as eulachon <strong>and</strong> salmon, into <strong>Knik</strong> <strong>Arm</strong>. There are no<br />
known ongoing studies being conducted on harbor seals in Upper Cook Inlet. 62<br />
In 2000, the Cook Inlet beluga whale stock was listed as “depleted” by NOAA Fisheries<br />
(NMFS 2000) under the Marine Mammal Protection Act (MMPA). In 2006, NOAA Fisheries<br />
changed the listing of the Cook Inlet beluga whale from Species of Concern under the ESA<br />
to a C<strong>and</strong>idate Species under the ESA. Currently, the stock being considered for listing as<br />
endangered or threatened under ESA (NOAA Fisheries 2006x-protected resources Species of<br />
Concern). The status review was completed in November 2006 (NOAA Fisheries 2006xstatus<br />
review). From 1994 to 1998, it is estimated that the population decreased from 653<br />
to 347, approximately 14 percent annually during that period (Hobbs et al. 2000; NOAA<br />
Fisheries 2005b). The decline in population was likely the result of a combination of factors,<br />
including str<strong>and</strong>ings (possibly due to avoidance of killer whales), predation by killer whales,<br />
<strong>and</strong> overhunting (Geraci et al. 1999; Huntington 2000; Mahoney <strong>and</strong> Sheldon 2000). For the<br />
past several years the population is was thought to have stabilized, with an estimated 300 to<br />
500 beluga whales now inhabit Cook Inlet (NOAA Fisheries 2005b). Based on the 2006<br />
population estimates completed by the National Marine Mammal Laboratory (NMML), the<br />
population is currently estimated at 302 individuals (95 percent confidence limits 200-410;<br />
NOAA Fisheries 2007). This estimate is slightly higher than the previous year’s estimate of<br />
278 individuals (95 percent confidence limits 194-398; NOAA Fisheries 2006a). Lowery et<br />
al. (2006) suggests there is a 71 percent probability that the population growth rate of Cook<br />
Inlet belugas is negative, with the best estimate indicating that the population is declining by<br />
1.2 percent per year. However, NOAA Fisheries estimates that from 1999-2006 annual<br />
estimates indicate an average decline of 4.1 percent per year (NOAA Fisheries 2007).<br />
60 Personal communication, Tim Markowitz , Marine Mammal Scientist, LGL Alaska Research Associates,<br />
Inc., telephone conversation with Lindsey Kendall, October 5, 2005.<br />
61 Personal communication, Dave Rugh, Fisheries Scientist, NOAA Fisheries, personal communication<br />
(unpublished data) with LGL Alaska Research Associates, Inc., 2005.<br />
62 Personal communication, Dave Rugh, Fisheries Scientist, NOAA Fisheries, email message to Lindsey<br />
Kendall, October 11, 2005.<br />
12/18/07 3-211
<strong>Knik</strong> <strong>Arm</strong> Crossing DraftFinal EIS<br />
<strong>Affected</strong> <strong>Environment</strong><br />
In March 2005 NOAA Fisheries prepared the Draft Conservation Plan for the Cook Inlet<br />
Beluga Whale. The document reviews <strong>and</strong> assesses the known <strong>and</strong> possible factors<br />
influencing the Cook Inlet beluga whale <strong>and</strong> develops <strong>and</strong> presents a Conservation Strategy<br />
to guide federal <strong>and</strong> other actions toward the goal of recovering this stock to a population of<br />
no fewer that 780 whales. The document also maps beluga whale habitat within Cook Inlet,<br />
including <strong>Knik</strong> <strong>Arm</strong> <strong>and</strong> the Study Area. The Study Area falls within Type 1 habitat termed<br />
“High Value/High Sensitivity” <strong>and</strong> Type 2 habitat termed “High Value.” NOAA Fisheries<br />
believes habitat considered “High Value/High Sensitivity” are areas most important <strong>and</strong><br />
sensitive areas for the Cook Inlet beluga whale. “High Value” habitat includes summer<br />
feeding areas <strong>and</strong> winter habitat in water where whales typically occur in lesser densities or<br />
in deeper waters, where they may be less prone to harassment <strong>and</strong> disturbance (NOAA<br />
Fisheries 2005).<br />
In August 2006, NOAA Fisheries released their review of a petition to list the Cook Inlet<br />
beluga whale as an endangered species (NMFS 2006). NOAA Fisheries found that the<br />
petition contained sufficient scientific or commercial information to warrant further action.<br />
Within 1 year of receipt of the petition, <strong>and</strong> pending completion of a status review initiated in<br />
April 2006, NOAA Fisheries will issue a finding whether or not to list Cook Inlet beluga as<br />
an endangered species under the Endangered Species Act (16 U.S.C. 1531).<br />
Long-term aerial surveys <strong>and</strong> satellite tracking conducted by NOAA Fisheries indicate<br />
seasonal patterns of movement for beluga whales within Cook Inlet. Beluga whales are<br />
mostly sighted in the inlet north of Kalgin Isl<strong>and</strong>. They tend to reside in <strong>Knik</strong> <strong>Arm</strong> in late<br />
summer-autumn <strong>and</strong> in Turnagain <strong>Arm</strong>/Chickaloon Bay in autumn. During the winter, they<br />
are often found in the middle of Cook Inlet, while in spring-early summer they occupy the<br />
Susitna/Beluga River area (NOAA Fisheries 2005).<br />
A year-long baseline study of beluga whale use of <strong>Knik</strong> <strong>Arm</strong> conducted for this EIS suggests<br />
that beluga whale use of <strong>Knik</strong> <strong>Arm</strong> is correlated with seasons <strong>and</strong> tides (KABATA 2006t).<br />
Seasonal use of <strong>Knik</strong> <strong>Arm</strong> is high during the fall (August–October), less frequent <strong>and</strong><br />
r<strong>and</strong>om during April–July <strong>and</strong> November–March. Beluga use of <strong>Knik</strong> <strong>Arm</strong> is infrequent<br />
during other times of the year (mid-December–March). During the fall, beluga whales transit<br />
between Eklutna, Eagle Bay, <strong>and</strong> Sixmile Creek. They tend to move to the head of <strong>Knik</strong> <strong>Arm</strong><br />
on the flood tide <strong>and</strong> out as far as Sixmile Creek on the ebb tide. They occasionally leave<br />
<strong>Knik</strong> <strong>Arm</strong> during the fall. At other times of the year, there were more infrequent whale<br />
sightings <strong>and</strong> a less noticeable pattern of tidal movements.<br />
Although observed throughout the year, beluga whale sightings were generally lower in the<br />
Study Area compared with other parts of <strong>Knik</strong> <strong>Arm</strong>. Belugas were seen most often in the<br />
Study Area during fall <strong>and</strong> spring <strong>and</strong> at low tide. They were observed less often during the<br />
winter <strong>and</strong> summer <strong>and</strong> high tides. Many of the Study Area sightings were associated with<br />
the whales transiting in <strong>and</strong> out of <strong>Knik</strong> <strong>Arm</strong>. Whales were observed diving more often <strong>and</strong><br />
resting less often while in the Study Area. See KABATA (2006t) for information collected<br />
during the beluga study on behavioral activities, sighting rates, <strong>and</strong> group composition.<br />
3-212 12/18/07
<strong>Knik</strong> <strong>Arm</strong> Crossing DraftFinal EIS<br />
<strong>Affected</strong> <strong>Environment</strong><br />
The beluga whale baseline study (KABATA 2006t) indicates that the Eklutna <strong>and</strong> Palmer<br />
Slough area may be important for calves, resting beluga whales, <strong>and</strong> as a refuge from<br />
predation, especially around high tide. Huntington (2000) described similar observations of<br />
females <strong>and</strong> calves using the Cottonwood Creek area as a nursery. At lower tides, beluga<br />
whales may gather at Eagle Bay <strong>and</strong> the mouth of Sixmile Creek to feed. Belugas have also<br />
been observed by the mouth of Ship Creek when fish are present (Huntington 2000)<br />
Beluga whales are opportunistic feeders known to feed on a wide range of prey including<br />
octopus, squid, crab, shrimp, clams, mussels, snails, s<strong>and</strong>worms, <strong>and</strong> fish such as capelin,<br />
cod, herring, smelt, flounder, sole, sculpin, lamprey, lingcod <strong>and</strong> salmon (Perez 1990; Haley<br />
1986; Klinkhart 1966). In addition, Alaskan Natives have reported belugas feeding on<br />
freshwater fish including trout, whitefish, <strong>and</strong> northern pike. Beluga whales primarily feed on<br />
fish, during the spring <strong>and</strong> summer (Huntington 2000). They forage throughout the water<br />
column, on the sea floor, <strong>and</strong> near the mouths of rivers <strong>and</strong> streams where there are high<br />
concentrations of fish (Kingsley et al. 2001; Martin 1996; Hazard 1988; NOAA<br />
Fisheries 2005). Belugas feed intensively, especially on salmon <strong>and</strong> eulachon. Belugas will<br />
often trap eulachon in an area <strong>and</strong> heavily feed on them. They have been observed chasing<br />
salmon <strong>and</strong> hunting down one salmon at distances of 600 feet (Huntington 2000). Adult<br />
males tend to feed on larger fish (e.g., adult salmon), while adult females feed on smaller<br />
fish, <strong>and</strong> younger whales feed on very small prey such as shrimp (Lowry et al. 1985). Very<br />
little is known about their winter foraging habits (NOAA Fisheries 2005).<br />
During the Marine Fish <strong>and</strong> Benthos Studies in <strong>Knik</strong> <strong>Arm</strong> (KABATA 2005b), data were<br />
collected at sites where belugas had been observed moving through the area shortly before<br />
the samples were gathered. In August 2004, fish samples were collected at the south entrance<br />
to Eagle Bay, the north entrance to Eagle Bay, <strong>and</strong> west of Fire Creek. In May 2005,<br />
sampling occurred near the north entrance to Eagle Bay, the north entrance to Goose Bay,<br />
<strong>and</strong> west of Fire Creek. On two other occasions, after fish samples had been collected with a<br />
relatively poor catch, belugas moved through sampling stations near Port MacKenzie <strong>and</strong> the<br />
POA. Additional fish population studies near suspected beluga feeding areas need to be<br />
conducted to confirm the beluga diet in <strong>Knik</strong> <strong>Arm</strong>. FHWA is seeking authorization from<br />
NOAA Fisheries for the accidental taking of small numbers of marine mammals under its<br />
jurisdiction. 63<br />
Generalizations can be made regarding the diet of beluga whales in <strong>Knik</strong> <strong>Arm</strong> (Table 3-32)<br />
based on a comparison of fish found in stomach analyses of Cook Inlet beluga whales 64 <strong>and</strong><br />
fish species observed in <strong>Knik</strong> <strong>Arm</strong> (KABATA 2005b). The common fish species were<br />
salmon, eulachon, <strong>and</strong> saffron cod.<br />
63 Federal Register, August 23, 2006, [7(163).49.433-49.436]<br />
64 Personal communication, Daniel Vos, NOAA Fisheries, e-mail message to Lindsey Kendall, February 13,<br />
2006.<br />
12/18/07 3-213
<strong>Knik</strong> <strong>Arm</strong> Crossing DraftFinal EIS<br />
<strong>Affected</strong> <strong>Environment</strong><br />
Table 3-32. A comparison of fish found in the stomach<br />
analyses of Cook Inlet beluga whales <strong>and</strong> fish observed in<br />
<strong>Knik</strong> <strong>Arm</strong> (beluga prey species in <strong>Knik</strong> <strong>Arm</strong>)<br />
April<br />
May<br />
June<br />
July<br />
August<br />
September<br />
October<br />
November<br />
Cook Inlet beluga<br />
stomach analysis a,b<br />
saffron cod<br />
walleye pollock<br />
pacific cod<br />
eulachon<br />
polychaete jaws<br />
eggs<br />
crab<br />
shrimp<br />
unidentified salmon spp.<br />
eulachon<br />
unidentified salmon spp.<br />
coho salmon<br />
unidentified salmon spp.<br />
coho salmon<br />
chum salmon<br />
yellowfin sole flounder<br />
unidentified salmon spp.<br />
saffron cod<br />
coho salmon<br />
cod<br />
unidentified cod spp<br />
saffron cod<br />
pacific staghorn sculpin<br />
yellowfin sole flounder<br />
starry flounder<br />
Beluga prey species<br />
in <strong>Knik</strong> <strong>Arm</strong> c<br />
saffron cod<br />
eulachon<br />
chinook salmon<br />
eulachon<br />
saffron cod<br />
chinook salmon<br />
saffron cod (questionable)<br />
pink salmon<br />
chum salmon<br />
sockeye salmon<br />
coho salmon<br />
coho salmon<br />
saffron cod<br />
saffron cod<br />
longfin smelt<br />
saffron cod<br />
longfin smelt<br />
saffron cod<br />
a e-mail from Daniel Voss, NOAA Fisheries, February 13, 2006<br />
b stomach analyses throughout Cook Inlet; many species listed in this study<br />
have not been observed in <strong>Knik</strong> <strong>Arm</strong><br />
c<br />
KABATA 2005b<br />
3.8.8.5 Terrestrial mammals<br />
The relatively undisturbed nature of the Study Area in the Mat-Su provides habitat for<br />
numerous mammal species, including large <strong>and</strong> small game, furbearers, <strong>and</strong> various nongame<br />
species. The main big game species found in the area include black bear (Ursus americanus),<br />
brown bear (Ursus arctos), <strong>and</strong> moose (Alces alces gigas). 65<br />
65 Scoping comments received from ADF&G, ADNR OHMP, <strong>and</strong> the public as part of the proposed KAC<br />
project indicated that moose <strong>and</strong> bears are of particular concern. Therefore, these species are the focus of the<br />
terrestrial mammal discussion.<br />
3-214 12/18/07
<strong>Knik</strong> <strong>Arm</strong> Crossing DraftFinal EIS<br />
<strong>Affected</strong> <strong>Environment</strong><br />
Fifty two species of mammals are found in the Anchorage area (ADF&G 2000). Because of<br />
resource <strong>and</strong> public interest, moose <strong>and</strong> bears are the primary focus of the terrestrial mammal<br />
discussion for the Anchorage area. Recent field surveys indicated that the beach extending<br />
north from the POA is used as a wildlife movement corridor for many Anchorage area<br />
mammal species. During field investigations conducted for the proposed KAC project,<br />
mammal tracks were observed along this stretch of beach, including those of bear, moose,<br />
fox, <strong>and</strong> coyote. In addition, a bear cache of a moose carcass was observed. It is likely that<br />
mammals use one of the existing small drainages to descend from the top of the bluff <strong>and</strong> use<br />
the beach for easier movement. Other incidental observations of mammals in this area were<br />
made during beluga whale observations (KABATA 2006t) <strong>and</strong> are included in the Terrestrial<br />
Mammal Technical Report (KABATA 2006p).<br />
3.8.8.5.1 Black bear<br />
The Mat-Su<br />
The exact size of the black bear population in the Mat-Su portion of the Study Area is not<br />
known, but speculated to be between 500 <strong>and</strong> 1,000 within Game Management Unit<br />
(GMU) 14 (Figure 3.58, McDonough 2002). 66 Black bear distribution during spring,<br />
summer, <strong>and</strong> fall is largely determined by food availability. Dense populations are found in<br />
the Susitna Valley, along the Susitna River west of Willow, <strong>and</strong> at the Susitna River mouth<br />
north to Susitna Station (Mat-Su Borough 2005f). Black bears are opportunistic feeders that<br />
will eat both plant <strong>and</strong> animal foods, including carrion. Black bear habitats in the Mat-Su<br />
include broadleaf forest, mixed needleleaf/broadleaf forest, tall <strong>and</strong> low shrub, sedge <strong>and</strong><br />
grass wetl<strong>and</strong>s, <strong>and</strong> alpine tundra plant communities (Mat-Su Borough 2005f). Of these,<br />
broadleaf forest <strong>and</strong> mixed needleleaf/broadleaf forest types dominate the habitat in the<br />
Study Area.<br />
The hunting season for black bear is open all year in GMU 14A, with a limit of one black<br />
bear per licensed hunter per year (ADF&G 2005d). The average annual black bear harvest<br />
was 106 in GMU 14 <strong>and</strong> 45 in GMU 14A between 1996 <strong>and</strong> 2000 (McDonough 2002). The<br />
average annual harvest in GMU 14 increased to 116 bears between 1999 <strong>and</strong> 2004 (ADF&G<br />
2005e). From July 1998 to June 2001, there were 20 reported nonhunting kills of black bear<br />
in GMU 14A (McDonough 2002). These were primarily kills from defense of life or<br />
property.<br />
66 The Study Area is found within ADF&G Game Management Unit (GMU) 14. The Mat-Su <strong>and</strong> Anchorage<br />
portions of the Study Area are within GMU 14A <strong>and</strong> 14C, respectively (Figure 3.62).<br />
12/18/07 3-215
<strong>Knik</strong> <strong>Arm</strong> Crossing DraftFinal EIS<br />
<strong>Affected</strong> <strong>Environment</strong><br />
Figure 3.58. Southcentral Alaska Game Management Units<br />
3-216 12/18/07
<strong>Knik</strong> <strong>Arm</strong> Crossing DraftFinal EIS<br />
<strong>Affected</strong> <strong>Environment</strong><br />
Anchorage<br />
Approximately 250 black bears inhabit the Anchorage area (including Chugach State Park)<br />
<strong>and</strong> approximately one-third of these bears spend at least part of the summer in or adjacent to<br />
residential areas in the Anchorage Bowl (ADF&G 2000). Black bears in Anchorage prefer<br />
forested habitat, including stream corridors, <strong>and</strong> can easily become attracted to human food<br />
sources such as trash, pet food, <strong>and</strong> birdseed.<br />
Black bear hunting regulations within GMU 14C vary by Management Area. There is no<br />
open season for black bear within Elmendorf, Fort Richardson, Anchorage, Birchwood, <strong>and</strong><br />
portions of the Eagle River Management Areas. Other Management Areas of GMU 14C have<br />
restricted seasons, while others are open all year (ADF&G 2005d). The average annual black<br />
bear harvest in GMU 14 was 116 bears from 1999 to 2004 (ADF&G 2005e). From 1996<br />
to 2000, total annual black bear harvest in GMU 14C ranged from 34 to 51 bears<br />
(McDonough 2002). From July 1998 to June 2001, there were 28 reported nonhunting kills<br />
of black bear in GMU 14C (McDonough 2002). These were primarily kills from defense of<br />
life or property.<br />
3.8.8.5.2 Brown Bear<br />
The Mat-Su<br />
Brown bear are generally less common than black bears in the Mat-Su. The population in<br />
GMU 14 was last estimated to be between 125 <strong>and</strong> 232 bears (Del Frate 2003). Brown bears<br />
are usually found along river drainages searching for fish <strong>and</strong> have similar feeding habitats as<br />
the black bear (Mat-Su Borough 2005). In the spring, they also use the salt marshes <strong>and</strong><br />
sedge meadows at Susitna Flats as feeding habitat (ADF&G 2003a).<br />
Hunting regulations allow for the harvest of one brown bear per licensed hunter every four<br />
regulatory seasons, 67 between September 1 <strong>and</strong> May 31 in GMU 14A (ADF&G 2005d). The<br />
average annual brown bear harvest from 1999 to 2004 for GMU 14 was 22 bears (ADF&G<br />
2005e). Brown bear harvest data specific to GMU 14A were not available. In GMU 14, there<br />
were seven nonhunting mortalities in 2000 <strong>and</strong> two in 2001, one killed by a vehicle collision<br />
<strong>and</strong> the rest in defense of life or property (Del Frate 2003). Six of those kills were in<br />
GMU 14A (Del Frate 2003).<br />
Anchorage<br />
Approximately 60 brown bears inhabit the Anchorage area (including Chugach State Park)<br />
<strong>and</strong> 4–5 are regularly seen in residential areas each summer (ADF&G 2000). Brown bears<br />
are opportunistic feeders, which brings them into contact with human development to feed at<br />
garbage dumps <strong>and</strong> other sites (Pasitschiak-Arts 1993). They are also occasionally attracted<br />
to the Anchorage Bowl by winter-killed moose, abundant moose calves in the spring, <strong>and</strong><br />
spawning salmon in the streams (ADF&G 2000).<br />
67 A regulatory season begins July 1 <strong>and</strong> continues through June 30 the following calendar year.<br />
12/18/07 3-217
<strong>Knik</strong> <strong>Arm</strong> Crossing DraftFinal EIS<br />
<strong>Affected</strong> <strong>Environment</strong><br />
In GMU 14C, there is no open season for brown bear in the Eagle River, Fort Richardson,<br />
Elmendorf, Birchwood, <strong>and</strong> Chugach State Park Management Areas (ADF&G 2005d). The<br />
5-year (1999–2004) average brown bear harvest for GMU 14 was 22 bears (ADF&G 2005e).<br />
Brown bear harvest data specific to GMU 14C were not available. No brown bear<br />
nonhunting mortalities were documented in GMU 14C from July 2000 to June 2002 (Del<br />
Frate 2003).<br />
3.8.8.5.3 Moose<br />
The Mat-Su<br />
About 6,560 resident <strong>and</strong> migratory moose inhabit GMU 14A (Figure 3.59). With a winter<br />
moose population of between 10 <strong>and</strong> 20 moose per square mile, the Point MacKenzie area,<br />
including the Point MacKenzie Agricultural Area, hosts some of the highest concentrations<br />
of moose in Alaska (Del Frate 2004a). Moose populations are high, especially during winter,<br />
because of browsing opportunities <strong>and</strong> the opportunity for relief from high snow. Moose feed<br />
on early successional species, including willow, birch, aspen, poplar, alder, cottonwood, <strong>and</strong><br />
a variety of herbaceous species (Mat-Su Borough 2005). 68 The Point MacKenzie Agricultural<br />
Area <strong>and</strong> the 37,000-acre area burned during the 1996 Big Lake fire are ideal habitats for<br />
moose browsing because of the subsequent return of early vegetation. It is not known what<br />
proportion of the moose in the Point MacKenzie Agricultural Area <strong>and</strong> the Big Lake fire area<br />
are migratory <strong>and</strong> where the migratory individuals spend nonwinter months (Del<br />
Frate 2004a).<br />
Moose in the Study Area primarily winter in lowl<strong>and</strong> riparian <strong>and</strong> wetl<strong>and</strong> areas, <strong>and</strong> on<br />
south-facing alpine slopes <strong>and</strong> other upl<strong>and</strong> areas supporting willow, birch, <strong>and</strong> other forage<br />
species (Mat-Su Borough 2005). Many moose winter in the Susitna Flats seeking food <strong>and</strong><br />
refuge from the snow (ADF&G 2003a). Each spring, moose calving occurs outside the Study<br />
Area in the inl<strong>and</strong> portions of Goose Bay SGR, north of Point MacKenzie, <strong>and</strong> the brushy<br />
thickets of Susitna Flats (ADF&G 2003b). Moose spend summer <strong>and</strong> fall in lowl<strong>and</strong>s<br />
throughout the Study Area. Figure 3.59 shows moose habitat in <strong>and</strong> around the Study Area.<br />
Hunting regulations in GMU 14A allow for residents <strong>and</strong> nonresidents to harvest one bull<br />
moose per season, with residents having the option to harvest one antlerless moose instead.<br />
Open season typically runs from early August to the end of September, with the season<br />
beginning with a bow-<strong>and</strong>-arrow-only period (ADF&G 2005d). Moose harvest in GMU 14A<br />
ranged from 319 to 590 per year between 1998 <strong>and</strong> 2003 (Del Frate 2004a).<br />
68 Plant succession refers to the change in the plant species composition of an area over time, often following a<br />
disturbance (e.g., fire). The first plant species to establish in an area following a disturbance would be<br />
considered early successional species.<br />
3-218 12/18/07
<strong>Knik</strong> <strong>Arm</strong> Crossing DraftFinal EIS<br />
<strong>Affected</strong> <strong>Environment</strong><br />
Figure 3.59. Study Area moose habitat<br />
12/18/07 3-219
<strong>Knik</strong> <strong>Arm</strong> Crossing DraftFinal EIS<br />
<strong>Affected</strong> <strong>Environment</strong><br />
Among the fastest growing areas of the state, the Mat-Su is characterized by l<strong>and</strong> clearing<br />
activities associated with settlement <strong>and</strong> road construction. These activities promote the<br />
growth of moose browse <strong>and</strong> in turn increase the number of moose/human conflicts<br />
(Del Frate 2004a). Accidental human-caused moose mortality during the 5-year period<br />
1998-2002 averaged 166 moose killed by highway vehicles <strong>and</strong> 15 by train (Del<br />
Frate 2004a). In 1995, the Glenn Highway (from the Matanuska River north to the junction<br />
with the Parks Highway) <strong>and</strong> the <strong>Knik</strong>-Goose Bay Road ranked fifth <strong>and</strong> sixth, respectively,<br />
for highest moose accident rates in the state (ADOT&PF 1995). Accident rates on the Glenn<br />
Highway along the Palmer Hay Flats SGR have decreased since those reported in 1995. For<br />
the period 1988-1992, the accident rate for this Glenn Highway segment exceeded<br />
1.00 accident per million vehicle miles (MVM) for its entire length (ADOT&PF 1995). The<br />
maximum accident rate for this segment for the period 1999-2003 was 0.32 accidents per<br />
MVM (Terrestrial Mammal Technical Report [KABATA 2006p]). The Big Lake fire in 1996<br />
likely reduced the movement of moose through that area, which has contributed to the lower<br />
moose-vehicle accident rate in that highway segment.<br />
Anchorage<br />
Moose were uncommon in the Anchorage area before the 1940s. However, the development<br />
of Anchorage <strong>and</strong> Fort Richardson in the late 1940s resulted in the creation of moose browse<br />
which increased moose population in the area (Sinnott 2004). Currently in the Anchorage<br />
Bowl, approximately 200–300 moose inhabit the area year-round <strong>and</strong> 700–1,000 inhabit the<br />
area during the winter (ADF&G 2000). In GMU 14C, prime browse occurs in opencanopied,<br />
second-growth willow, birch, <strong>and</strong> aspen st<strong>and</strong>s on burned-over military l<strong>and</strong>s, <strong>and</strong><br />
on several hundred acres of military l<strong>and</strong>s that have been rehabilitated during the last<br />
2 decades (Sinnott 2004). Several thous<strong>and</strong> acres of lowl<strong>and</strong> moose habitat are on military<br />
l<strong>and</strong>s between lower Ship Creek <strong>and</strong> Eagle River (Sinnott 2004). Moose in Anchorage are<br />
primarily found in parks, greenways, <strong>and</strong> undeveloped space, <strong>and</strong> frequently visit suburban<br />
neighborhoods where browse is available (ADF&G 2000). Figure 3.59 shows moose habitat<br />
in <strong>and</strong> around the Study Area.<br />
Hunting regulations vary; moose may be hunted, however, in every Management Area within<br />
GMU 14C (ADF&G 2005d). The average annual moose harvest for GMU 14 from 1999<br />
to 2004 was 587 moose (ADF&G 2005e). About 100 moose are harvested annually in local<br />
hunts, most of which occur on the military reservations (ADF&G 2000).<br />
An average of about 156 moose were killed each year in vehicle collisions in the entire<br />
Anchorage area between 1994 <strong>and</strong> 1999 (ADF&G 2000). The high number of moose-vehicle<br />
accidents in 1994–1995 (about 240) resulted from a severe winter that forced record numbers<br />
of moose into the Anchorage area seeking relief from deep snow.<br />
3-220 12/18/07
<strong>Knik</strong> <strong>Arm</strong> Crossing DraftFinal EIS<br />
<strong>Affected</strong> <strong>Environment</strong><br />
3.8.8.5.4 Other mammals<br />
The Mat-Su<br />
Numerous furbearers <strong>and</strong> small game species are found in the Mat-Su, including beaver<br />
(Castor canadensis), coyote (Canis latrans), ermine (Mustela erminea), northern flying<br />
squirrel (Glaucomys sabrinus), Arctic ground squirrel (Spermophilus parryi), river otter<br />
(Lontra canadensis), lynx (Lynx canadensis), hoary marmot (Marmota caligata), mink<br />
(Mustela vison), martin (Martes americana), muskrat (Ondatra zibethica), red fox (Vulpes<br />
vulpes), red squirrel (Tamiasciurus hudsonicus), weasel (Mustela nivalis), wolf (Canis<br />
lupus), <strong>and</strong> wolverine (Gulo gulo) (Mat-Su Borough 2005). Most furbearer species are found<br />
in riparian, wetl<strong>and</strong>, or forested areas, which are abundant in the Mat-Su Study Area.<br />
Anchorage<br />
Other mammals in the Anchorage area include beaver (approximately 150 in the Anchorage<br />
Bowl), wolves (two active packs in the Anchorage Bowl), wolverine, coyote, lynx, snowshoe<br />
hare (Lepus americanus), red fox, mink, weasel, martin, porcupine (Erethizon dorsatum), red<br />
squirrel, northern flying squirrel, hoary marmot, little brown bat (Myotis lucifugus), <strong>and</strong><br />
mice, voles, <strong>and</strong> shrews (Sorex spp.; ADF&G 2000). There are also hundreds of feral rabbits<br />
(Oryctolagus cuniculus), descended from tame rabbits released by humans <strong>and</strong> adapted well<br />
to survival in urban <strong>and</strong> suburban environments.<br />
3.8.9 Threatened or Endangered Species<br />
Currently, USFWS <strong>and</strong> NOAA Fisheries indicate that there are no threatened or endangered<br />
species listed under the Endangered Species Act (ESA) in the Study Area. 69 The Cook Inlet<br />
beluga whale stock is listed as “depleted” under the Marine Mammal Protection Act<br />
(MMPA). In August 2006, NOAA Fisheries released their review of a petition to list the<br />
Cook Inlet beluga whale as an endangered species (NMFS 2006). NOAA Fisheries found<br />
that the petition contained sufficient scientific or commercial information to warrant further<br />
action. Within 1 year of receipt of the petition, <strong>and</strong> pending completion of a status review<br />
initiated in April 2006, NOAA Fisheries will issue a finding whether or not to list Cook Inlet<br />
Beluga as an endangered species under the Endangered Species Act (16 U.S.C. 1531). In<br />
addition, NOAA Fisheries changed the listing of the Cook Inlet beluga whale from Species<br />
of Concern to a C<strong>and</strong>idate Species because the stock is actively being considered for listing<br />
as endangered or threatened under ESA (NOAA Fisheries 2006x-protected resources Species<br />
of Concern). The stock’s status review was completed in November 2006 (NOAA Fisheries<br />
2006x-status review). Detailed information regarding beluga whales is found in<br />
Section 3.8.8.4.<br />
69 Personal communications: James W. Balsiger, National Oceanic <strong>and</strong> Atmospheric Administration (NOAA)<br />
Fisheries, letter to Edrie Vinson regarding listed endangered or threatened species in the Study Area <strong>and</strong><br />
Gregory Risdahl, U.S. Fish <strong>and</strong> Wildlife Service (USFWS), letter to Edrie Vinson regarding listed<br />
endangered or threatened species in the Study Area, 2005.<br />
12/18/07 3-221
<strong>Knik</strong> <strong>Arm</strong> Crossing DraftFinal EIS<br />
<strong>Affected</strong> <strong>Environment</strong><br />
No State Listed Endangered Species are found within the Study Area. Four bird species, the<br />
olive-sided flycatcher, the blackpoll warbler, the Townsend’s warbler, <strong>and</strong> the grey-cheeked<br />
thrush—are each listed as an Alaska species of special concern <strong>and</strong> may be found in the<br />
Study Area. Five state species of concern, however, may be found in the Study Area. These<br />
species include the Cook Inlet beluga whale, the olive-sided flycatcher, the blackpoll<br />
warbler, the Townsend’s warbler, <strong>and</strong> the grey-cheeked thrush (ADF&G 2005c). These bird<br />
state species of concern are addressed in detail in Sections 3.8.8.3 <strong>and</strong> 3.8.8.4.<br />
3.8.10 Permits<br />
Development of the KAC Project will require permits, reviews, <strong>and</strong> consultations by federal,<br />
state, <strong>and</strong> municipal resource <strong>and</strong> regulatory agencies. FHWA has relied on the guidance<br />
provided in “Applying the Section 404 Permit Process to Federal-Aid Highway Projects”<br />
(FHWA 1988) for the proposed project. Cooperating agencies (listed in Section 7) have been<br />
consulted throughout the process <strong>and</strong> will continue to be involved as permit applications are<br />
finalized <strong>and</strong> submitted.<br />
Draft permit applications <strong>and</strong> requisite supporting documentation, including a consistent,<br />
comprehensive project description, have been prepared for the Preferred Alternative. As<br />
design details for the proposed KAC project mature, permit applications will be finalized <strong>and</strong><br />
submitted to the appropriate agencies.<br />
Federal, state, <strong>and</strong> local laws authorize agencies to issue permits, review plans, <strong>and</strong> provide<br />
consultations on possible project impacts. Table 3-34 identifies the statutes, regulations, <strong>and</strong><br />
executive orders that govern permits, consultation, coordination, <strong>and</strong> review requirements<br />
that have been identified as pertinent to the proposed KAC project.<br />
3-222 12/18/07
<strong>Knik</strong> <strong>Arm</strong> Crossing DraftFinal EIS<br />
<strong>Affected</strong> <strong>Environment</strong><br />
Table 3-33. Applicable federal, state, <strong>and</strong> local legislation<br />
Relevant legislation Agency Description<br />
Federal<br />
Rivers <strong>and</strong> Harbors Act,<br />
Section 10, 33 U.S.C. § 403; Clean<br />
Water Act (CWA), § 404,<br />
33 U.S.C. § 1344<br />
Rivers <strong>and</strong> Harbors Act, Section 9,<br />
33 U.S.C. § 403; General <strong>Bridge</strong> Act<br />
of 1946<br />
Department of Transportation Act<br />
of 1966 (as amended), Section 4(f),<br />
49 U.S.C. § 303;<br />
23 U.S.C. § 138 Regulations:<br />
23 C.F.R. § 771.135<br />
National Historic Preservation Act,<br />
Section 106, 16 U.S.C. § 470 et<br />
seq.<br />
Marine Mammal Protection Act,<br />
16 U.S.C. § 1631; Incidental<br />
Harassment Authorization,<br />
16 U.S.C. § 1374<br />
Bald Eagle Protection Act,<br />
16 U.S.C. §§ 668-68d, as amended<br />
Endangered Species Act,<br />
Section 7(a)(2),<br />
16 U.S.C. §§ 1531-44<br />
USACE<br />
USCG<br />
FHWA<br />
FHWA in<br />
consultation with<br />
SHPO<br />
National Oceanic<br />
<strong>and</strong> Atmospheric<br />
Administration<br />
(NOAA)<br />
Fisheries <strong>and</strong><br />
U.S. Fish <strong>and</strong><br />
Wildlife Service<br />
(USFWS)<br />
USFWS<br />
NOAA Fisheries<br />
<strong>and</strong> USFWS<br />
Prevents unauthorized obstruction or<br />
alteration of navigable waters of the<br />
United States (Section 10).<br />
Authorizes the Department of the<br />
<strong>Arm</strong>y to issue permits (Section 404)<br />
for the discharge of dredged or fill<br />
material into the waters of the United<br />
States at specified disposal sites<br />
USCG has jurisdiction over bridges<br />
<strong>and</strong> structures crossing navigable<br />
waters of the United States that relate<br />
to location, clearances of bridges,<br />
bridge permits, construction activities,<br />
navigation lights, <strong>and</strong> signals at<br />
bridges<br />
The intent of the Section 4(f) statute<br />
<strong>and</strong> the policy of USDOT is to avoid<br />
the use of significant public parks,<br />
recreation areas, wildlife <strong>and</strong><br />
waterfowl refuges <strong>and</strong> historic sites<br />
as part of a project, unless there is no<br />
feasible <strong>and</strong> prudent alternative to the<br />
use of such l<strong>and</strong>.<br />
Provides for the identification <strong>and</strong><br />
protection of historic properties.<br />
Requires federal agencies to avoid<br />
<strong>and</strong> minimize impacts to properties in<br />
or eligible for the National Register of<br />
Historic Places.<br />
Regulates the “take” of any marine<br />
mammal species in U.S. waters. Take<br />
includes harassment, attempt to<br />
harass, or annoyance that has<br />
potential to injure or disrupt behavior<br />
patterns.<br />
Provides protection of the bald eagle<br />
<strong>and</strong> golden eagle by prohibiting,<br />
except under specified conditions, the<br />
taking, possession, <strong>and</strong> commerce of<br />
such birds<br />
Federal agencies that permit, license,<br />
fund, or otherwise authorize activities<br />
must ensure that their actions will not<br />
jeopardize the continued existence of<br />
any listed species. Consultation<br />
(informal or formal) is required.<br />
EIS sections<br />
<strong>and</strong><br />
appendixes<br />
Sections 3.2.2.<br />
2, 3.8.12<br />
<strong>and</strong> 4.8.12<br />
Section 3.2.3.2<br />
Section 3.7<br />
Sections 3.6.1,<br />
4.6.1<br />
<strong>and</strong> 4.9.4.6.1<br />
Sections<br />
3.8.8.4, 4.8.8.4,<br />
<strong>and</strong> 4.9.4.8.8<br />
Sections<br />
3.8.8.3, 4.8.8.3<br />
<strong>and</strong> 4.9.4.8.8<br />
Sections 3.8.9,<br />
4.8.9, <strong>and</strong><br />
4.9.4.8.11<br />
(continued on next page)<br />
12/18/07 3-223
<strong>Knik</strong> <strong>Arm</strong> Crossing DraftFinal EIS<br />
<strong>Affected</strong> <strong>Environment</strong><br />
Table 3-33. Applicable federal, state, <strong>and</strong> local legislation (continued)<br />
Relevant legislation Agency Description<br />
Federal<br />
Magnuson-Stevens Fishery<br />
Conservation <strong>and</strong><br />
Management<br />
Act/Sustainable Fisheries<br />
Act,<br />
16 U.S.C. § 1801 et seq.<br />
Migratory Bird Treaty Act,<br />
16 U.S.C. §§ 703-12<br />
Fish <strong>and</strong> Wildlife<br />
Coordination Act,<br />
16 U.S.C. § 662<br />
Clean Air Act,<br />
40 C.F.R. § 60<br />
Uniform Relocation <strong>and</strong><br />
Real Property Acquisition<br />
Act, 42 § 4601 et seq.<br />
43 C.F.R. §§ 2800<br />
<strong>and</strong> 2880<br />
State<br />
Clean Water Act,<br />
Section 401,<br />
33 U.S.C. § 1344;<br />
18 Alaska Administrative<br />
Code (AAC) 15<br />
National Historic<br />
Preservation Act,<br />
Section 106,<br />
16 U.S.C. § 470 et seq. <strong>and</strong><br />
Alaska Historic<br />
Preservation Act, Alaska<br />
Statutes<br />
(AS) § 41.35.010-240<br />
NOAA Fisheries<br />
USFWS<br />
NOAA Fisheries,<br />
USFWS, FHWA<br />
USEPA<br />
FHWA<br />
BLM<br />
Alaska<br />
Department of<br />
<strong>Environment</strong>al<br />
Conservation<br />
(ADEC)<br />
Alaska<br />
Department of<br />
Natural<br />
Resources<br />
(ADNR) Office of<br />
History <strong>and</strong><br />
Archaeology;<br />
State Historic<br />
Preservation<br />
Officer (SHPO)<br />
Establishes national st<strong>and</strong>ards for<br />
fisheries conservation <strong>and</strong><br />
management. Federal agencies must<br />
consult with NOAA Fisheries <strong>and</strong><br />
assess the effects of their actions on<br />
essential fish habitat (EFH).<br />
Necessary conservation measures<br />
may be identified by NOAA.<br />
Prohibits taking of migratory birds<br />
unless specifically exempted or<br />
authorized. Taking can include loss<br />
of habitat<br />
Requires federal agencies to consult<br />
with wildlife agencies on project<br />
effects to fish <strong>and</strong> wildlife<br />
USEPA regulates airborne pollutants<br />
from project construction activities<br />
<strong>and</strong> project operation.<br />
Requires agencies that must use<br />
private property to acquire it at fair<br />
market value <strong>and</strong> assist in any<br />
necessary relocation of residences or<br />
businesses.<br />
BLM may own portions of the bluff<br />
where the POA borders Elmendorf.<br />
These locations may require BLM<br />
ROWs.<br />
State authority to grant, deny, or<br />
condition certification of CWA<br />
Section 404 permits; Rivers <strong>and</strong><br />
Harbors Act Sections 9<br />
<strong>and</strong> 10 permits; a state-issued<br />
401 Certificate of Reasonable<br />
Assurance must accompany the<br />
Sections 10 <strong>and</strong> 404 permit.<br />
Section 106 requires review of<br />
federal projects by SHPO <strong>and</strong> the<br />
Advisory Council on Historic<br />
Preservation. The Alaska Historic<br />
Preservation Act contains a similar<br />
provision m<strong>and</strong>ating that any project<br />
with State involvement be reviewed<br />
in a related manner.<br />
EIS sections <strong>and</strong><br />
appendixes<br />
Sections 3.8.8.2,<br />
4.8.8.2, <strong>and</strong><br />
4.9.4.8.8<br />
Sections 3.8.8.3<br />
<strong>and</strong> 4.8.8.3<br />
Sections 3.8.8.2,<br />
4.8.8.2, <strong>and</strong><br />
4.9.4.8.8<br />
Sections 3.5.1<br />
<strong>and</strong> 4.5.1<br />
Section 3.2.7<br />
Section 3.1.1<br />
Sections 3.8.1<br />
<strong>and</strong> 4.8.1<br />
Sections 3.6.1, 4.6.1<br />
<strong>and</strong> 4.9.4.6.1<br />
(continued on next page)<br />
3-224 12/18/07
<strong>Knik</strong> <strong>Arm</strong> Crossing DraftFinal EIS<br />
<strong>Affected</strong> <strong>Environment</strong><br />
Table 3-33. Applicable federal, state, <strong>and</strong> local legislation (continued)<br />
Relevant legislation Agency Description<br />
State<br />
Alaska Fishway Act,<br />
AS § 41.14.840 <strong>and</strong><br />
Anadromous Fish Act<br />
AS § 41.14.870<br />
Coastal Zone<br />
Management<br />
Act (CZMA)<br />
16 U.S.C. § 1451 et<br />
seq.; Alaska Coastal<br />
Zone Management Act,<br />
AS § 46.40, AS § 44.19,<br />
11 AAC 110,112, 114; 6<br />
AAC 80.900(until federal<br />
approval of new<br />
statewide st<strong>and</strong>ards 11<br />
AAC 112.200-990).<br />
Tidel<strong>and</strong> Easement,<br />
Best Interest Finding,<br />
AS § 38.05.850;<br />
Submerged L<strong>and</strong> Act<br />
<strong>and</strong> Public Law 31<br />
Permit to Cross Alaska<br />
Railroad Corporation<br />
(ARRC)-Owned L<strong>and</strong><br />
<strong>and</strong> ARRC Road<br />
Crossing Permit;<br />
AS § 42.40.285 (d)<br />
Noxious Weeds<br />
Management 11 AAC 34<br />
Municipality of Anchorage<br />
Right-of-way, Anchorage<br />
Municipal Code<br />
(AMC) 21.67; Flood<br />
Hazard Permit,<br />
AMC 21.60<br />
ADNR Office of<br />
Habitat<br />
Management <strong>and</strong><br />
Permitting<br />
(OHMP)<br />
ADNR Office of<br />
Project<br />
Management <strong>and</strong><br />
Permitting<br />
(OPMP),<br />
Municipality of<br />
Anchorage,<br />
Matanuska-<br />
Susitna Borough<br />
ADNR Division of<br />
Mining, L<strong>and</strong> <strong>and</strong><br />
Water (MLW)<br />
ARRC<br />
(Independent,<br />
public corporation<br />
<strong>and</strong> instrument of<br />
the State within<br />
the Department of<br />
Commerce,<br />
Community <strong>and</strong><br />
Economic<br />
Development)<br />
ADNR Division of<br />
Agriculture<br />
Municipality of<br />
Anchorage<br />
Project must notify <strong>and</strong> obtain<br />
authorization <strong>and</strong> approval for all<br />
activities within or across streams used<br />
by resident fish <strong>and</strong>/or anadromous fish.<br />
Federal consistency with the CZMA<br />
requires that federal actions that are<br />
likely to affect any l<strong>and</strong> or water in the<br />
coastal zone must be consistent with<br />
the State’s coastal management<br />
program, as approved by the Office of<br />
Coastal Resource Management<br />
(OCRM), NOAA. The State requires<br />
addressing effects on coastal uses or<br />
resources that are the result of federal<br />
actions. Permissible l<strong>and</strong> <strong>and</strong> water<br />
uses within the coastal zone are<br />
identified in the statewide st<strong>and</strong>ards of<br />
the Alaska Coastal Management<br />
Program (ACMP) <strong>and</strong> the approved<br />
district coastal management plans.<br />
OPMP issues a Coastal Consistency<br />
Determination to certify compliance with<br />
these st<strong>and</strong>ards.<br />
Tidel<strong>and</strong> easement authorizes use of<br />
State l<strong>and</strong> for commercial <strong>and</strong><br />
noncommercial purposes.<br />
Permits to cross ARRC-owned l<strong>and</strong>,<br />
including Government Hill Greenbelt,<br />
Harvard Park; permit to place viaduct<br />
piers within the ARRC rail yard.<br />
To prevent the importation <strong>and</strong> spread<br />
of pests, diseases, or toxic substances<br />
that are injurious to the public interest,<br />
<strong>and</strong> for protection of the agriculture<br />
industry.<br />
A right-of-way permit is required for<br />
filling <strong>and</strong> grading in a Municipality of<br />
Anchorage-platted right-of-way or public<br />
easement. A flood hazard permit is<br />
necessary for construction within a<br />
regulated floodway.<br />
EIS sections <strong>and</strong><br />
appendixes<br />
Sections 3.8.8.2 <strong>and</strong><br />
4.8.8.2<br />
Sections 3.8.6, 4.8.6<br />
<strong>and</strong> 4.9.4.8.6<br />
Sections 3.8.8.2 <strong>and</strong><br />
4.8.8.2<br />
Sections 3.7 <strong>and</strong> 4.7<br />
Section 3.8.7.3.1<br />
Sections 3.1.1, 3.1.2,<br />
3.2.3, 3.8.1.4, 4.1.1,<br />
4.2.3 <strong>and</strong> 4.8.1.4<br />
(continued on next page)<br />
12/18/07 3-225
<strong>Knik</strong> <strong>Arm</strong> Crossing DraftFinal EIS<br />
<strong>Affected</strong> <strong>Environment</strong><br />
Table 3-33. Applicable federal, state, <strong>and</strong> local legislation (continued)<br />
Relevant legislation<br />
Agency<br />
Matanuska-Susitna Borough<br />
Port MacKenzie District Mat-Su Borough<br />
Use Permit, Mat-Su<br />
Borough Chapter 17.23;<br />
Construction within a<br />
Public Easement or<br />
Right-of-way,<br />
AS § 35.30, Mat-Su<br />
Borough Chapter 17.61;<br />
Acknowledgement of<br />
Existing L<strong>and</strong> Use<br />
Regulations, Mat-Su<br />
Borough Chapter 17.01<br />
Description<br />
Public easement <strong>and</strong> rights-of-way<br />
permits are required for construction.<br />
For projects occurring within the Port<br />
MacKenzie District, a use permit is<br />
required, <strong>and</strong> the voluntary<br />
Acknowledgement of Existing L<strong>and</strong> Use<br />
regulations will be completed at the<br />
request of the Borough.<br />
EIS sections <strong>and</strong><br />
appendixes<br />
Sections 3.1.1, 3.1.2,<br />
3.2.3, 4.1.1,<br />
4.1.2 <strong>and</strong> 4.2.3<br />
3-226 12/18/07
<strong>Knik</strong> <strong>Arm</strong> Crossing DraftFinal EIS<br />
<strong>Affected</strong> <strong>Environment</strong><br />
Table 3-34. Executive Orders pertaining to NEPA<br />
Number Title Description EIS section<br />
EO 11988 Floodplain Management To avoid to the extent possible long<strong>and</strong><br />
short-term adverse impacts<br />
associated with the occupancy <strong>and</strong><br />
modification of floodplains <strong>and</strong> to avoid<br />
direct or indirect support of floodplain<br />
development wherever practicable<br />
alternatives exist<br />
EO 11990 Protection of Wetl<strong>and</strong>s To minimize the destruction, loss, or<br />
degradation of wetl<strong>and</strong>s, <strong>and</strong> to<br />
preserve <strong>and</strong> enhance the natural <strong>and</strong><br />
beneficial values of wetl<strong>and</strong>s<br />
EO 12898<br />
EO 13175<br />
EO 13186<br />
Federal Actions to Address<br />
<strong>Environment</strong>al Justice in<br />
Minority Populations <strong>and</strong> Low-<br />
Income Populations<br />
Consultation <strong>and</strong> Coordination<br />
with Indian Tribal Governments<br />
Responsibilities of Federal<br />
Agencies to Protect Migratory<br />
Birds<br />
Designed to focus federal attention on<br />
environmental <strong>and</strong> human health<br />
conditions in minority <strong>and</strong> low-income<br />
communities for environmental justice.<br />
Promotes nondiscrimination in federal<br />
programs substantially affecting human<br />
health <strong>and</strong> environment; provides<br />
access to public information <strong>and</strong><br />
opportunity for public participation in<br />
matters relating to human health <strong>and</strong><br />
the environment<br />
To establish regular <strong>and</strong> meaningful<br />
consultation <strong>and</strong> collaboration with<br />
tribal officials in the development of<br />
federal policies that have tribal<br />
implications, to strengthen the<br />
U.S. government-to-government<br />
relationships, <strong>and</strong> to reduce the<br />
imposition of unfunded m<strong>and</strong>ates<br />
Directs executive departments <strong>and</strong><br />
agencies to take certain actions that<br />
shall promote the conservation of<br />
migratory bird populations<br />
EO 13112 Invasive Species This EO directs federal agencies to<br />
address their actions that are likely to<br />
influence the presence of invasive<br />
species. Agencies are further directed<br />
to develop programs <strong>and</strong> authorities to<br />
prevent the introduction of invasive<br />
species, monitor populations, <strong>and</strong><br />
provide for restoration of native species<br />
<strong>and</strong> habitats that have been invaded.<br />
EO 13166<br />
Improving Access to Services<br />
for Persons with Limited<br />
English Proficiency<br />
This EO directs that individuals who<br />
are not proficient in the English<br />
language be provided meaningful<br />
access to federal processes.<br />
Sections 3.8.3, 4.8.3<br />
<strong>and</strong> 4.9.4.8.3<br />
Sections 3.8.2,<br />
4.8.2, <strong>and</strong> 4.9.4.8.2<br />
Sections 3.2.5<br />
<strong>and</strong> 4.2.5<br />
Sections 3.2.5, 4.2.5<br />
<strong>and</strong> 4.9.4.2,<br />
Sections 3.8.8.3<br />
<strong>and</strong> 4.8.8.3<br />
Sections 3.8.7.3.1<br />
<strong>and</strong> 4.8.7.3.2<br />
12/18/07 3-227