Presentation Q2 2012 - Dansk Kommunikationsforening
Presentation Q2 2012 - Dansk Kommunikationsforening
Presentation Q2 2012 - Dansk Kommunikationsforening

Create successful ePaper yourself
Turn your PDF publications into a flip-book with our unique Google optimized e-Paper software.
A.P. Møller – Mærsk<br />
Interim Report <strong>Q2</strong> <strong>2012</strong><br />
14 August <strong>2012</strong> - Conference call 9.30am CET Webcast available at www.maersk.com
| page 2<br />
Forward-looking<br />
Statements<br />
This presentation contains forward-looking<br />
statements. Such statements are subject to<br />
risks and uncertainties as various factors,<br />
many of which are beyond A.P. Møller -<br />
Mærsk A/S‟ control, may cause actual<br />
development and results to differ materially<br />
from the expectations contained in the<br />
presentation.<br />
Interim Report <strong>Q2</strong> <strong>2012</strong>
| page 3<br />
Executing on Group strategy<br />
• Profit was USD 965m and ROIC was 8.8%<br />
• Maersk Line turned profit making. Further rate<br />
increases on most trades were implemented<br />
supported by capacity reductions. HQ was<br />
reorganised and units costs reduced<br />
• Maersk Oil‟s profit was affected by an expected<br />
decline in production share. Maturing and<br />
development of the portfolio continued. Five<br />
exploration or appraisals wells were completed<br />
• APM Terminals profit unchanged with 7%<br />
increase in throughput. Further projects were<br />
initiated<br />
• Maersk Drilling had a stable result and major<br />
rig contracts were signed. A seventh rig was<br />
ordered<br />
• The divestment of the FPSO Maersk Peregrino<br />
was completed in July<br />
Interim Report <strong>Q2</strong> <strong>2012</strong>
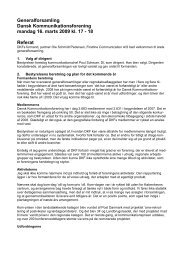
Group Financial Highlights <strong>Q2</strong> <strong>2012</strong><br />
| page 4<br />
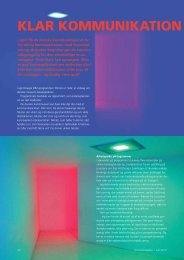
Group Financial Highlights<br />
USD million <strong>Q2</strong>-11 <strong>Q2</strong>-12<br />
2,000<br />
1,500<br />
1,000<br />
500<br />
-<br />
(500)<br />
1,570<br />
Profit by activity*<br />
Profit<br />
965<br />
174<br />
Free cash flow<br />
USD million <strong>Q2</strong>-11 <strong>Q2</strong>-12<br />
800<br />
700<br />
600<br />
500<br />
400<br />
300<br />
200<br />
100<br />
0<br />
-100<br />
-200<br />
-300<br />
-163<br />
234<br />
705<br />
470<br />
156 151<br />
99<br />
71<br />
-505<br />
285<br />
Maersk Line Maersk Oil APM Terminals Maersk Drilling All Other<br />
197<br />
Group Financial Highlights <strong>Q2</strong> <strong>2012</strong> (<strong>Q2</strong> 2011)<br />
• Profit was USD 965m for <strong>Q2</strong> (USD 1,570m)<br />
• Maersk Line‟s profit was USD 227m (loss of USD 95m)<br />
• Maersk Oil‟s profit was USD 468m (USD 694m)<br />
• ROIC for the Group was down to 8.8% from 14.0%<br />
• Cash flow from operating activities was USD 1.6bn<br />
(USD 1.8bn)<br />
• Cash flow used for capital expenditure (net of sales<br />
proceeds) was USD 2.1bn (USD 1.6bn)<br />
• Net interest bearing debt was USD 16.6bn (USD<br />
11.7bn)<br />
• The Group revises its expected result for <strong>2012</strong> upwards<br />
from slightly lower to slightly above the result for 2011<br />
(USD 3.4bn)<br />
*Excluding after tax divestment gains, impairments and other special items<br />
Interim Report <strong>Q2</strong> <strong>2012</strong>
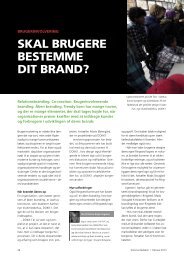
Maersk Line<br />
(USD million)<br />
<strong>Q2</strong><br />
<strong>2012</strong><br />
Q1<br />
<strong>2012</strong><br />
<strong>Q2</strong><br />
2011<br />
FY<br />
2011<br />
Revenue 7,322 6,312 6,276 25,108<br />
EBITDA 694 -162 261 1,009<br />
Sales gains 6 1 68 127<br />
Profit (NOPAT) 227 -599 -95 -553<br />
Operating cash flow 175 -257 319 899<br />
Volume (FFE million) 2.2 2.2 2.0 8.1<br />
Rate (USD/FFE) 3,014 2,646 2,892 2,828<br />
Bunkers (USD/tonne) 696 685 631 620<br />
ROIC (%) 4.6 -12.7 -2.2 -3.1<br />
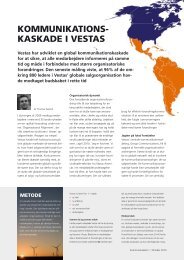
Development in rate<br />
Highlights <strong>Q2</strong> <strong>2012</strong><br />
• Volumes increased 11% Y/Y to 2.2m FFE supported by an<br />
increase on Europe to Asia and intra Asian volume<br />
• Rates increased 4% primary on the Asia - Europe trade and<br />
earnings per unit were 118 USD/FFE ( negative 59 USD/FFE)<br />
• Unit costs excluding increase in fuel price declined 1% due to<br />
reduction in bunkers consumption per transported FFE and<br />
higher utilisation<br />
• Restructuring of HQ to strengthen Maersk Line‟s focus on<br />
customers. Headcount reduced with 400 employees and USD<br />
17m charge recognised<br />
• Capacity reduced through slow-steaming, vessel sharing<br />
agreements and other measures<br />
Development in volume<br />
| page 5<br />
USD/FFE<br />
3,400<br />
3,200<br />
3,000<br />
2,800<br />
2,600<br />
2,400<br />
2,200<br />
2,000<br />
Jan Apr Jul Oct<br />
2010 2011 <strong>2012</strong><br />
FFE million<br />
2.4<br />
2.2<br />
2.0<br />
1.8<br />
1.6<br />
1.4<br />
1.2<br />
1.0<br />
Q1 <strong>Q2</strong> Q3 Q4<br />
2010 2011 <strong>2012</strong><br />
Interim Report <strong>Q2</strong> <strong>2012</strong>
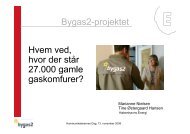
Maersk Oil<br />
| page 6<br />
(USD million)<br />
<strong>Q2</strong><br />
<strong>2012</strong><br />
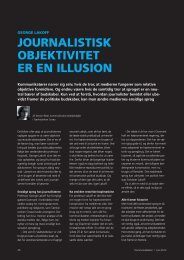
Maersk Oil’s share of production<br />
Q1<br />
<strong>2012</strong><br />
<strong>Q2</strong><br />
2011<br />
FY<br />
2011<br />
Revenue 2,724 2,538 3,510 12,616<br />
Exploration costs 199 299 214 990<br />
EBITDA 2,036 1,853 2,886 10,015<br />
Profit (NOPAT) 468 1,293 694 2,112<br />
Operating cash flow 1,045 1,135 1,502 4,319<br />
Share of prod. (boepd) 287,000 254,000 346,000 333,000<br />
Brent (USD per barrel) 108 119 117 111<br />
ROIC (%) 26.4 76.5 66.8 37.2<br />
'000 boepd <strong>Q2</strong> 2011 <strong>Q2</strong> <strong>2012</strong><br />
180<br />
160<br />
140<br />
120<br />
100<br />
80<br />
60<br />
40<br />
20<br />
0<br />
159<br />
125<br />
114 111<br />
31<br />
26 27 28<br />
6<br />
0 4 3<br />
Qatar DK UK Algeria Brazil Kazakhstan<br />
Highlights <strong>Q2</strong> <strong>2012</strong><br />
• Profit was negatively influenced by a 17% reduction in share<br />
of production Y/Y driven by lower share from Qatar as well<br />
as maturing fields in Denmark and the UK<br />
• As expected and in line with the cost recovery mechanism<br />
the share of production in Qatar dropped 28% to 114,000<br />
boepd (159,000 boepd). It is estimated to stay around the<br />
100,000 boepd level for the remainder of the year<br />
• Maersk Oil started receiving entitlement oil from the<br />
settlement of an Algerian tax dispute. The settlement barrels<br />
related to previous years' production come on top of the<br />
production share that was 28,000 boepd in <strong>Q2</strong> (27,000<br />
boepd)<br />
• Exploration costs were lower at USD 199m (USD<br />
214m), covering activities in Angola, Brazil, Iraq, Kazakhstan<br />
and the UK<br />
• Five exploration/appraisal wells were completed compared<br />
to one in <strong>Q2</strong> 2011<br />
• Maersk Oil entered into an agreement to acquire a 30%<br />
interest in the Dumbarton and Lochranza<br />
fields, UK, expected completion of transaction in H2 <strong>2012</strong><br />
• The “Danish North Sea Fund” entered as partner with a 20%<br />
interest in DUC in July. Effect on Maersk Oil profit is neutral<br />
Interim Report <strong>Q2</strong> <strong>2012</strong>
APM Terminals<br />
| page 7<br />
(USD million)<br />
<strong>Q2</strong><br />
<strong>2012</strong><br />
Q1<br />
<strong>2012</strong><br />
<strong>Q2</strong><br />
2011<br />
FY<br />
2011<br />
Revenue 1,189 1,205 1,151 4,682<br />
EBITDA 299 274 265 1,059<br />
Profit (NOPAT) 160 235 162 648<br />
Operating cash flow 276 199 178 912<br />
Throughput (TEU m) 9.1 8.6 8.4 33.5<br />
ROIC (%) 12.5 18.1 12.9 13.1<br />
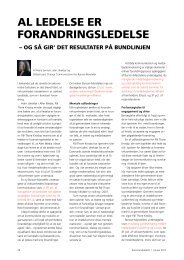
Volume growth and margin development<br />
30%<br />
25%<br />
20%<br />
15%<br />
10%<br />
5%<br />
0%<br />
-5%<br />
-10%<br />
2005 2006 2007 2008 2009 2010 2011 H1 <strong>2012</strong><br />
Highlights <strong>Q2</strong> <strong>2012</strong><br />
• Result was supported by a gross throughput<br />
increase of 7% driven by West Africa and some<br />
terminals in Asia, while volumes declined in<br />
most European terminals<br />
• Excluding impact of portfolio changes, volumes<br />
increased 5%<br />
• Portfolio initiatives:<br />
• Agreement to enlarge Meishan, China<br />
• Unsolicited proposal to operate all Port of<br />
Virginia facilities, USA<br />
• Commencement of Rotterdam‟s Maasvlakte II<br />
construction, The Netherlands<br />
• Concession signed for Port of Lazaro<br />
Cardenas, Mexico<br />
EBITDA-margin<br />
Throughput growth<br />
Interim Report <strong>Q2</strong> <strong>2012</strong>
Maersk Drilling<br />
| page 8<br />
(USD million)<br />
Days<br />
1,600<br />
1,500<br />
1,400<br />
1,300<br />
1,200<br />
<strong>Q2</strong><br />
<strong>2012</strong><br />
Q1<br />
<strong>2012</strong><br />
<strong>Q2</strong><br />
2011<br />
FY<br />
2011<br />
Revenue 465 488 451 1,878<br />
EBITDA 162 221 183 862<br />
Profit (NOPAT) 101 125 99 488<br />
Operating cash flow 231 125 182 825<br />
Fleet (units) 26 26 26 26<br />
Contracted days* 1,372 1,402 1,460 5,752<br />
ROIC (%) 9.6 12.2 10.3 12.5<br />
Contracted days and coverage<br />
Pct<br />
100<br />
95<br />
90<br />
85<br />
80<br />
Highlights <strong>Q2</strong> <strong>2012</strong><br />
• The result was affected by a reversed<br />
impairment of USD 30m and delayed yard stay<br />
on two rigs requiring maintenance and upgrade<br />
• Contract coverage on available rig days is 94%<br />
for the remainder of <strong>2012</strong> and 86% for 2013<br />
• A new ultra harsh jack-up rig was ordered from<br />
the yard and four of the seven units on order<br />
have contract coverage on delivery<br />
• Three major contracts signed during <strong>Q2</strong>:<br />
• A USD 620m contract for a new build ultra harsh jackup<br />
rig for operation in Norway<br />
• A USD 610m contract for an ultra deepwater drillship<br />
currently under construction<br />
• A USD 280m contract for an existing ultra harsh jackup<br />
rig<br />
1,100<br />
1,000<br />
Q1 2010 Q1 2011 Q1 <strong>2012</strong><br />
Contracted days (LHS)<br />
coverage (RHS)<br />
75<br />
70<br />
*based on 16 rigs, excl. Egyptian Drilling Company<br />
Interim Report <strong>Q2</strong> <strong>2012</strong>
Other business units and investments<br />
| page 9<br />
Profit from other business units was USD 259m in total.<br />
Profit by activity*<br />
USD million <strong>Q2</strong>-<strong>2012</strong> <strong>Q2</strong>-2011<br />
Maersk Supply Service<br />
• Low activity primary in North Sea but high activity levels in<br />
main operation areas as Brazil and Africa<br />
Other<br />
68<br />
83<br />
• Contract coverage is 67% for the remainder of <strong>2012</strong> and 48%<br />
for 2013, excl. options<br />
Maersk FPSO & LNG<br />
32<br />
30<br />
Maersk Tankers<br />
• Persistent excess tonnage supply<br />
<strong>Dansk</strong> Supermarked<br />
60<br />
93<br />
• Gas performing better than crude and refined oil product<br />
transportation<br />
Damco<br />
Svitzer<br />
23<br />
32<br />
• Gain on sale of a logistic facility in China but costs<br />
associated with restructuring in Europe<br />
Damco<br />
15<br />
12<br />
• Ocean volume growth of 11%, air freight tonnage growth of<br />
135% including acquisition of NTS, Supply Chain<br />
Management volume was 6% higher<br />
-25<br />
Maersk Tankers<br />
-14<br />
52<br />
Maersk Supply Service<br />
32<br />
-50 0 50 100<br />
*Excluding gains, impairments and other special items<br />
Svitzer<br />
• Positively affected by Harbour Towage tariff increases and<br />
start-up of new Terminal Towage operations<br />
<strong>Dansk</strong> Supermarked<br />
• Reduced margins in non-food sector and increased<br />
depreciation<br />
• 1.5% increase in turnover primary driven by foreign markets.<br />
Opening of nine new Netto stores<br />
Interim Report <strong>Q2</strong> <strong>2012</strong>
Consolidated Financial Information<br />
| page 10<br />
Income statement (USD million) <strong>Q2</strong> <strong>2012</strong> <strong>Q2</strong> 2011 Q1 <strong>2012</strong> H1 <strong>2012</strong> H1 2011 FY 2011<br />
Revenue 15,348 15,439 14,316 29,664 29,927 60,230<br />
EBITDA 3,582 4,083 2,541 6,123 8,205 14,661<br />
Depreciation, etc. 1,288 1,419 1,255 2,543 2,645 5,396<br />
Gain on sale of non-current assets,<br />
net<br />
50 787 324 374 847 890<br />
EBIT 2,407 3,509 1,661 4,068 6,504 10,277<br />
Profit before tax 2,170 3,350 1,495 3,665 6,103 9,422<br />
Profit for the period 965 1,570 1,175 2,140 2,733 3,377<br />
Key figures (USD million) <strong>Q2</strong> <strong>2012</strong> <strong>Q2</strong> 2011 Q1 <strong>2012</strong> H1 <strong>2012</strong> H1 2011 FY 2011<br />
Cash Flow from operating activities 1,596 1,817 1,159 2,755 4,073 7,262<br />
Capex net of sales proceeds -2,101 -1,643 -875 -2,976 -2,877 -9,759<br />
Net interest-bearing debt (billion) 16.6 11.7 15.5 16.6 11.7 15.3<br />
Earnings per share (USD) 208 288 248 456 543 650<br />
ROIC (%) 8.8 14.0 10.0% 9.5% 12.8% 8.3%<br />
Dividend per share (DKK) - - 1,000 1,000 1,000<br />
Interim Report <strong>Q2</strong> <strong>2012</strong>
Development in Net Interest-bearing Debt<br />
| page 11<br />
USD billion<br />
• No immediate refinancing need<br />
Interim Report <strong>Q2</strong> <strong>2012</strong>
Outlook for <strong>2012</strong><br />
| page 12<br />
• The Group revises its expected result for <strong>2012</strong> upwards from<br />
slightly lower to slightly above the result for 2011 (USD 3.4bn).<br />
Cash flow used for capital expenditure is expected to be lower<br />
than in 2011 (USD 9.8bn) while cash flow from operating activities<br />
is expected to be at the same level as 2011 (USD 7.3bn)<br />
Sensitivities for the remainder of <strong>2012</strong><br />
• Maersk Line now expects a modest positive result in <strong>2012</strong> based<br />
on higher average rates in the second half of the year. Global<br />
demand for seaborne containers is expected to increase by 4% in<br />
<strong>2012</strong>, but with declining inbound European volumes<br />
• Maersk Oil expects a result for <strong>2012</strong> at the same level as the<br />
result for 2011 (USD 2.1bn) including the impact from the<br />
settlement of a tax dispute in Algeria. The expected result is based<br />
on a share of production of 265,000 boepd during <strong>2012</strong> and an<br />
average oil price of USD 108 per barrel for the remainder of the<br />
year. Exploration costs are expected to be above USD 1.0bn<br />
• APM Terminals expects a result for <strong>2012</strong> above the result for<br />
2011 (USD 648m) and above market growth in volumes supported<br />
by portfolio expansion<br />
• Maersk Drilling now expects a result for <strong>2012</strong> below the result for<br />
2011 (USD 488m) due to postponed start-up on new contracts<br />
• The total result from all other activities is now expected to be lower<br />
than 2011 excluding divestment gains and impairments, primarily<br />
due to lower expected result in <strong>Dansk</strong> Supermarked and Maersk<br />
Supply Service<br />
• The outlook for <strong>2012</strong> is subject to considerable uncertainty, not<br />
least due to developments in the global economy<br />
Interim Report <strong>Q2</strong> <strong>2012</strong>
Final remarks<br />
| page 13<br />
• The Group continues to prioritise investments in the four core growth<br />
businesses<br />
• Maersk Line will grow with the market and aims to achieve an EBITmargin<br />
5%-points above peers. The Group sees limited need for<br />
further contracting of new tonnage in the years to come<br />
• Maersk Oil’s aspiration to reach a share of production at 400,000<br />
boepd implies significant investments in the coming years on top of<br />
the field development plans that have already been sanctioned. Two<br />
main new fields are Chissonga in Angola and Johan Sverdrup in<br />
Norway with an expected combined production share around 100,000<br />
boepd and both with first oil expected in 2018. Maersk Oil‟s return on<br />
invested capital will decline, but is expected to stay double-digit<br />
during the expansion phase<br />
• APM Terminals is expanding and optimising the portfolio of<br />
terminals. APM Terminals ambition is to deliver USD 1bn to the<br />
Group‟s profit within a few years<br />
• Maersk Drilling has seven large units on order and is executing on<br />
the ambition of becoming a leading drilling contractor within deep<br />
water and ultra harsh environments. Maersk Drillings financial<br />
ambition is to deliver USD 1.0bn to the Group‟s profit medium term<br />
• The Group is committed to profitable growth and to increase the<br />
dividend per share and over the cycle comply with the financial ratios<br />
corresponding to a strong investment grade company<br />
• Save the date: Capital Markets Day 9 October <strong>2012</strong><br />
Interim Report <strong>Q2</strong> <strong>2012</strong>
| page 14<br />
Q & A - To ask a question please press 01<br />
Interim Report <strong>Q2</strong> <strong>2012</strong>
Group Financial Highlights H1 <strong>2012</strong><br />
| page 15<br />
Group Financial Highlights<br />
USD million H1-11 H1-12<br />
3,000<br />
2,500<br />
2,000<br />
1,500<br />
1,000<br />
500<br />
-<br />
(500)<br />
2,733<br />
Profit by activity*<br />
Profit<br />
2,140<br />
1,196<br />
(221)<br />
Free cash flow<br />
USD million H1-11 H1-12<br />
Group Financial Highlights H1 <strong>2012</strong> (H1 2011)<br />
• Profit for the Group was USD 2,140m for H1 (USD<br />
2,733m)<br />
• Maersk Line‟s loss was USD 372m for H1 (Profit of<br />
USD 329m)<br />
• Maersk Oil report a profit of USD 1,761m for H1 (USD<br />
1,231m)<br />
• APM Terminals report a profit of USD 395m for H1<br />
(USD 303m)<br />
• Maersk Drilling report a profit of USD 226m for H1<br />
(USD 221m)<br />
1400<br />
1200<br />
1000<br />
800<br />
600<br />
400<br />
200<br />
0<br />
-200<br />
-400<br />
-600<br />
1241<br />
769<br />
435<br />
295 313<br />
211<br />
221 196<br />
356<br />
-362<br />
Maersk Line Maersk Oil APM Terminals Maersk Drilling All Other<br />
• ROIC for the Group was 9.5% (12.8%)<br />
• Cash flow from operating activities was USD 2.8bn<br />
versus USD 4.1bn<br />
• Cash flow used for capital expenditure (net of sales<br />
proceeds) was negative USD 3.0bn (USD -2.9bn)<br />
• Net interest-bearing debt was USD 16.6bn (USD<br />
11.7bn)<br />
• Outlook for <strong>2012</strong> is revised upwards<br />
*Excluding after tax divestment gains, impairments and other special items<br />
Interim Report <strong>Q2</strong> <strong>2012</strong>
Consolidated Financial Information<br />
| page 16<br />
Income statement (DKK million) <strong>Q2</strong> <strong>2012</strong> <strong>Q2</strong> 2011 Q1 <strong>2012</strong> H1 <strong>2012</strong> H1 2011 FY 2011<br />
Revenue 88,818 80,117 81,250 170,068 159,229 322,520<br />
EBITDA 20,683 21,149 14,422 35,105 43,654 78,506<br />
Depreciation, etc. 7,453 7,377 7,124 14,577 14,069 28,889<br />
Gain on sale of non-current assets, etc.<br />
net<br />
302 4,177 1,841 2,143 4,507 4,764<br />
EBIT 13,893 18,251 9,429 23,322 34,607 55,032<br />
Profit before tax 12,530 17,435 8,485 21,015 32,469 50,452<br />
Profit for the period 5,599 8,191 6,668 12,267 14,544 18,083<br />
Key figures (DKK million) <strong>Q2</strong> <strong>2012</strong> <strong>Q2</strong> 2011 Q1 <strong>2012</strong> H1 <strong>2012</strong> H1 2011 FY 2011<br />
Cash flow from operating activities 9,216 9,351 6,580 15,796 21,672 38,886<br />
Cash flow used for capital expenditure -12,094 -8,565 -4,965 -17,059 -15,306 -52,259<br />
Net interest-bearing debt (billion) 98.0 60.4 86.4 98.0 60.4 88.0<br />
Earnings per share (DKK) 1,206 1,497 1,409 2,615 2,889 3,479<br />
ROIC (%) 8.9 14.0 10.1 9.3 12.7 7.8<br />
Dividend per share - - - 1,000 1,000 1,000<br />
Interim Report <strong>Q2</strong> <strong>2012</strong>
Maersk Oil Exploration and Development<br />
| page 17<br />
Maersk Oil’s pipeline of major field developments<br />
Field (Country)<br />
Planned<br />
production start<br />
Equity share<br />
Share of<br />
production<br />
Dunga<br />
(Kazakhstan)<br />
<strong>2012</strong> 60% 15,000 boepd<br />
El Merk (Algeria) <strong>2012</strong> ~11% 15,000 boepd<br />
Golden Eagle (UK) 2014 32% 20,000 boepd<br />
Jack (US) 2014 25% 8,000 boepd<br />
Discoveries under evaluation<br />
Angola Brazil Denmark Norway UK US<br />
Chissonga 1 Itaipu 1 Luke/Elly Johan<br />
Sverdrup 1 Cawdor Buckskin 1<br />
Azul Wahoo 1 Flyndre Courageous<br />
Carambola Zidane Culzean 1<br />
1) Ongoing appraisal and exploration activities<br />
Jackdaw 1<br />
Maersk Oil aims to stabilise production by 2014 and thereafter gradually grow to<br />
reach a production level at 400,000 boepd.<br />
Interim Report <strong>Q2</strong> <strong>2012</strong>
Maersk Oil‟s Share of Production and Exploration Costs<br />
| page 18<br />
Maersk Oil’s share of production<br />
„000 boepd<br />
500<br />
450<br />
400<br />
350<br />
300<br />
250<br />
200<br />
150<br />
100<br />
50<br />
0<br />
2001 2002 2003 2004 2005 2006 2007 2008 2009 2010 2011 <strong>2012</strong>e<br />
DK UK Qatar Algeria Other<br />
Maersk Oil’s exploration costs* (USDm)<br />
990<br />
>USD 1bn<br />
831<br />
676<br />
605<br />
404<br />
229<br />
2006 2007 2008 2009 2010 2011 <strong>2012</strong>e<br />
*All exploration costs are expensed directly unless the project<br />
has been declared commercial<br />
Interim Report <strong>Q2</strong> <strong>2012</strong>