Annual Report - KonÄar Distribution and Special Transformers Inc.
Annual Report - KonÄar Distribution and Special Transformers Inc.
Annual Report - KonÄar Distribution and Special Transformers Inc.

You also want an ePaper? Increase the reach of your titles
YUMPU automatically turns print PDFs into web optimized ePapers that Google loves.
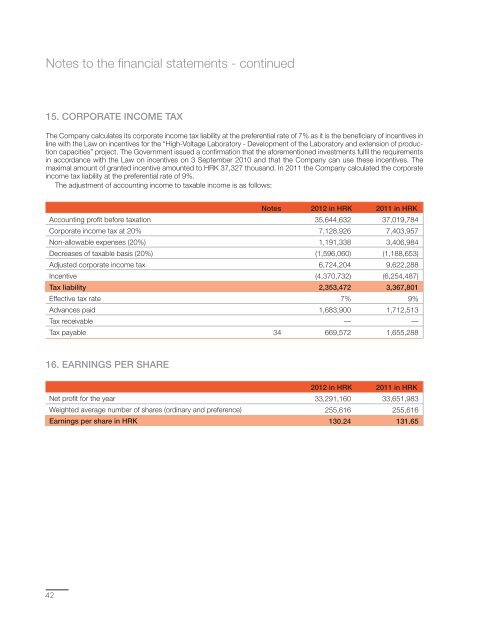
Notes to the financial statements - continued<br />
15. CORPORATE INCOME TAX<br />
The Company calculates its corporate income tax liability at the preferential rate of 7% as it is the beneficiary of incentives in<br />
line with the Law on incentives for the “High-Voltage Laboratory - Development of the Laboratory <strong>and</strong> extension of production<br />
capacities” project. The Government issued a confirmation that the aforementioned investments fulfil the requirements<br />
in accordance with the Law on incentives on 3 September 2010 <strong>and</strong> that the Company can use these incentives. The<br />
maximal amount of granted incentive amounted to HRK 37,327 thous<strong>and</strong>. In 2011 the Company calculated the corporate<br />
income tax liability at the preferential rate of 9%.<br />
The adjustment of accounting income to taxable income is as follows:<br />
Accounting profit before taxation<br />
Corporate income tax at 20%<br />
Non-allowable expenses (20%)<br />
Decreases of taxable basis (20%)<br />
Adjusted corporate income tax<br />
<strong>Inc</strong>entive<br />
Tax liability<br />
Effective tax rate<br />
Advances paid<br />
Tax receivable<br />
Tax payable<br />
Notes 2012 in HRK 2011 in HRK<br />
35,644,632 37,019,784<br />
7,128,926 7,403,957<br />
1,191,338 3,406,984<br />
(1,596,060) (1,188,653)<br />
6,724,204 9,622,288<br />
(4,370,732) (6,254,487)<br />
2,353,472 3,367,801<br />
7% 9%<br />
1,683,900 1,712,513<br />
— —<br />
34 669,572 1,655,288<br />
16. EARNINGS PER SHARE<br />
Net profit for the year<br />
Weighted average number of shares (ordinary <strong>and</strong> preference)<br />
Earnings per share in HRK<br />
2012 in HRK 2011 in HRK<br />
33,291,160 33,651,983<br />
255,616 255,616<br />
130.24 131.65<br />
42