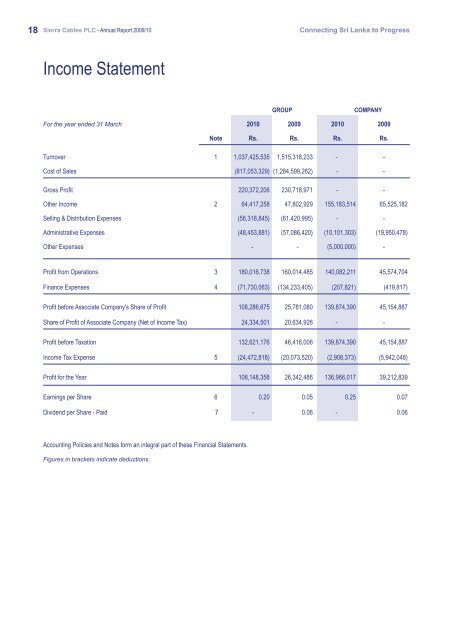
18 Sierra Cables PLC - <strong>Annual</strong> <strong>Report</strong> <strong>2009</strong>/<strong>10</strong> Connecting Sri Lanka to Progress Income Statement GROUP COMPANY For the year ended 31 March 20<strong>10</strong> <strong>2009</strong> 20<strong>10</strong> <strong>2009</strong> Note Rs. Rs. Rs. Rs. Turnover 1 1,037,425,535 1,515,318,233 - - Cost of Sales (817,053,329) (1,284,599,262) - - Gross Profit 220,372,206 230,718,971 - - Other Income 2 64,417,258 47,802,929 155,183,514 65,525,182 Selling & Distribution Expenses (56,318,845) (61,420,995) - - Administrative Expenses (48,453,881) (57,086,420) (<strong>10</strong>,<strong>10</strong>1,303) (19,950,478) Other Expenses - - (5,000,000) - Profit from Operations 3 180,016,738 160,014,485 140,082,211 45,574,704 Finance Expenses 4 (71,730,063) (134,233,405) (207,821) (419,817) Profit before Associate Company's Share of Profit <strong>10</strong>8,286,675 25,781,080 139,874,390 45,154,887 Share of Profit of Associate Company (Net of Income Tax) 24,334,501 20,634,926 - - Profit before Taxation 132,621,176 46,416,006 139,874,390 45,154,887 Income Tax Expense 5 (24,472,818) (20,073,520) (2,908,373) (5,942,048) Profit for the Year <strong>10</strong>8,148,358 26,342,486 136,966,017 39,212,839 Earnings per Share 6 0.20 0.05 0.25 0.07 Dividend per Share - Paid 7 - 0.06 - 0.06 Accounting Policies and Notes form an integral part of these Financial Statements. Figures in brackets indicate deductions.
Connecting Sri Lanka to Progress Sierra Cables PLC - <strong>Annual</strong> <strong>Report</strong> <strong>2009</strong>/<strong>10</strong> 19 Balance Sheet GROUP COMPANY As at 31 March 20<strong>10</strong> <strong>2009</strong> 20<strong>10</strong> <strong>2009</strong> Note Rs. Rs. Rs. Rs. Restated Restated ASSETS Non Current Assets Property, Plant & Equipment 8 494,452,431 485,387,038 18,220,555 18,917,230 Investment in Subsidiaries 9.1 - - 283,<strong>10</strong>7,311 288,<strong>10</strong>7,301 Investment in Associate 9.2 - 186,411,187 - 25,712,683 Other Long Term Investments 9.3 99,929,383 4,936,478 13,156,432 - Goodwill on Consolidation <strong>10</strong> 8,578,260 8,578,260 - - Deferred Tax Asset 16 4,513,223 3,703,323 4,192,140 3,277,517 Total Non Current Assets 607,473,297 689,016,285 318,676,438 336,014,731 Current Assets Inventories 11 477,668,382 305,561,444 - - Trade & Other Receivables 12 591,455,874 623,747,866 3,143,568 3,143,569 Related Party Receivables 13 <strong>10</strong>1,718,<strong>10</strong>2 98,631,249 5<strong>10</strong>,762,874 542,845,459 Current Tax Receivables 6,544,202 <strong>10</strong>,773,<strong>10</strong>7 - - Investment in Treasury Bill/ Deposits 9.4 285,282,977 163,953,644 279,055,870 99,134,328 Cash and Cash Equivalents 9,183,091 7,595,750 1,994,314 9,637 Total Current Assets 1,471,852,628 1,2<strong>10</strong>,263,060 794,956,626 645,132,993 Total Assets 2,079,325,925 1,899,279,345 1,113,633,064 981,147,724 EQUITY AND LIABILITIES Equity Stated Capital 14 894,565,898 894,565,898 894,565,898 894,565,898 Retained Earnings 488,984,280 380,835,922 194,996,703 58,030,686 Total Equity 1,383,550,178 1,275,401,820 1,089,562,601 952,596,584 Non Current Liabilities Retirement Benefit Obligations 15 9,724,153 9,044,068 - - Deferred Tax Liability 16 48,230,599 46,559,935 - - Long Term Loans 17 56,629,434 74,386,296 - - Long Term Lease Liability 18 12,805,828 5,787,875 - - Total Non Current Liabilities 127,390,014 135,778,174 - - Current Liabilities Creditors and Accruals 19 487,544,242 439,636,548 4,963,796 5,473,561 Current Portion of Long Term Loans 17 26,<strong>10</strong>4,930 16,406,999 - - Current Portion of Lease Liability 18 5,250,830 2,872,916 - - Short Term Loan - 5,203,017 - - Current Tax Liability 4,156,968 8,059,215 4,156,968 8,008,824 Related Party Payables 20 176,671 176,671 12,060,757 12,060,747 Bank Overdraft (Secured) 45,152,092 15,743,986 2,888,942 3,008,007 Total Current Liabilities 568,385,733 488,099,352 24,070,463 28,551,140 Total Equity & Liabilities 2,079,325,925 1,899,279,345 1,113,633,064 981,147,724 Accounting Policies and Notes form an integral part of these Financial Statements. I certify that the Financial Statements have been prepared in compliance with the requirements of the Companies Act No. 07 of 2007. L.Y. De Silva Chief Financial Officer The Board of Directors is responsible for the preparation and presentation of these Financial Statements. Approved and signed for and on behalf of the Board of Directors. Priyantha Perera Chairman 04 June 20<strong>10</strong> <strong>Colombo</strong> D. S. Panditha Director