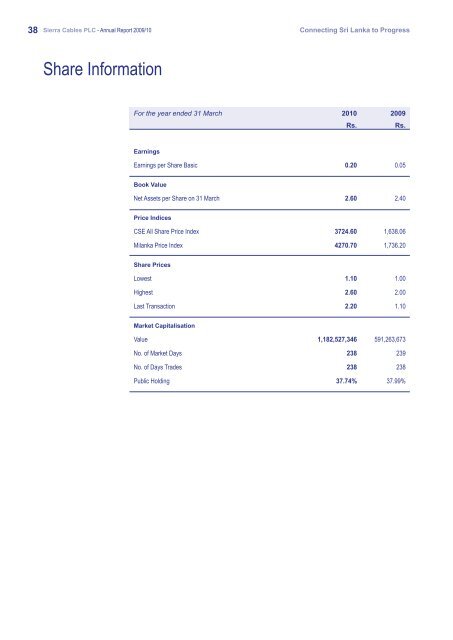
38 Sierra Cables PLC - <strong>Annual</strong> <strong>Report</strong> <strong>2009</strong>/<strong>10</strong> Connecting Sri Lanka to Progress Share Information For the year ended 31 March 20<strong>10</strong> <strong>2009</strong> Rs. Rs. Earnings Earnings per Share Basic 0.20 0.05 Book Value Net Assets per Share on 31 March 2.60 2.40 Price Indices CSE All Share Price Index 3724.60 1,638.06 Milanka Price Index 4270.70 1,736.20 Share Prices Lowest 1.<strong>10</strong> 1.00 Highest 2.60 2.00 Last Transaction 2.20 1.<strong>10</strong> Market Capitalisation Value 1,182,527,346 591,263,673 No. of Market Days 238 239 No. of Days Trades 238 238 Public Holding 37.74% 37.99%
Connecting Sri Lanka to Progress Sierra Cables PLC - <strong>Annual</strong> <strong>Report</strong> <strong>2009</strong>/<strong>10</strong> 39 Five Year Summary For the year ended 31 March 2006 2007 2008 <strong>2009</strong> 20<strong>10</strong> Rs. Rs. Rs. Rs. Rs. OPERATING RESULTS Revenue 1,038,076,867 1,395,462,767 1,489,325,624 1,515,318,233 1,037,425,535 Gross Profit 230,940,997 272,433,383 332,724,286 230,718,971 220,372,206 Profit from Operations 176,436 199,432,274 277,533,324 160,014,485 180,016,738 Profit Before Associate Company’s share of profit 139,337,547 151,152,240 174,694,115 25,781,080 <strong>10</strong>8,286,675 Profit After Tax <strong>10</strong>0,747,296 <strong>10</strong>1,695,199 129,237,627 26,342,486 <strong>10</strong>8,148,358 As at 31 March Assets Property, Plant & Equipment 363,130,752 427,095,874 433,763,317 485,387,038 494,452,431 Other Non-Current Assets 156,613,840 176,276,677 190,025,284 203,629,248 113,020,866 Current Assets 1,139,457,086 1,<strong>10</strong>5,979,883 1,2<strong>10</strong>,165,531 1,2<strong>10</strong>,263,060 1,471,852,628 Total Assets 1,659,201,678 1,709,352,434 1,833,954,132 1,899,279,346 2,079,325,925 Liabilities Long-Term Debt 77,027,087 43,326,142 21,564,397 80,174,171 69,435,262 Other Non-Current Liabilities 16,432,279 29,204,037 49,578,917 55,604,003 57,954,752 Short-Term Debt 22,842,754 19,987,553 35,317,723 15,743,986 45,152,092 Other Current Liabilities 465,272,684 470,516,694 451,937,460 472,355,366 523,233,642 Shareholders' Funds Stated Capital 894,565,898 894,565,898 894,565,898 894,565,898 894,565,898 Reserves 183,060,976 251,752,1<strong>10</strong> 380,989,737 380,835,922 488,984,280 Ratios Total Assets/Equity 1.54 1.49 1.44 1.49 1.50 Turnover/Assets 0.63 0.82 0.81 0.80 0.50 Net Margin (%) 9.70 7.30 8.70 1.70 <strong>10</strong>.40 Return on Equity (%) 12.90 13.20 13.70 2.00 7.80 Return on Assets (%) 8.40 8.84 9.53 1.36 5.21 Share Information Earning per Share (LKR) 0.19 0.19 0.24 0.05 0.20 Price Earnings Ratio <strong>10</strong>.67 <strong>10</strong>.57 7.49 22.45 <strong>10</strong>.93 Net Assets per Share 2.18 2.27 2.51 2.37 2.57