pdf file - Dottikon
pdf file - Dottikon
pdf file - Dottikon

Create successful ePaper yourself
Turn your PDF publications into a flip-book with our unique Google optimized e-Paper software.
11 Summary/Outlook DOTTIKON ES Group Annual Report 2011/12<br />
Dear Shareholder,<br />
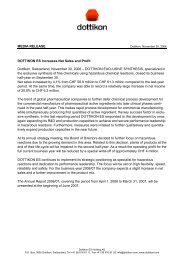
We are pleased to present the DOTTIKON ES Group's Annual Report for the business year from<br />
April 1, 2011, to March 31, 2012. Contrary to the original expectation, net sales and inventory of<br />
semi-finished and finished goods were increased slightly in the reporting period compared with<br />
the previous year, due to operating more successfully in a slightly improved market environment.<br />
In combination with the ongoing rigorous cost discipline, next to others the structural<br />
adaptation of personnel costs, the business year 2011/12 closed with a considerably lower net<br />
loss than in the previous year. Cash and cash equivalents and fixed deposits were kept at a high<br />
level due to considerably reduced investment activity. This was in spite of the significant<br />
decrease in operating cash flow that resulted from markedly lower inflow of trade receivables,<br />
based on the weak course of business in the previous period and increasing inventories due to<br />
the improved course of business. An unchanged solid base therefore remains from which to<br />
meet the challenges of the recovery that has now commenced, within an environment that continues<br />
to be characterized by great uncertainties.<br />
KEY FIGURES, APRIL–MARCH<br />
2010/11 2011/12 Changes<br />
Net sales<br />
EBITDA<br />
80.1<br />
4.9<br />
81.0<br />
11.7<br />
+1.1%<br />
+139.3%<br />
EBITDA margin (in % of net sales) 6.1% 14.4%<br />
EBIT A -9.8 -2.6 +73.4%<br />
EBIT margin (in % of net sales) -12.2% -3.2%<br />
Net income (net loss) A CHF million<br />
A Reporting year 2011/12:<br />
relative change to<br />
absolute EBIT or net<br />
loss of the previous<br />
year, respectively<br />
-7.1 -0.8 +89.0%<br />
Net income (net loss) margin (in % of net sales) -8.8% -1.0%<br />
Operating cash flow 30.4 3.8 -87.4%<br />
Employees (FTEs, annual average) 422 418 -0.9%