boohoocom-plc-final-admission-document-5-march-2014
boohoocom-plc-final-admission-document-5-march-2014
boohoocom-plc-final-admission-document-5-march-2014

Create successful ePaper yourself
Turn your PDF publications into a flip-book with our unique Google optimized e-Paper software.
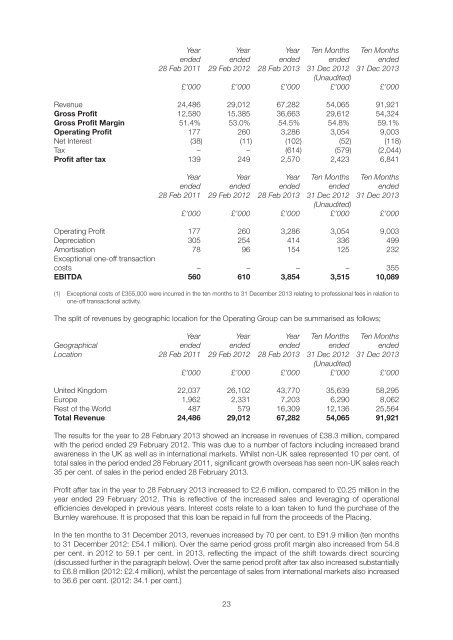
Year Year Year Ten Months Ten Months<br />
ended ended ended ended ended<br />
28 Feb 2011 29 Feb 2012 28 Feb 2013 31 Dec 2012 31 Dec 2013<br />
(Unaudited)<br />
£’000 £’000 £’000 £’000 £’000<br />
Revenue 24,486 29,012 67,282 54,065 91,921<br />
Gross Profit 12,580 15,385 36,663 29,612 54,324<br />
Gross Profit Margin 51.4% 53.0% 54.5% 54.8% 59.1%<br />
Operating Profit 177 260 3,286 3,054 9,003<br />
Net Interest (38) (11) (102) (52) (118)<br />
Tax – – (614) (579) (2,044)<br />
Profit after tax 139 249 2,570 2,423 6,841<br />
Year Year Year Ten Months Ten Months<br />
ended ended ended ended ended<br />
28 Feb 2011 29 Feb 2012 28 Feb 2013 31 Dec 2012 31 Dec 2013<br />
(Unaudited)<br />
£’000 £’000 £’000 £’000 £’000<br />
Operating Profit 177 260 3,286 3,054 9,003<br />
Depreciation 305 254 414 336 499<br />
Amortisation 78 96 154 125 232<br />
Exceptional one-off transaction<br />
costs – – – – 355<br />
EBITDA 560 610 3,854 3,515 10,089<br />
(1) Exceptional costs of £355,000 were incurred in the ten months to 31 December 2013 relating to professional fees in relation to<br />
one-off transactional activity.<br />
The split of revenues by geographic location for the Operating Group can be summarised as follows;<br />
Year Year Year Ten Months Ten Months<br />
Geographical ended ended ended ended ended<br />
Location 28 Feb 2011 29 Feb 2012 28 Feb 2013 31 Dec 2012 31 Dec 2013<br />
(Unaudited)<br />
£’000 £’000 £’000 £’000 £’000<br />
United Kingdom 22,037 26,102 43,770 35,639 58,295<br />
Europe 1,962 2,331 7,203 6,290 8,062<br />
Rest of the World 487 579 16,309 12,136 25,564<br />
Total Revenue 24,486 29,012 67,282 54,065 91,921<br />
The results for the year to 28 February 2013 showed an increase in revenues of £38.3 million, compared<br />
with the period ended 29 February 2012. This was due to a number of factors including increased brand<br />
awareness in the UK as well as in international markets. Whilst non-UK sales represented 10 per cent. of<br />
total sales in the period ended 28 February 2011, significant growth overseas has seen non-UK sales reach<br />
35 per cent. of sales in the period ended 28 February 2013.<br />
Profit after tax in the year to 28 February 2013 increased to £2.6 million, compared to £0.25 million in the<br />
year ended 29 February 2012. This is reflective of the increased sales and leveraging of operational<br />
efficiencies developed in previous years. Interest costs relate to a loan taken to fund the purchase of the<br />
Burnley warehouse. It is proposed that this loan be repaid in full from the proceeds of the Placing.<br />
In the ten months to 31 December 2013, revenues increased by 70 per cent. to £91.9 million (ten months<br />
to 31 December 2012: £54.1 million). Over the same period gross profit margin also increased from 54.8<br />
per cent. in 2012 to 59.1 per cent. in 2013, reflecting the impact of the shift towards direct sourcing<br />
(discussed further in the paragraph below). Over the same period profit after tax also increased substantially<br />
to £6.8 million (2012: £2.4 million), whilst the percentage of sales from international markets also increased<br />
to 36.6 per cent. (2012: 34.1 per cent.)<br />
Annex I 6.2<br />
[Annex I 3.2]<br />
23