Seasonal Variation of Landfill Methane Emissions from ... - JGSEE
Seasonal Variation of Landfill Methane Emissions from ... - JGSEE
Seasonal Variation of Landfill Methane Emissions from ... - JGSEE

Create successful ePaper yourself
Turn your PDF publications into a flip-book with our unique Google optimized e-Paper software.
The 2 nd Joint International Conference on “Sustainable Energy and Environment (SEE 2006)”<br />
D-026 (O) 21-23 November 2006, Bangkok, Thailand<br />
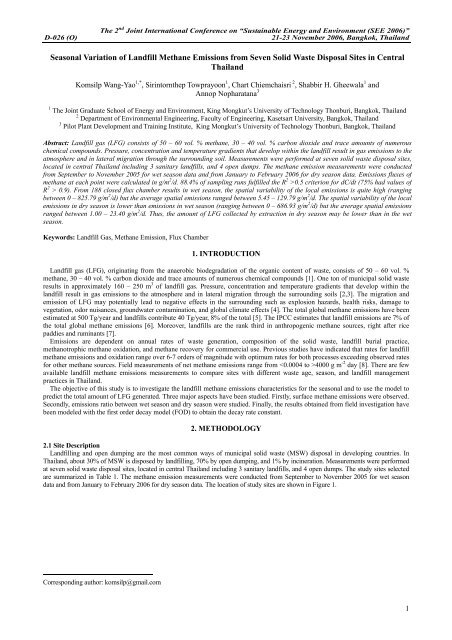
<strong>Seasonal</strong> <strong>Variation</strong> <strong>of</strong> <strong>Landfill</strong> <strong>Methane</strong> <strong>Emissions</strong> <strong>from</strong> Seven Solid Waste Disposal Sites in Central<br />
Thailand<br />
Komsilp Wang-Yao 1,* , Sirintornthep Towprayoon 1 , Chart Chiemchaisri 2 , Shabbir H. Gheewala 1 and<br />
Annop Nopharatana 3<br />
1 The Joint Graduate School <strong>of</strong> Energy and Environment, King Mongkut’s University <strong>of</strong> Technology Thonburi, Bangkok, Thailand<br />
2 Department <strong>of</strong> Environmental Engineering, Faculty <strong>of</strong> Engineering, Kasetsart University, Bangkok, Thailand<br />
3 Pilot Plant Development and Training Institute, King Mongkut’s University <strong>of</strong> Technology Thonburi, Bangkok, Thailand<br />
Abstract: <strong>Landfill</strong> gas (LFG) consists <strong>of</strong> 50 – 60 vol. % methane, 30 – 40 vol. % carbon dioxide and trace amounts <strong>of</strong> numerous<br />
chemical compounds. Pressure, concentration and temperature gradients that develop within the landfill result in gas emissions to the<br />
atmosphere and in lateral migration through the surrounding soil. Measurements were performed at seven solid waste disposal sites,<br />
located in central Thailand including 3 sanitary landfills, and 4 open dumps. The methane emission measurements were conducted<br />
<strong>from</strong> September to November 2005 for wet season data and <strong>from</strong> January to February 2006 for dry season data. <strong>Emissions</strong> fluxes <strong>of</strong><br />
methane at each point were calculated in g/m 2 /d. 88.4% <strong>of</strong> sampling runs fulfilled the R 2 >0.5 criterion for dC/dt (75% had values <strong>of</strong><br />
R 2 > 0.9). From 188 closed flux chamber results in wet season, the spatial variability <strong>of</strong> the local emissions is quite high (ranging<br />
between 0 – 825.79 g/m 2 /d) but the average spatial emissions ranged between 5.45 – 129.79 g/m 2 /d. The spatial variability <strong>of</strong> the local<br />
emissions in dry season is lower than emissions in wet season (ranging between 0 – 686.93 g/m 2 /d) but the average spatial emissions<br />
ranged between 1.00 – 23.40 g/m 2 /d. Thus, the amount <strong>of</strong> LFG collected by extraction in dry season may be lower than in the wet<br />
season.<br />
Keywords: <strong>Landfill</strong> Gas, <strong>Methane</strong> Emission, Flux Chamber<br />
1. INTRODUCTION<br />
<strong>Landfill</strong> gas (LFG), originating <strong>from</strong> the anaerobic biodegradation <strong>of</strong> the organic content <strong>of</strong> waste, consists <strong>of</strong> 50 – 60 vol. %<br />
methane, 30 – 40 vol. % carbon dioxide and trace amounts <strong>of</strong> numerous chemical compounds [1]. One ton <strong>of</strong> municipal solid waste<br />
results in approximately 160 – 250 m 3 <strong>of</strong> landfill gas. Pressure, concentration and temperature gradients that develop within the<br />
landfill result in gas emissions to the atmosphere and in lateral migration through the surrounding soils [2,3]. The migration and<br />
emission <strong>of</strong> LFG may potentially lead to negative effects in the surrounding such as explosion hazards, health risks, damage to<br />
vegetation, odor nuisances, groundwater contamination, and global climate effects [4]. The total global methane emissions have been<br />
estimated at 500 Tg/year and landfills contribute 40 Tg/year, 8% <strong>of</strong> the total [5]. The IPCC estimates that landfill emissions are 7% <strong>of</strong><br />
the total global methane emissions [6]. Moreover, landfills are the rank third in anthropogenic methane sources, right after rice<br />
paddies and ruminants [7].<br />
<strong>Emissions</strong> are dependent on annual rates <strong>of</strong> waste generation, composition <strong>of</strong> the solid waste, landfill burial practice,<br />
methanotrophic methane oxidation, and methane recovery for commercial use. Previous studies have indicated that rates for landfill<br />
methane emissions and oxidation range over 6-7 orders <strong>of</strong> magnitude with optimum rates for both processes exceeding observed rates<br />
for other methane sources. Field measurements <strong>of</strong> net methane emissions range <strong>from</strong> 4000 g m -2 day [8]. There are few<br />
available landfill methane emissions measurements to compare sites with different waste age, season, and landfill management<br />
practices in Thailand.<br />
The objective <strong>of</strong> this study is to investigate the landfill methane emissions characteristics for the seasonal and to use the model to<br />
predict the total amount <strong>of</strong> LFG generated. Three major aspects have been studied. Firstly, surface methane emissions were observed.<br />
Secondly, emissions ratio between wet season and dry season were studied. Finally, the results obtained <strong>from</strong> field investigation have<br />
been modeled with the first order decay model (FOD) to obtain the decay rate constant.<br />
2. METHODOLOGY<br />
2.1 Site Description<br />
<strong>Landfill</strong>ing and open dumping are the most common ways <strong>of</strong> municipal solid waste (MSW) disposal in developing countries. In<br />
Thailand, about 30% <strong>of</strong> MSW is disposed by landfilling, 70% by open dumping, and 1% by incineration. Measurements were performed<br />
at seven solid waste disposal sites, located in central Thailand including 3 sanitary landfills, and 4 open dumps. The study sites selected<br />
are summarized in Table 1. The methane emission measurements were conducted <strong>from</strong> September to November 2005 for wet season<br />
data and <strong>from</strong> January to February 2006 for dry season data. The location <strong>of</strong> study sites are shown in Figure 1.<br />
Corresponding author: komsilp@gmail.com<br />
1
The 2 nd Joint International Conference on “Sustainable Energy and Environment (SEE 2006)”<br />
D-026 (O) 21-23 November 2006, Bangkok, Thailand<br />
Table 1 Characteristics <strong>of</strong> study sites<br />
Site Disposal practice Began<br />
operation<br />
Waste stream<br />
(tons/day)<br />
Waste in place<br />
(tons)<br />
<strong>Landfill</strong>ing area<br />
(hectares)<br />
Pattaya sanitary landfill 2002 245 ~350,000 22.4<br />
Cha Am sanitary landfill 2000 56 ~50,000 19<br />
Hua Hin sanitary landfill 1998 68 ~160,000 12<br />
Nonthaburi open dump 1986 850 ~5,500,000 29.8<br />
Nakhonpathom open dump 1997 180 ~590,000 5<br />
Samutprakan open dump 1999 80 ~180,000 2.5<br />
Rayong open dump 1998 70 ~114,000 3.5<br />
Fig. 1 Location <strong>of</strong> sanitary landfill sites<br />
2.2 <strong>Methane</strong> emission rates and gas analysis<br />
Flux chamber technique consists <strong>of</strong> trapping the gas as it leaves the soil surface, either by allowing the gas to build up in a closed<br />
enclosure (closed or static chamber technique), or by removing and measuring the gas as it leaves the enclosure (open or dynamic<br />
chamber technique) [9]. <strong>Methane</strong> emission rates <strong>from</strong> the landfill surface in this study were determined using the static chamber<br />
technique. Static chambers are the most frequently used technique for the measurement <strong>of</strong> gas fluxes <strong>from</strong> soils. The chamber<br />
technique is low in cost, and simple to operate but extremely labor and time intensive [10]. The chambers used in this study were<br />
constructed with 0.40 m. - PVC pipe, 0.25 m. in height having PVC cap at the top <strong>of</strong> chamber. To protect the air intrusion,<br />
chambers were sealed to the ground by firming soil around the outside. <strong>Methane</strong> samples were collected <strong>from</strong> a chamber after1, 2, 3,<br />
and 4 minutes using 60-mL plastic syringes fitted with plastic valves. These gases were contained in 10-mL vacuum tube. Samples<br />
were analyzed on a gas chromatograph equipped with a flame ionization detector. <strong>Methane</strong> flux was determined <strong>from</strong> concentration<br />
data (C in ppmv) plotted versus elapsed time (t in minutes). The data generally showed a linear relationship, in which case dC/dt is<br />
the slope <strong>of</strong> the fitted line. The methane flux, F (g/m 2 /d), was then calculated in Equation 1 as follows:<br />
F = V/A (dC/dt) Equation 1<br />
Where V is chamber volume and, A is the area covered by the chamber. The slope <strong>of</strong> the line, dC/dt, was determined by linear<br />
regression between CH 4 concentration and elapsed time.<br />
In order to conduct the flux chamber measurements, numerous samples were collected across the landfill or open dump surface on<br />
a regular grid pattern at 30 – 40m intervals. Precipitation was absent and barometric pressure and ambient wind speed, factors which<br />
are known to affect emissions, were relatively constant during this period.<br />
2.3 Geospatial distribution<br />
The major disadvantage <strong>of</strong> the chamber measurements having a small footprint so a large number <strong>of</strong> sampling points should be<br />
provided for detailed spatial distribution study. However, in order for the geospatial analysis to be <strong>of</strong> value, proper interpolation<br />
methodology must be applied. These methods <strong>of</strong>fer the potential <strong>of</strong> calculating whole site emission estimates <strong>from</strong> limited point<br />
measurements, which could lead to improving overall national inventories for global landfill methane emission estimates [11].<br />
Geospatial distributions <strong>of</strong> the methane emissions in this study were estimated by Kriging method. Kriging refers to the process <strong>of</strong><br />
using the spatial dependency to predict the value <strong>of</strong> a property at unknown location <strong>from</strong> the relationship observed in the sampling<br />
location. The weight for the kriging analysis was decided by semivariogram. Mapping s<strong>of</strong>tware Surfer by Golden S<strong>of</strong>tware was used<br />
to analyse the geospatial distribution in this study. The kriging model was applied to map the results, and the volumetric value <strong>of</strong> the<br />
contour map was estimated by volume and area integration algorithms in Surfer.<br />
2
The 2 nd Joint International Conference on “Sustainable Energy and Environment (SEE 2006)”<br />
D-026 (O) 21-23 November 2006, Bangkok, Thailand<br />
2.4 LFG generation model<br />
There are a variety <strong>of</strong> methods that can be used to evaluate the feasibility and potential benefits <strong>of</strong> collecting and using the<br />
generated landfill gas for energy recovery or other uses. However, the Mexico <strong>Landfill</strong> Gas Model (Mexico LFG Model) is generally<br />
recognized as being the widely used approach. The landfill gas generation rates are estimated by the model along with estimates <strong>of</strong><br />
the efficiency <strong>of</strong> the collection system in capturing generated gas, known as the collection efficiency. The model provides landfill gas<br />
recovery estimates by multiplying the landfill gas generation by the estimated recovery efficiency as follows in Equation2:<br />
n<br />
−kt Q = ∑2<br />
( i<br />
M<br />
kLoM<br />
i<br />
e ) Equation 2.<br />
i=<br />
1<br />
Where:<br />
n<br />
∑ = sum <strong>from</strong> opening year+1 (i=1) through year <strong>of</strong> projection (n)<br />
i = 1<br />
Q<br />
M<br />
= maximum expected LFG generation flow rate (m 3 /yr)<br />
k = methane generation rate (year -1 )<br />
L<br />
o<br />
= potential methane generation capacity (m 3 /Mg)<br />
M<br />
i<br />
= mass <strong>of</strong> waste accepted in the i th year (Mg)<br />
t<br />
i<br />
= age <strong>of</strong> the waste disposed in the i th year (years)<br />
The L o value is dependent on the composition <strong>of</strong> the waste, and in particular, the fraction <strong>of</strong> organic matter present. The L o value is<br />
estimated based on the carbon content <strong>of</strong> the waste, the biodegradable carbon fraction, and a stoichiometric conversion factor.<br />
According to IPCC, a variation <strong>from</strong> less than 100 to more than 200m³ <strong>of</strong> CH 4<br />
per ton <strong>of</strong> waste is indicated [12]. Normally, L o<br />
adapted to European waste, with approximately 30% <strong>of</strong> organic matter, is 100 m³/ton <strong>of</strong> waste. By using average study site waste<br />
composition and landfilling practice with IPCC method, 100 m³ <strong>of</strong> CH 4<br />
per ton <strong>of</strong> waste is obtained for Pattaya, Cha-Am and Hua-<br />
Hin landfill site. 80 m³ <strong>of</strong> CH 4<br />
per ton <strong>of</strong> waste is obtained for Nakhonpathom dump site. 40 m³ <strong>of</strong> CH 4<br />
per ton <strong>of</strong> waste is obtained<br />
for Rayong dump site.<br />
The methane generation rate constant (k) determines the rate <strong>of</strong> generation <strong>of</strong> methane for refuse in the landfill. The k value is a<br />
function <strong>of</strong> a number <strong>of</strong> factors including refuse moisture content, availability <strong>of</strong> nutrients for methanogens, pH, and temperature.<br />
The values <strong>of</strong> k can range <strong>from</strong> 0.003 per year to 0.21 per year [13]. In Thailand, a larger fraction <strong>of</strong> readily biodegradable organic<br />
matter and high moisture content could be a reason to expect a larger value <strong>of</strong> k. The k value <strong>of</strong> 0.15 per year was calculated based on<br />
Thai waste composition [14].<br />
3. RESULTS AND DISCUSSION<br />
3.1 <strong>Methane</strong> emissions<br />
Studies were carried out at 7 sites as mentioned earlier. Measured methane emissions <strong>from</strong> different waste disposal techniques are<br />
presented in Table 2 for both wet season and dry season. <strong>Emissions</strong> fluxes <strong>of</strong> methane at each point were calculated in g/m 2 /d. 88.4%<br />
<strong>of</strong> sampling runs fulfilled the R 2 >0.5 criterion for dC/dt (75% had values <strong>of</strong> R 2 > 0.9). Mapping s<strong>of</strong>tware Surfer was used to analyse<br />
the geospatial distribution and average spatial emissions in all study sites.<br />
Table 2 <strong>Methane</strong> emissions at 7 disposal sites in wet season and dry season<br />
CH 4 emissions in wet season<br />
CH 4 emissions in dry season<br />
Average<br />
spatial<br />
emissions<br />
(g/m 2 /d)<br />
Average<br />
spatial<br />
emissions<br />
(g/m 2 /d)<br />
Emission ratio<br />
(wet season/dry<br />
season)<br />
Site<br />
Range<br />
Number<br />
<strong>of</strong> test<br />
points<br />
Range<br />
Number<br />
<strong>of</strong> test<br />
points<br />
Pattaya 0.38 – 697.85 40 129.79 0.00 – 686.93 41 23.40 5.55<br />
Cha-Am 0.00 – 58.24 30 5.45 0.00 – 8.45 31 1.00 5.45<br />
Hua-Hin 0.00 – 295.82 30 51.79 0.00 – 117.00 40 10.31 5.02<br />
Nakhon Pathom 0.00 – 825.79 30 7.89 0.00 – 38.09 32 4.17 1.89<br />
Nonthaburi 0.00 – 358.22 20 3.94 0.00 – 19.94 20 1.64 2.40<br />
Rayong 0.00 – 22.79 22 2.44 0.00 – 2.89 20 1.00 2.44<br />
Samutprakan 0.00 – 724.09 16 12.21 0.00 – 14.28 16 4.82 2.53<br />
From 188 closed flux chamber results in wet season, the spatial variability <strong>of</strong> the local emissions is quite high (ranging between 0<br />
– 825.79 g/m 2 /d) but the average spatial emissions ranged between 5.45 – 129.79 g/m 2 /d. It can be seen <strong>from</strong> Table 2 that the<br />
methane emission for wet season is 5 times that for dry season in landfill whereas it is only 2 times in open dump.<br />
3
The 2 nd Joint International Conference on “Sustainable Energy and Environment (SEE 2006)”<br />
D-026 (O) 21-23 November 2006, Bangkok, Thailand<br />
3.2 <strong>Methane</strong> generation rate<br />
The study site’s information including L o , disposal area and waste disposal history were used to evaluate the value <strong>of</strong> k by fit with<br />
experimental data in the Mexico LFG Model. The obtained values <strong>of</strong> k are summarized in Table 3. It is clear that the values <strong>of</strong> k are<br />
higher in wet season than dry season by about 7.5 – 9.6 times for landfills but varied between 2.1 – 11.5 times for open dump sites.<br />
Table 3 The obtained value <strong>of</strong> methane generation rate (k)<br />
Site <strong>Landfill</strong>ing Condition k-wet season (yr -1 ) k-dry season (yr -1 )<br />
Pattaya Managed - Deep 0.192 0.020<br />
Cha-Am Managed - Shallow 0.040 0.005<br />
Nakornprathom Unmanaged - Deep 0.005 0.002<br />
Hua-Hin Managed - Deep 0.138 0.016<br />
Nontaburi Unmanaged - Deep 0.0003 0.0001<br />
Rayong Unmanaged - Shallow 0.013 0.004<br />
Samutprakan Unmanaged - Deep 0.013 0.001<br />
4. CONCLUSION<br />
Measurements for methane emission were performed at seven solid waste disposal sites, located in central Thailand including 3<br />
sanitary landfills, and 4 open dumps. 88.4% <strong>of</strong> sampling runs fulfilled the R 2 >0.5 criterion for dC/dt (75% had values <strong>of</strong> R 2 > 0.9).<br />
The spatial variability <strong>of</strong> the local emissions in wet season is quite high (ranging between 0 – 825.79 g/m 2 /d) but the average spatial<br />
emissions ranged between 5.45 – 129.79 g/m 2 /d. The spatial variability <strong>of</strong> the local emissions in dry season is lower than emissions in<br />
wet season (ranging between 0 – 686.93 g/m 2 /d) but the average spatial emissions ranged between 1.00 – 23.40 g/m 2 /d. The obtained<br />
values <strong>of</strong> k that used for methane emissions calculation ranged <strong>from</strong> 0.04000 – 0.19200 and 0.00530 – 0.02000 in landfills for wet<br />
season and dry season, respectively. The obtained values <strong>of</strong> k for open dump sites ranged <strong>from</strong> 0.00030 – 0.01340 and 0.00012 –<br />
0.00420 for wet season and dry season, respectively. The emissions in wet season are much higher than dry season. The moisture<br />
content in waste disposal body might be the main cause for these phenomena.<br />
6. REFERENCES<br />
[1] Khalil, M., (1999) Non-CO2 greenhouse gases in the atmosphere, Annu Rev Energy Environ, 24, pp. 645 – 661.<br />
[2] Nastev, M., Therrien, R., Lefebvre, R. and Gelinas, P. (2001) Gas production and mitigation in landfills and geological materials,<br />
J. Contaminant Hydrology, 52, pp. 187-211.<br />
[3] Humer, M. and Lechner, P. (1999) Alternative approach to the elimination <strong>of</strong> greenhouse gases <strong>from</strong> old landfills, Waste<br />
management research, 17, pp. 443-452.<br />
[4] Christophersen, M and Kjeldsen, P. (2001) Lateral gas transport in soil adjacent to and old landfill: factors governing gas<br />
migration, Waste Management Research, 19, pp. 579-594.<br />
[5] Fung, I., Lerner, J., Matthews, E., Prather, M., Steele, L., Fraser, P. (1997) Three-dimensional model synthesis <strong>of</strong> the global<br />
methane cycle. Journal <strong>of</strong> Geophysical Research 96, 13033–13065.<br />
[6] IPCC (2001) Climate Change 2001: The Scientific Basis. Contribution <strong>of</strong> working group I to the 3rd assessment report <strong>of</strong> the<br />
intergovernmental panel on climate change, Cambridge University Press, United Kingdom and New York.<br />
[7] Peer, R.L., Thorneloe, A.S. and Epperson, L.D. (1993) A comparison <strong>of</strong> methods for estimating global methane emissions <strong>from</strong><br />
landfill, J. Chemosphere, 26, (1-4), pp. 387-400.<br />
[8] Bogner, J., Meadows, M. and Czepiel, P. (1997) Fluxes <strong>of</strong> methane between landfills and the atmosphere: natural and<br />
engineered controls, Soil Use and Management, 13, pp. 268-277.<br />
[9] Perera, M.D.N., Hettiaratchi, J.P.A. and Achari, G. (1999) A mathematical model to improve the accuracy <strong>of</strong> gas emission<br />
measurements <strong>from</strong> landfills, Proceedings Sardinia 99, Seventh International Waste Management and <strong>Landfill</strong> Symposium S.<br />
Margherita di Pula, Cagliari, Italy; 4-8 October 1999.<br />
[10] Bogner, J. and Matthews E. (1999) Temporal variation in landfill methane emissions: a global perspective, Proceedings Sardinia<br />
99, Seventh International Waste Management and <strong>Landfill</strong> Symposium S. Margherita di Pula, Cagliari, Italy; 4-8 October 1999.<br />
[11] Spokas, K., Graff, C., Morcet, M., and Aran, C. (2003) Implications <strong>of</strong> the spatial variability <strong>of</strong> landfill emission rates on<br />
geospatial analyses, Waste Management, 23, pp. 599–607.<br />
[12] Intergovernmental Panel on Climate Change (IPCC) (1997). Revised 1996 IPCC Guidelines for National Greenhouse Gas<br />
Inventories: Volume 3 Reference Manual, J.T. Houghton et al., IPCC/OECD/IEA, Paris, France.<br />
[13] US EPA (1998) User’s Manual <strong>Landfill</strong> Gas <strong>Emissions</strong> Model Version 2.01, US EPA-600/R-98-054, United States<br />
Environmental Protection Agency.<br />
[14] Eam-o-pas, K. and Panpradit, B. (2003) <strong>Landfill</strong> Gas Recovery Using Horizontal Collectors in Thailand, Fourth International<br />
Conference <strong>of</strong> the ORBIT Association, Perth, Australia.<br />
4