RENTAL MARKET REPORT - SCHL
RENTAL MARKET REPORT - SCHL
RENTAL MARKET REPORT - SCHL

You also want an ePaper? Increase the reach of your titles
YUMPU automatically turns print PDFs into web optimized ePapers that Google loves.
H o u s i n g M a r k e t I n f o r m a t i o n<br />
<strong>RENTAL</strong> <strong>MARKET</strong> <strong>REPORT</strong><br />
Nova Scotia Highlights*<br />
C a n a d a M o r t g a g e a n d H o u s i n g C o r p o r a t i o n<br />
Date Released: Fall 2011<br />
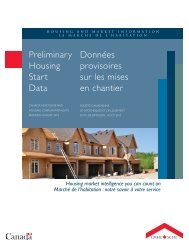
Figure 1<br />
Halifax CMA<br />
Vacancy Rates (%)<br />
Private Structures with 3 or more apartments<br />
Vacancy Rate<br />
Declines in<br />
Nova Scotia<br />
Cape Breton CA<br />
Truro CA<br />
New Glasgow CA<br />
Kentville CA<br />
0 1 2 3 4 5 6<br />
Oct-11 Oct-10<br />
• The overall vacancy rate 1 in Nova<br />
Scotia’s urban centres 2 declined<br />
from 2.9 per cent to 2.7 per cent<br />
in October 2011.<br />
• Vacancy rates declined in twobedroom<br />
units but remained<br />
relatively unchanged in all other<br />
bedroom types.<br />
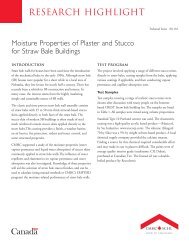
Figure 2<br />
Halifax CMA<br />
Cape Breton CA<br />
Truro CA<br />
New Glasgow CA<br />
Kentville CA<br />
Average Rent - Two-Bedroom ($)<br />
Private Structures with 3 or more apartments<br />
0 100 200 300 400 500 600 700 800 900 1000<br />
• Halifax CMA recorded a vacancy<br />
rate of 2.4 per cent in October<br />
2011 which was relatively<br />
unchanged compared to last year.<br />
• The average vacancy rate for a<br />
two-bedroom apartment in Nova<br />
Scotia was 2.8 per cent and the<br />
average rent was $882.<br />
• The overall average rent in the<br />
province increased 2.1 per cent<br />
in October (based on structures<br />
common to both the 2010 and<br />
2011 surveys) 3 .<br />
Oct-11<br />
Oct-10<br />
Housing market intelligence you can count on
Rental Market Report - Nova Scotia Highlights - Date Released - Fall 2011<br />
Overview<br />
The overall vacancy rate in urban<br />
centres across Nova Scotia declined<br />
from 2.9 per cent in October 2010 to<br />
2.7 per cent in October 2011. For the<br />
same period, the average rent in the<br />
province increased 2.1 per cent based<br />
on structures common to both the<br />
2010 and 2011 surveys.<br />
Factors impacting the Nova Scotia<br />
rental market were mixed across the<br />
province. Migration to Nova Scotia<br />
slowed in late 2010 and in early 2011.<br />
Recent migration patterns show that<br />
most parts of the province, with the<br />
exception of Halifax and Truro, have<br />
seen negative net-migration. With<br />
more people leaving than arriving in<br />
these areas, demand for all types of<br />
housing, including rental housing, was<br />
reduced. In Halifax and Truro, however,<br />
more positive migration created<br />
additional demand and put some<br />
downward pressure on vacancy rates.<br />
In the Northern Economic Region<br />
(which includes Truro and New<br />
Glasgow), demand for rental units was<br />
supported by growth in employment<br />
in 2011. In Cape Breton and the<br />
Annapolis Valley regions, however,<br />
rental demand was reduced, due in<br />
part, to declines in employment levels<br />
in those regions.<br />
On the supply side, a reduction in<br />
new apartment construction back in<br />
2008 and 2009 continues to impact<br />
the Nova Scotia rental market.<br />
While rental apartment construction<br />
increased significantly in both 2010<br />
and 2011, many of the units remained<br />
under construction or were not yet<br />
available to rent at the time of the<br />
survey. The number of new rental<br />
unit completions in 2010 (698 units)<br />
and as of October 2011 (640 units)<br />
were well below the recent ten-year<br />
average of 779 units. As a result,<br />
reduced levels of new supply put<br />
downward pressure on the overall<br />
provincial vacancy rate in 2011.<br />
Vacancy Rate Trends<br />
Vacancy rate changes in Nova Scotia<br />
varied by centre in 2011. The Halifax<br />
CMA, which accounts for 84 per cent<br />
of the total provincial rental universe<br />
(40,624 of 48,156 rental units), was<br />
statistically unchanged with a vacancy<br />
rate of 2.4 per cent in October 2011.<br />
Cape Breton and Kings Subdivision<br />
A both recorded more vacancies as<br />
rates increased from 2.9 per cent to<br />
3.7 per cent and 1.0 to 3.4 per cent,<br />
respectively.<br />
In Truro, the second largest rental<br />
universe, the vacancy rate was 4.2<br />
per cent in October 2011 – down<br />
from 5.7 per cent last year. In<br />
Kentville, the vacancy rate recorded<br />
little change compared to 2010 at 5.2<br />
per cent.<br />
More than half of all rental units<br />
in Nova Scotia are two-bedroom<br />
units and for the second year in a<br />
row this type of unit recorded the<br />
highest vacancy rate in the province<br />
at 2.8 per cent. One-bedroom<br />
units encompass over one-third of<br />
the provincial rental universe and<br />
reported a below average vacancy<br />
rate of 2.5 per cent. Bachelor-style<br />
units represent just over six per cent<br />
of the rental market and recorded<br />
little change in vacancies as the rate<br />
was recorded at 2.4 per cent in<br />
October of this year.<br />
Average Rents<br />
The overall average rent in the<br />
province was $834 in October 2011<br />
with the average rent for a twobedroom<br />
apartment at $882. Halifax<br />
recorded the highest average twobedroom<br />
rent of $925, followed by<br />
Truro at $751 and Cape Breton at<br />
$686. The average two-bedroom rent<br />
in New Glasgow was $616 per month.<br />
Based on structures common to<br />
both the 2011 and 2010 surveys, the<br />
average rent in Nova Scotia increased<br />
in 2011. Overall, the average rent<br />
increased by 2.1 per cent this year,<br />
less than the 3.1 per cent increase<br />
recorded last year. Due to its large<br />
share of the provincial apartment<br />
universe (84 per cent), the Halifax<br />
CMA had the greatest impact on<br />
the provincial average. In Halifax the<br />
average rent increased 2.0 per cent.<br />
The provincial increase was slightly<br />
higher than what was recorded in<br />
Halifax due to a larger percentage<br />
increase in Cape Breton at 5.5<br />
per cent. Truro recorded the lowest<br />
average rent increase at 1.7 per cent<br />
with Kentville coming in a little higher<br />
at 1.9 per cent.<br />
Availability Rates<br />
Availability rates in Nova Scotia<br />
decreased in October 2011 to 3.3<br />
per cent from 3.6 per cent last year.<br />
1<br />
Based on privately-initiated rental apartments structures of three or more units.<br />
2<br />
Urban centres are defined as centres with a population of over 10,000. Census metropolitan areas (CMA) are based on Statistics Canada definition.<br />
3<br />
When comparing year-over-year average rents, the age of the building needs to be taken into consideration because rents in newly-built structures tend to be<br />
higher than in existing buildings. By comparing rents for units that are common to both 2010 and 2011 Fall rental market surveys, we can get a better indication of<br />
actual rent increases paid by most tenants.<br />
Canada Mortgage and Housing Corporation<br />
2
Rental Market Report - Nova Scotia Highlights - Date Released - Fall 2011<br />
A unit is considered available if the<br />
existing tenant has given or received<br />
notice to vacate the unit and a new<br />
tenant has not yet signed a lease; or<br />
the unit is vacant.<br />
The largest decrease in availability rates<br />
was recorded in one and two-bedroom<br />
units where the rate decreased to 3.1<br />
per cent and 3.4 per cent from 3.5<br />
per cent and 3.8 per cent, respectively.<br />
Three-bedroom units recorded an<br />
increase in the availability rate to 3.0<br />
per cent in October 2011 from 2.5<br />
per cent last year.<br />
Canada Mortgage and Housing Corporation<br />
3
Rental Market Report - Nova Scotia Highlights - Date Released - Fall 2011<br />
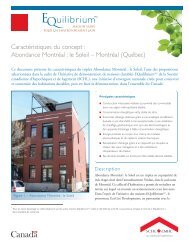
Nova Scotia Apartment Vacancy Rates<br />
Kentville<br />
5.2%<br />
"<br />
Truro<br />
4.2%<br />
"<br />
"<br />
Halifax<br />
2.4%<br />
"<br />
New Glasgow<br />
2.8%<br />
N<br />
<br />
Cape Breton<br />
3.7%<br />
"<br />
<br />
<br />
0 15 30 60 90<br />
Km<br />
Legend<br />
2.4% 2011 vacancy rate for Halifax<br />
ç Vacancy rate in 2011 the same as 2010<br />
Vacancy rate in 2011 higher than 2010<br />
Vacancy rate in 2011 lower than 2010<br />
<br />
Canada Mortgage and Housing Corporation<br />
4
Rental Market Report - Nova Scotia Highlights - Date Released - Fall 2011<br />
Centre<br />
1.1.1 Private Apartment Vacancy Rates (%)<br />
by Bedroom Type<br />
Nova Scotia<br />
Bachelor 1 Bedroom 2 Bedroom<br />
Oct-10 Oct-11 Oct-10 Oct-11<br />
3 Bedroom + Total<br />
Oct-10 Oct-11 Oct-10 Oct-11<br />
Oct-10<br />
The following letter codes are used to indicate the reliability of the estimates:<br />
a – Excellent, b – Very good, c – Good, d – Fair (Use with Caution)<br />
** Data supresses to protect confidentiality or data not statistically reliable.<br />
n/u: No units exist in the universe for this category n/s: No units exist in the sample for this category n/a: Not applicable<br />
Please click Methodology or Data Reliability Tables Appendix link for more details<br />
Oct-11<br />
Halifax CMA 2.3 a 1.6 a 2.3 a 2.3 a 2.9 a 2.6 a 2.1 a 1.9 a 2.6 a 2.4 a<br />
Cape Breton CA 2.8 c 6.6 c 4.3 b 3.2 c 2.6 a 3.3 b 1.5 b 5.2 b 2.9 a 3.7 a<br />
Sydney City 3.1 d 6.9 c 3.9 c 2.1 b 2.5 a 3.0 b 0.9 a 5.0 b 2.8 a 3.4 b<br />
Remainder of CA 0.0 a ** 5.1 b 5.7 c 2.6 b 4.1 b 5.0 a ** 3.4 b 4.6 b<br />
Kentville CA 8.9 c ** 6.0 c 3.5 c 4.3 b 4.8 b ** 11.0 c 5.1 b 5.2 a<br />
Kings, Subd. A SC n/u n/u ** ** 0.0 d 4.2 b ** ** 1.0 d 3.4 b<br />
New Glasgow CA 3.3 c 5.0 b 5.5 b 3.2 b 2.5 a 2.3 a 3.1 a 3.6 a 3.4 a 2.8 a<br />
Truro CA ** 3.6 c 4.7 b 4.6 b 6.2 a 3.9 a 0.0 c ** 5.7 a 4.2 a<br />
Nova Scotia 10,000+ 2.7 a 2.4 a 2.6 a 2.5 a 3.2 a 2.8 a 2.2 a 2.3 a 2.9 a 2.7 a<br />
Centre<br />
1.1.2 Private Apartment Average Rents ($)<br />
by Bedroom Type<br />
Nova Scotia<br />
Bachelor 1 Bedroom 2 Bedroom 3 Bedroom +<br />
Oct-10 Oct-11 Oct-10 Oct-11<br />
Oct-10 Oct-11 Oct-10 Oct-11<br />
Oct-10<br />
Halifax CMA 632 a 670 a 732 a 753 a 891 a 925 a 1,146 a 1,182 a 836 a 866 a<br />
Cape Breton CA 485 a 503 a 542 a 547 a 652 a 686 a 857 a 883 a 625 a 649 a<br />
Sydney City 488 a 504 a 565 a 567 a 670 a 711 a 889 a 914 a 643 a 671 a<br />
Remainder of CA 442 b 479 c 488 a 505 a 608 a 629 a 688 b 710 b 576 a 594 a<br />
Kentville CA 471 a 522 a 524 a 526 a 619 a 638 a 769 a 696 a 593 a 607 a<br />
Kings, Subd. A SC n/s n/u 550 b 545 a 603 a 665 a ** ** 615 a 663 a<br />
New Glasgow CA 451 c 465 a 561 a 509 a 646 a 616 a 681 c 730 d 611 a 578 a<br />
Truro CA 464 a 474 a 558 a 577 a 726 a 751 a 782 b 782 a 670 a 697 a<br />
Nova Scotia 10,000+ 612 a 647 a 713 a 730 a 851 a 882 a 1,116 a 1,146 a 807 a 834 a<br />
The following letter codes are used to indicate the reliability of the estimates (cv = coefficient of variation):<br />
a – Excellent (0 £ cv £ 2.5), b – Very good (2.5 < cv £ 5), c – Good (5 < cv £ 7.5), d – Fair (Use with Caution) (7.5 < cv £ 10)<br />
** Data supresses to protect confidentiality or data not statistically reliable.<br />
n/u: No units exist in the universe for this category n/s: No units exist in the sample for this category n/a: Not applicable<br />
Please click Methodology or Data Reliability Tables Appendix link for more details<br />
Total<br />
Oct-11<br />
Canada Mortgage and Housing Corporation<br />
5
Rental Market Report - Nova Scotia Highlights - Date Released - Fall 2011<br />
Centre<br />
1.1.3 Number of Private Apartment Units in the Universe<br />
by Bedroom Type<br />
Nova Scotia<br />
Bachelor 1 Bedroom 2 Bedroom<br />
3 Bedroom + Total<br />
Oct-10 Oct-11 Oct-10 Oct-11 Oct-10 Oct-11 Oct-10 Oct-11 Oct-10 Oct-11<br />
Halifax CMA 2,569 2,572 15,032 15,140 19,338 19,726 3,177 3,186 40,116 40,624<br />
Cape Breton CA 148 141 451 451 1,114 1,115 120 118 1,833 1,825<br />
Sydney City 138 132 315 314 803 779 101 99 1,357 1,324<br />
Remainder of CA 10 9 136 137 311 336 19 19 476 501<br />
Kentville CA 53 54 345 350 850 881 56 55 1,304 1,340<br />
Kings, Subd. A SC 0 0 15 16 97 93 11 8 123 117<br />
New Glasgow CA 86 86 326 334 729 737 31 28 1,172 1,185<br />
Truro CA 97 97 740 717 1,643 1,714 115 114 2,595 2,642<br />
Nova Scotia 10,000+ 2,963 2,956 17,047 17,146 24,037 24,522 3,533 3,532 47,580 48,156<br />
The following letter codes are used to indicate the reliability of the estimates:<br />
a – Excellent, b – Very good, c – Good, d – Fair (Use with Caution)<br />
** Data supresses to protect confidentiality or data not statistically reliable.<br />
n/u: No units exist in the universe for this category n/s: No units exist in the sample for this category n/a: Not applicable<br />
Please click Methodology or Data Reliability Tables Appendix link for more details<br />
Centre<br />
1.1.4 Private Apartment Availability Rates (%)<br />
by Bedroom Type<br />
Nova Scotia<br />
Bachelor 1 Bedroom 2 Bedroom<br />
Oct-10 Oct-11 Oct-10 Oct-11<br />
3 Bedroom + Total<br />
Oct-10 Oct-11 Oct-10 Oct-11<br />
Oct-10<br />
Halifax CMA 3.2 b 2.9 a 3.1 a 3.0 a 3.7 a 3.2 a 2.4 a 2.7 a 3.3 a 3.1 a<br />
Cape Breton CA 5.0 c 6.6 c 4.3 b 3.2 c 2.6 a 3.5 b 1.5 b 6.9 b 3.1 b 3.9 a<br />
Sydney City 5.5 c 6.9 c 3.9 c 2.1 b 2.5 a 3.3 b 0.9 a 7.0 b 3.0 b 3.7 a<br />
Remainder of CA 0.0 a ** 5.1 b 5.7 c 2.6 b 4.1 b 5.0 a ** 3.4 b 4.6 b<br />
Kentville CA 8.9 c ** 7.7 b 3.5 c 4.4 b 4.8 b ** 11.0 c 5.7 b 5.2 a<br />
Kings, Subd. A SC n/s n/u ** ** 0.0 d 4.2 b ** ** 1.0 d 3.4 b<br />
New Glasgow CA 3.3 d 5.0 b 5.5 b 3.2 b 2.8 a 2.3 a ** 3.6 a 3.6 a 2.8 a<br />
Truro CA ** 3.6 c 6.0 b 4.6 b 6.6 a 4.0 a 0.0 c ** 6.3 a 4.2 a<br />
Nova Scotia 10,000+ 3.6 b 3.5 b 3.5 a 3.1 a 3.8 a 3.4 a 2.5 a 3.0 b 3.6 a 3.3 a<br />
The following letter codes are used to indicate the reliability of the estimates:<br />
a – Excellent, b – Very good, c – Good, d – Fair (Use with Caution)<br />
** Data supresses to protect confidentiality or data not statistically reliable.<br />
n/u: No units exist in the universe for this category n/s: No units exist in the sample for this category n/a: Not applicable<br />
Please click Methodology or Data Reliability Tables Appendix link for more details<br />
Oct-11<br />
Canada Mortgage and Housing Corporation<br />
6
Rental Market Report - Nova Scotia Highlights - Date Released - Fall 2011<br />
1.1.5 Private Apartment Estimate of Percentage Change (%) of Average Rent 1<br />
by Bedroom Type<br />
Nova Scotia<br />
Bachelor 1 Bedroom 2 Bedroom 3 Bedroom + Total<br />
Centre<br />
Oct-09 Oct-10 Oct-09 Oct-10 Oct-09 Oct-10 Oct-09 Oct-10 Oct-09 Oct-10<br />
to to to to to to to to to to<br />
Oct-10 Oct-11 Oct-10 Oct-11 Oct-10 Oct-11 Oct-10 Oct-11 Oct-10 Oct-11<br />
Halifax CMA 2.7 a 2.7 b 3.5 a 1.9 a 2.9 a 1.7 b 2.7 a 1.7 c 3.0 a 2.0 a<br />
Cape Breton CA -7.4 c 7.4 c ++ 3.1 c 1.9 b 5.8 b 6.7 c 4.6 b 2.5 a 5.5 b<br />
Sydney City -7.8 c 6.4 c ++ 2.9 c 2.2 b 6.6 b 7.2 c 5.0 b 2.8 b 6.0 b<br />
Remainder of CA ** ** ++ 3.8 c 1.3 a 4.1 c 4.5 d 2.5 c 1.6 c 4.3 b<br />
Kentville CA ** ** ++ 2.2 b 0.9 a 2.7 a ++ 1.2 a ++ 1.9 b<br />
Kings, Subd. A SC n/s n/u ++ ++ 2.3 b ++ ** n/s 2.5 c ++<br />
New Glasgow CA ++ ** ** ++ ** ** ** ++ ** ++<br />
Truro CA ** ** 0.8 d 2.1 c 1.9 a 1.3 a ++ ++ 1.2 a 1.7 b<br />
Nova Scotia 10,000+ 2.4 a 3.0 b 3.3 a 1.9 a 3.0 a 1.7 b 2.7 a 1.8 c 3.1 a 2.1 a<br />
1 The Percentage Change of Average Rent is a measure of the market movement, and is based on those structures that were common to the survey sample for both years.<br />
The following letter codes are used to indicate the reliability of the estimates:<br />
a – Excellent, b – Very good, c – Good, d – Fair (Use with Caution)<br />
** Data supresses to protect confidentiality or data not statistically reliable.<br />
++ Change in rent is not statistically significant. This means that the change in rent is not statistically different than zero (0).<br />
n/u: No units exist in the universe for this category n/s: No units exist in the sample for this category n/a: Not applicable<br />
Please click Methodology or Data Reliability Tables Appendix link for more details<br />
Canada Mortgage and Housing Corporation<br />
7
Rental Market Report - Nova Scotia Highlights - Date Released - Fall 2011<br />
Technical note:<br />
Difference between Percentage Change of Average Rents (Existing and New Structures) AND Percentage Change<br />
of Average Rents from Fixed Sample (Existing Structures Only):<br />
Percentage Change of Average Rents (New and Existing Structures): The increase/decrease obtained<br />
from the calculation of percentage change of average rents between two years (example: $500 in the<br />
previous year vs. $550 in current survey represents an increase of 10 percent) is impacted by changes in<br />
the composition of the rental universe (e.g. the inclusion of newly built luxury rental buildings in the<br />
survey, rental units renovated/upgraded or changing tenants could put upward pressure on average rents<br />
in comparison to the previous year) as well as by the rent level movement (e.g. increase/decrease in the<br />
level of rents that landlords charge their tenants).<br />
Percentage Change of Average Rents from Fixed Sample (Existing Structures Only): This is a measure<br />
that estimates the rent level movement. The estimate is based on structures that were common to the<br />
survey sample for both the previous year and the current Rental Market Surveys. However, some<br />
composition effects still remain e.g. rental units renovated/upgraded or changing tenants because the<br />
survey does not collect data to such level of details.<br />
Canada Mortgage and Housing Corporation<br />
8
Rental Market Report - Nova Scotia Highlights - Date Released - Fall 2011<br />
METHODOLOGY FOR <strong>RENTAL</strong> <strong>MARKET</strong> SURVEY<br />
Canada Mortgage and Housing Corporation (CMHC) conducts the Rental Market Survey (RMS) every year in April and<br />
October to estimate the relative strengths in the rental market. The survey is conducted on a sample basis in all urban areas<br />
with populations of 10,000 and more. The survey targets only privately initiated structures with at least three rental units, which<br />
have been on the market for at least three months. The survey collects market rent, available and vacant unit data from sampled<br />
structures. Most RMS data contained in this publication refer to privately initiated apartment structures.<br />
The survey is conducted by a combination of telephone interviews and site visits, and information is obtained from the owner,<br />
manager, or building superintendent. The survey is conducted during the first two weeks of April/October, and the results<br />
reflect market conditions at that time.<br />
CMHC’s Rental Market Survey provides a snapshot of vacancy and availability rates, and average rents in both new and existing<br />
structures. In October 2006, CMHC introduced a new measure for the change in rent that is calculated based on existing<br />
structures only. This estimate is based on structures that were common to the survey sample the previous year and the current<br />
year of the Rental Market Survey. The change in rent in existing structures is an estimate of the change in rent that the landlords<br />
charge and removes compositional effects on the rent level movement due to new buildings, conversions, and survey sample<br />
rotation. The estimate of per cent change in rent is available in the Rental Market Report – Canada Highlights , Provincial<br />
Highlights, and the local Rental Market Reports. The rent levels in new and existing structures are also published. While the per<br />
cent change in rents in existing structures published in the reports are statistically significant, changes in rents that one might<br />
calculate based on rent levels in new and existing structures may or may not be statistically significant.<br />
METHODOLOGY FOR SECONDARY <strong>RENTAL</strong> <strong>MARKET</strong> SURVEY<br />
Canada Mortgage and Housing Corporation (CMHC) conducts a survey of the Secondary Rental Market (SRMS) in<br />
September and October to estimate the relative strengths in the secondary rental market which is defined as those dwellings not<br />
covered by the regular RMS. CMHC has identified the following dwelling components to be included in SRMS:<br />
• Rented single-detached houses.<br />
• Rented double (semi-detached) houses (i.e.. Two units of approximate equal size and under one roof that are situated either<br />
side-by-side or front-to-back).<br />
• Rented freehold row/town homes.<br />
• Rented duplex apartments (i.e.. one-above-other).<br />
• Rented accessory apartments (separate dwelling units that are located within the structure of another dwelling type).<br />
• Rented condominiums (can be any dwelling type but are primarily apartments).<br />
• One or two apartments which are part of a commercial or other type of structure.<br />
The SRMS has three components which are conducted in selected CMAs:<br />
• A Household Rent Survey of all households to collect information about rents.<br />
• A Condominium Apartment Rent Survey of households living in condominium apartments to collect information about rents.<br />
• A Condominium Apartment Vacancy Survey of condominium apartment owners to collect vacancy information.<br />
All three surveys are conducted by telephone interviews. For the condominium apartment vacancy survey, information is<br />
obtained from the owner, manager, or building superintendent and can be supplemented by site visits if no telephone contact is<br />
made. For the other two surveys, information is collected from an adult living in the household. All surveys are conducted in<br />
September and October, and the results reflect market conditions at that time.<br />
CMHC publishes the number of units rented and vacancy rates for the condominium vacancy survey. For the condominium rent<br />
and household rent surveys, the average rent is published. A letter code representing the statistical reliability (i.e., the coefficient<br />
of variation (CV)) for each estimate is provided to indicate the data reliability. Rented condominium apartments were surveyed<br />
in the following CMAs: Vancouver, Victoria, Calgary, Edmonton, Regina, Saskatoon, Winnipeg, Toronto, Ottawa, Montréal and<br />
Québec (NOTE: condo rent data was not collected for Regina and Saskatoon). Other secondary rental market units were<br />
surveyed in Abbotsford, Barrie, Calgary, Edmonton, Halifax, Montréal, Ottawa, Québec, St. John’s, Toronto, Winnipeg, Regina,<br />
Saskatoon, Kelowna, Vancouver and Victoria.<br />
Canada Mortgage and Housing Corporation<br />
9
Rental Market Report - Nova Scotia Highlights - Date Released - Fall 2011<br />
Definitions<br />
Availability: A rental unit is considered available if the existing tenant has given, or has received, notice to move, and a new tenant has<br />
not signed a lease; or the unit is vacant (see definition of vacancy below).<br />
Rent: The rent refers to the actual amount tenants pay for their unit. No adjustments are made for the inclusion or exclusion of<br />
amenities and services such as heat, hydro, parking, and hot water. For available and vacant units, the rent is the amount the owner is<br />
asking for the unit.<br />
It should be noted that the average rents reported in this publication provide a sound indication of the amounts paid by unit size and<br />
geographical sector. Utilities such as heating, electricity and hot water may or may not be included in the rent.<br />
Rental Apartment Structure: Any building containing three or more rental units, of which at least one unit is not ground oriented.<br />
Owner-occupied units are not included in the rental building unit count.<br />
Rental Row (Townhouse) Structure: Any building containing three or more rental units, all of which are ground oriented with<br />
vertical divisions. Owner-occupied units are not included in the rental building unit count. These row units in some centres are<br />
commonly referred to as townhouses.<br />
Vacancy: A unit is considered vacant if, at the time of the survey, it is physically unoccupied and available for immediate rental.<br />
Definitions of Census Areas referred to in this publication are as follows:<br />
A census metropolitan area (CMA) or a census agglomeration (CA) is formed by one or more adjacent municipalities centred<br />
on a large urban area (known as the urban core). The census population count of the urban core is at least 10,000 to form<br />
a census agglomeration and at least 100,000 to form a census metropolitan area. To be included in the CMA or CA, other adjacent<br />
municipalities must have a high degree of integration with the central urban area, as measured by commuting flows derived from census<br />
place of work data. CMAs and CAs contain whole municipalities or Census Subdivisions.<br />
All data presented in this publication is based on Statistics Canada’s 2001 and 2006 Census area definitions.<br />
Acknowledgement<br />
The Rental Market Survey and the Secondary Rental Market Survey could not have been conducted without the cooperation<br />
of the rental property owners, managers, building superintendents and household members throughout Canada. CMHC acknowledges<br />
their hard work and assistance in providing timely and accurate information. As a result of their contribution, CMHC is able to provide<br />
information that benefits the entire housing industry.<br />
Rental Affordability Indicator<br />
Canada Mortgage and Housing Corporation has developed a rental affordability indicator to gauge how affordable a rental market is for<br />
those households which rent within that market. A centre's median income is divided by the level of income required for a household<br />
to rent a median priced two-bedroom apartment using 30 per cent of income. The result is then multiplied by 100. A value above 100<br />
indicates that less than 30 per cent of the median income is required to rent a two-bedroom apartment, conversely, a value below 100<br />
indicates that more than 30 per cent of the median income is required to rent the same unit. In general, as the indicator increases, the<br />
market becomes more affordable; as the indicator declines, the market becomes less affordable. For years for which the median income<br />
is not available, CMHC has developed forecasts.<br />
Median renter household income estimates used in the calculation of the rental affordability indicator are based on results of Statistics<br />
Canada’s Survey of Labour and Income Dynamics. Results for this survey are available from 1994 to 2009. CMHC has developed<br />
forecasts of median renter household income for 2010 and 2011. It should be noted that nominal values for both median rent and<br />
median incomes have been used to calculate the rental affordability indicator.<br />
Canada Mortgage and Housing Corporation<br />
10
Rental Market Report - Nova Scotia Highlights - Date Released - Fall 2011<br />
CMHC—Home to Canadians<br />
Canada Mortgage and Housing Corporation (CMHC) has been Canada's national housing agency for more than 65 years.<br />
Together with other housing stakeholders, we help ensure that the Canadian housing system remains one of the best in the<br />
world. We are committed to helping Canadians access a wide choice of quality, environmentally sustainable and affordable<br />
housing solutions that will continue to create vibrant and healthy communities and cities across the country.<br />
For more information, visit our website at www.cmhc.ca<br />
You can also reach us by phone at 1-800-668-2642 or by fax at 1-800-245-9274.<br />
Outside Canada call 613-748-2003 or fax to 613-748-2016.<br />
Canada Mortgage and Housing Corporation supports the Government of Canada policy on access to information for people<br />
with disabilities. If you wish to obtain this publication in alternative formats, call 1-800-668-2642.<br />
The Market Analysis Centre’s (MAC) electronic suite of national standardized products is available for free on CMHC’s<br />
website. You can view, print, download or subscribe to future editions and get market information e-mailed automatically to<br />
you the same day it is released. It’s quick and convenient! Go to www.cmhc.ca/housingmarketinformation<br />
For more information on MAC and the wealth of housing market information available to you, visit us today at<br />
www.cmhc.ca/housingmarketinformation<br />
To subscribe to priced, printed editions of MAC publications, call 1-800-668-2642.<br />
©2011 Canada Mortgage and Housing Corporation. All rights reserved. CMHC grants reasonable rights of use of this publication’s<br />
content solely for personal, corporate or public policy research, and educational purposes. This permission consists of the<br />
right to use the content for general reference purposes in written analyses and in the reporting of results, conclusions, and<br />
forecasts including the citation of limited amounts of supporting data extracted from this publication. Reasonable and limited<br />
rights of use are also permitted in commercial publications subject to the above criteria, and CMHC’s right to request that<br />
such use be discontinued for any reason.<br />
Any use of the publication’s content must include the source of the information, including statistical data, acknowledged as follows:<br />
Source: CMHC (or “Adapted from CMHC,” if appropriate), name of product, year and date of publication issue.<br />
Other than as outlined above, the content of the publication cannot be reproduced or transmitted to any person or, if acquired<br />
by an organization, to users outside the organization. Placing the publication, in whole or part, on a website accessible to the<br />
public or on any website accessible to persons not directly employed by the organization is not permitted. To use the<br />
content of any CMHC Market Analysis publication for any purpose other than the general reference purposes set out above<br />
or to request permission to reproduce large portions of, or entire CMHC Market Analysis publications, please contact: the<br />
Canadian Housing Information Centre (CHIC) at mailto:chic@cmhc.gc.ca; 613-748-2367 or 1-800-668-2642.<br />
For permission, please provide CHIC with the following information:<br />
Publication’s name, year and date of issue.<br />
Without limiting the generality of the foregoing, no portion of the content may be translated from English or French into any<br />
other language without the prior written permission of Canada Mortgage and Housing Corporation.<br />
The information, analyses and opinions contained in this publication are based on various sources believed to be reliable,<br />
but their accuracy cannot be guaranteed. The information, analyses and opinions shall not be taken as representations for<br />
which Canada Mortgage and Housing Corporation or any of its employees shall incur responsibility.<br />
Canada Mortgage and Housing Corporation<br />
11
Housing market<br />
intelligence<br />
you can count on<br />
FREE <strong>REPORT</strong>S AVAILABLE ON-LINE<br />
n Canadian Housing Statistics<br />
n Housing Information Monthly<br />
n Housing Market Outlook, Canada<br />
n Housing Market Outlook, Highlight Reports – Canada and Regional<br />
n Housing Market Outlook, Major Centres<br />
n Housing Market Tables: Selected South Central Ontario Centres<br />
n Housing Now, Canada<br />
n Housing Now, Major Centres<br />
n Housing Now, Regional<br />
n Monthly Housing Statistics<br />
n Northern Housing Outlook Report<br />
n Preliminary Housing Start Data<br />
n Renovation and Home Purchase Report<br />
n Rental Market Provincial Highlight Reports Now semi-annual!<br />
n Rental Market Reports, Major Centres<br />
n Rental Market Statistics Now semi-annual!<br />
n Residential Construction Digest, Prairie Centres<br />
n Seniors’ Housing Reports<br />
CMHC’s Market Analysis<br />
Centre e-reports provide<br />
a wealth of detailed local,<br />
provincial, regional and national<br />
market information.<br />
Forecasts and Analysis –<br />
Future-oriented information<br />
about local, regional and<br />
national housing trends.<br />
Statistics and Data –<br />
Information on current<br />
housing market activities —<br />
starts, rents, vacancy rates<br />
and much more.<br />
Get the market intelligence you need today!<br />
Click www.cmhc.ca/housingmarketinformation<br />
to view, download or subscribe.<br />
Housing Market Information<br />
Monthly Housing Starts<br />
One simple tool to share or host on your website