Chapter 3 Population Geography - W.H. Freeman
Chapter 3 Population Geography - W.H. Freeman
Chapter 3 Population Geography - W.H. Freeman

You also want an ePaper? Increase the reach of your titles
YUMPU automatically turns print PDFs into web optimized ePapers that Google loves.
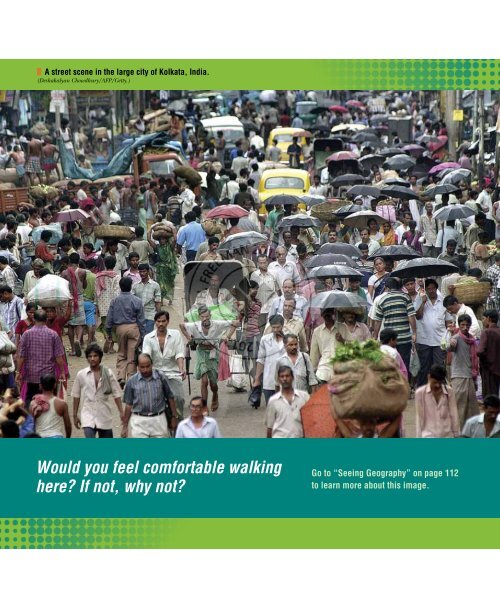
A street scene in the large city of Kolkata, India.<br />
(Deshakalyan Chowdhury/AFP/Getty.)<br />
Would you feel comfortable walking<br />
here? If not, why not?<br />
Go to “Seeing <strong>Geography</strong>” on page 112<br />
to learn more about this image.
<strong>Population</strong> <strong>Geography</strong><br />
Shaping the Human Mosaic<br />
The nineteenth-century French philosopher Auguste<br />
Comte famously asserted that “demography is<br />
destiny.” Though this might be a bit of an exaggeration,<br />
it is true that one of the most important<br />
aspects of the world’s human population is its demographic<br />
characteristics, such as age, gender, health,<br />
mortality, density, and mobility. In fact, many cultural<br />
geographers argue that familiarity with the spatial<br />
dimensions of demography provides a baseline for<br />
the discipline. Thus, population geography provides<br />
an ideal topic to launch our substantive discussion of<br />
the human mosaic.<br />
The most essential demographic fact is that more<br />
than 6.8 billion people inhabit the Earth today. But<br />
numbers alone tell only part of the story of the delicate<br />
balance between human populations and the resources<br />
on which we depend for our survival, comfort,<br />
and enjoyment. Think of the sort of lifestyle you may<br />
now enjoy or aspire to in the future. Does it involve<br />
driving a car? Eating meat regularly? Owning a spacious<br />
house with central heating and air conditioning?<br />
If so, you are not alone. In fact, these “Western”<br />
consumption habits have become so widespread that<br />
they may now be more properly regarded as universal.<br />
Satisfying these lifestyle demands requires using<br />
a wide range of nonrenewable resources—fossil fuels,<br />
extensive farmlands, and fresh water among them—<br />
whose consumption ultimately limits the number<br />
of people the Earth can support.<br />
Indeed, it has been argued that if<br />
Western lifestyles are adopted by a<br />
significant number of the globe’s<br />
inhabitants, then our current population<br />
of 6.8 billion is already excessive and will soon<br />
deplete or contaminate the Earth’s life-support systems:<br />
the air, soil, and water we depend on for our<br />
very survival. Although we may think of our geodemographic<br />
choices, such as how many children we will<br />
have or what to eat for dinner, as highly individual<br />
ones, when aggregated across whole groups they can<br />
have truly global repercussions.<br />
As we do throughout this book, we approach our<br />
study using the five themes of cultural geography. The<br />
demographics of human populations, their size, age,<br />
gender compositions, and spatial distribution, are discussed<br />
under the regional theme. <strong>Population</strong> mobility<br />
and the related movement of diseases that affect<br />
human populations are discussed next. <strong>Population</strong><br />
debates are considered under the theme of globalization.<br />
Although population is experienced locally and<br />
policies affecting population are typically set at the national<br />
level, the size and impact of human populations<br />
involve a debate that is most commonly pitched at the<br />
global scale. Next, the theme of nature-culture reveals<br />
that the ways in which we interpret the natural world<br />
and adapt it to our needs are deeply entwined with<br />
population geography<br />
The study of the spatial and<br />
ecological aspects of population,<br />
including distribution,<br />
density per unit of land area,<br />
fertility, gender, health, age,<br />
mortality, and migration.<br />
71
Maps.com<br />
72 <strong>Chapter</strong> 3 <strong>Population</strong> <strong>Geography</strong><br />
demographic practices. We close with a consideration<br />
of the demographic cultural landscape, which highlights<br />
the surprisingly diverse ways that places across<br />
the world respond to changing population dynamics.<br />
Region<br />
In what ways do demographic traits<br />
vary regionally? How is the theme of culture<br />
region expressed in terms of population<br />
characteristics? The principal<br />
characteristics of human populations—their densities, spatial<br />
distributions, age and gender structures, the ways they<br />
increase and decrease, and how rapidly population numbers<br />
change—vary enormously from place to place. Understanding<br />
the demographic characteristics of populations,<br />
and why and how they change over time, gives us important<br />
clues to their cultural characteristics.<br />
<strong>Population</strong> Distribution and Density<br />
If the 6,800,000,000 inhabitants of<br />
the Earth were evenly distributed<br />
across the land area, the population<br />
population density<br />
A measurement of population<br />
per unit area (for example,<br />
per square mile).<br />
<strong>Population</strong> Density<br />
80<br />
180 140 100 60 20<br />
80<br />
60<br />
40<br />
20<br />
<strong>Population</strong> Density<br />
Per sq km<br />
Per sq mile<br />
0–1<br />
1–25<br />
0–2<br />
2–60<br />
0<br />
140 120<br />
20<br />
25–100<br />
Over 100<br />
60–250<br />
Over 250<br />
0 1000 2000 mi.<br />
0 1000 2000 3000 km<br />
Scale at latitude 35°<br />
Figure 3.1 <strong>Population</strong> density in the world.<br />
Try to imagine the diverse causal forces—<br />
physical, environmental, and cultural—that have<br />
been at work over the centuries to produce this<br />
complicated spatial pattern. It represents the most<br />
basic cultural geographical distribution of all.<br />
(Source: <strong>Population</strong> Reference Bureau.)<br />
Flat Polar Quartic<br />
equal area projection<br />
40<br />
100 80 60 40 20
Region 73<br />
density would be about 115 persons per square mile (44<br />
per square kilometer). However, people are very unevenly<br />
distributed, creating huge disparities in density. Mongolia,<br />
for example, has 4.3 persons per square mile (1.7 per<br />
square kilometer), whereas Bangladesh has 2300 persons<br />
per square mile (890 per square kilometer) (Figure 3.1).<br />
If we consider the distribution of people by continents,<br />
we find that 72.7 percent of the human race lives in Eurasia<br />
—Europe and Asia. The continent of North America is home<br />
to only 7.9 percent of all people, Africa to 13.2 percent,<br />
South America to 5.7 percent, and Australia and the Pacific<br />
islands to 0.5 percent. When we consider population distribution<br />
by country, we find that 20 percent of all humans<br />
reside in China, 17 percent in India, and only 4.6 percent in<br />
the third-largest nation in the world, the United States (Table<br />
3.1, page 74). In fact, one out of every 50 humans lives in<br />
only one valley of one province of China: the Sichuan Basin.<br />
For analyzing data, it is convenient to divide population<br />
density into categories. For example, in Figure 3.1, one end<br />
of the spectrum contains thickly settled areas having 250 or<br />
more persons per square mile (100 or more per square kilometer);<br />
on the other end, largely unpopulated areas have<br />
fewer than 2 persons per square mile (less than 1 per square<br />
kilometer). Moderately settled areas, with 60 to 250 persons<br />
per square mile (25 to 100 per square kilometer), and thinly<br />
settled areas, inhabited by 2 to 60 persons per square mile<br />
40 0 40 80 120 160<br />
80<br />
60 60<br />
EUROPEAN CLUSTER<br />
40<br />
EAST<br />
ASIAN<br />
CLUSTER<br />
INDIAN<br />
SUBCONTINENT<br />
CLUSTER<br />
20<br />
0<br />
20<br />
40<br />
20<br />
0 20 40 60 80 100 120 140 160 180
74 <strong>Chapter</strong> 3 <strong>Population</strong> <strong>Geography</strong><br />
TABLE 3.1 The World’s 10 Most Populous Countries, 2010 and 2050<br />
Largest Countries <strong>Population</strong> in 2010 Largest Countries <strong>Population</strong> in 2050<br />
in 2010 (in millions) in 2050 (estimated, in millions)<br />
China 1,330 India 1,657<br />
India 1,173 China 1,304<br />
United States 310 United States 439<br />
Indonesia 243 Indonesia 313<br />
Brazil 201 Pakistan 291<br />
Pakistan 184 Ethiopia 278<br />
Bangladesh 156 Nigeria 264<br />
Nigeria 152 Brazil 261<br />
Russia 139 Bangladesh 250<br />
Japan 127 Democratic Republic 189<br />
of Congo<br />
(Source: U.S. Census Bureau International Data Base, 2010.)<br />
(1 to 25 per square kilometer), fall between these two extremes.<br />
These categories create formal demographic<br />
regions based on the single trait of population density. As<br />
Figure 3.1 shows, a fragmented crescent of densely settled<br />
areas stretches along the western, southern, and eastern<br />
edges of the huge Eurasian continent. Two-thirds of the<br />
human race is concentrated in this crescent, which contains<br />
three major population clusters: eastern Asia, the<br />
Indian subcontinent, and Europe. Outside of Eurasia, only<br />
scattered districts are so densely settled. Despite the image<br />
of a crowded world, thinly settled regions are much more<br />
extensive than thickly settled ones, and they appear on<br />
every continent. Thin settlement characterizes the northern<br />
sections of Eurasia and North America, the interior of<br />
South America, most of Australia, and a desert belt through<br />
North Africa and the Arabian Peninsula into the heart of<br />
Eurasia.<br />
As geographers, there is more we want to know about<br />
population geography than simply population density. For<br />
example, what are people’s standards of living and are they<br />
related to population density? Some of the most thickly<br />
populated areas in the world have the highest standards of<br />
living—and even suffer from labor shortages (for example,<br />
the major industrial areas of western Europe and Japan). In<br />
other cases, thinly settled regions may actually be severely<br />
overpopulated relative to their ability to support their populations,<br />
a situation that is usually associated with marginal<br />
agricultural lands. Although 1000 persons per square mile<br />
(400 per square kilometer) is a “sparse” population for an<br />
industrial district, it is “dense” for a<br />
rural area. For this reason, carrying<br />
capacity—the population beyond which<br />
a given environment cannot provide<br />
support without becoming significantly<br />
carrying capacity<br />
The maximum number of<br />
people that can be<br />
supported in a given area.<br />
damaged—provides a far more meaningful index of overpopulation<br />
than density alone. Oftentimes, however, it is difficult<br />
to determine carrying capacity until the region under<br />
study is near or over the limit. Sometimes the carrying capacity<br />
of one place can be expanded by drawing on the resources<br />
of another place. Americans, for example, consume far<br />
more food, products, and natural resources than do most<br />
other people in the world: 26 percent of the entire world’s<br />
petroleum, for instance, is consumed in the United States<br />
(Figure 3.2). The carrying capacity of the United States<br />
would be exceeded if it did not annex the resources—<br />
including the labor—of much of the rest of the world.<br />
A critical feature of population geography is the demographic<br />
changes that occur over time. Analyzing these<br />
gives us a dynamic perspective from which we can glean<br />
insights into cultural changes occurring at local, regional,<br />
and global scales. <strong>Population</strong>s change primarily in two<br />
ways: people are born and others die in a particular place,<br />
and people move into and out of that place. The latter<br />
refers to migration, which we will consider later in this<br />
chapter. For now we discuss births and deaths, which can<br />
be thought of as additions to and subtractions from a population.<br />
They provide what demographers refer to as natural<br />
increases and natural decreases.
Region 75<br />
21.52%<br />
12.44%<br />
11.79%<br />
10.76%<br />
9.95%<br />
Five top sources,<br />
percentage (%)<br />
0 5 10 15 20 25<br />
Canada<br />
Mexico<br />
Saudi Arabia<br />
Nigeria<br />
Venezuela<br />
Figure 3.2 From where does U.S. oil come? The United States has domestic oil<br />
resources, but they cannot fully supply the domestic demand, so oil is imported from other<br />
areas of the world. The United States consumes 26 percent of all the oil produced in the<br />
world. (Source: U.S. Department of Energy, 2010.)<br />
Patterns of Natality<br />
Births can be measured by several methods. The older way<br />
was simply to calculate the birthrate: the number of births<br />
per year per thousand people (Figure<br />
3.3, pages 76 –77).<br />
total fertility rate (TFR)<br />
The number of children the<br />
average woman will bear during More revealing is the total fertility<br />
rate (TFR), which is measured<br />
her reproductive lifetime (15–44<br />
or 15–49 years of age). A TFR as the average number of children<br />
of less than 2.1, if maintained,<br />
born per woman during her reproductive<br />
lifetime, which is consid-<br />
will cause a natural decline of<br />
population.<br />
ered to be from 15 to 49 years of age<br />
(some countries have a lower upper-age limit of 44 years of<br />
age). The TFR is a more useful measure than the birthrate<br />
because it focuses on the female segment of the population,<br />
reveals average family size, and gives an indication of future<br />
changes in the population structure. A TFR of 2.1 is needed<br />
to produce a stabilized population over time, one that does<br />
not increase or decrease. Once achieved, this condition is<br />
called zero population growth.<br />
zero population growth<br />
Maps.com<br />
A stabilized population created<br />
WH <strong>Freeman</strong> and Company Publishers<br />
Domosh/The when Human average Mosaic, of 12eonly two<br />
Perm children Fig: 302 per couple survive to<br />
Domosh12e_Fig3.02 - From where does U.S. oil come?<br />
April 20, adulthood, 2011 - Final so that, eventually,<br />
Cyan Magenta Yellow Black<br />
the number of deaths equals the<br />
number of births.<br />
The TFR varies markedly from<br />
one part of the world to another,<br />
revealing a vivid geographical pattern<br />
(Figure 3.4, pages 78 –79).<br />
In southern and eastern Europe,<br />
the average TFR is only 1.3. Every<br />
country with a TFR of 2.0 or lower will eventually experience<br />
population decline. Bulgaria, for example, has a<br />
TFR of 1.2 and is expected to lose 38 percent of its population<br />
by 2050. Interestingly, the Chinese Special Administrative<br />
Regions of Macau and Hong Kong report TFRs of<br />
only 0.91 and 1.04, respectively, the lowest in the world as<br />
of 2010.<br />
By contrast, sub-Saharan Africa has the highest TFR of<br />
any sizable part of the world, led by Niger with 7.68 and<br />
Uganda with 7.63 in 2010. Elsewhere in the world, only<br />
Afghanistan and Yemen, both in Southwest Asia, can rival<br />
the sub-Saharan African rates. However, according to the<br />
World Bank, during the past two decades TFRs have fallen<br />
in all sub-Saharan African nations.<br />
The <strong>Geography</strong> of Mortality<br />
Another way to assess demographic change is to analyze<br />
death rates: the number of deaths per year per 1000 people<br />
(Figure 3.5, pages 80–81). Of course, death is a natural<br />
part of the life cycle, and there is no way to achieve a death<br />
rate of zero. But geographically speaking, death comes in<br />
different forms. In the developed world, most people die<br />
of age-induced degenerative conditions, such as heart disease,<br />
or from maladies caused by industrial pollution of
76 <strong>Chapter</strong> 3 <strong>Population</strong> <strong>Geography</strong><br />
Crude Birthrate<br />
80<br />
180 140 100 60 20<br />
80<br />
60<br />
Birth Rate<br />
(births per year<br />
per 1,000 population)<br />
32 – 52<br />
22 – 31<br />
14 – 21<br />
0 – 13<br />
Not available<br />
40<br />
20<br />
0<br />
140 120<br />
0 1000 2000 mi.<br />
0 1000 2000 3000<br />
Scale at latitude 35°<br />
km<br />
20<br />
Figure 3.3 Crude birthrate. This<br />
map shows births per thousand<br />
population per year. (Source: <strong>Population</strong><br />
Reference Bureau.)<br />
Flat Polar Quartic<br />
equal area projection<br />
40<br />
100 80 60 40 20<br />
the environment. Many types of cancer fall into the latter<br />
category. By contrast, contagious diseases such as malaria,<br />
HIV/AIDS, and diarrheal diseases are a leading cause of<br />
death in poorer countries. Civil warfare, inadequate health<br />
services, and the age structure of a country’s population<br />
will also affect its death rate.<br />
The highest death rates occur in sub-Saharan Africa, the<br />
poorest world region and most afflicted by life-threatening<br />
diseases and civil strife (Figure 3.6, pages 82–83, illustrates<br />
the geography of HIV/AIDS). In general, death rates of<br />
more than 25 per 1000 people are uncommon today. The<br />
world’s highest death rate as of 2010—just under 24 per<br />
Maps.com<br />
WH <strong>Freeman</strong> and Company Publishers<br />
Domosh/The Human Mosaic, 12e<br />
Perm Fig: 303<br />
Domosh_Fig3.03a - Birth Rate<br />
April 20, 2011 - Final<br />
Cyan Magenta Yellow Black<br />
1000 people—was found in Angola, in southwestern Africa,<br />
and is the result of high infant mortality rates coupled with<br />
the destruction of Angola’s infrastructure and economy<br />
after thirty years of civil warfare. High death rates are also<br />
found in eastern European nations—Russia, for instance,<br />
ranked seventh in the world in 2010, with a death rate of<br />
16 per 1000, thanks to a collapsing public health care system<br />
in the post-Soviet era, environmental contamination<br />
and increased cancer incidence, poor health choices<br />
including smoking and alcohol consumption, and very<br />
high rates of diseases such as tuberculosis and HIV/AIDS.<br />
By contrast, the American tropics generally have rather<br />
low death rates, as does the desert belt across North Africa,<br />
the Middle East, and central Asia. In these regions, the
Region 77<br />
40 0 40 80 120 160<br />
80<br />
60 60<br />
40<br />
20<br />
0<br />
20<br />
40<br />
20<br />
0 20 40 60 80 100 120 140 160 180<br />
predominantly young population depresses the death rate.<br />
Compared to Angola, Nicaragua’s death rate of only 4 per<br />
1000 seems quite low. Because of its older population structure,<br />
the average death rate in the European Union is 10 per<br />
1000. Australia, Canada, and the United States, which continue<br />
to attract young immigrants, have lower death rates<br />
than most of Europe. Canada’s death rate, for instance, is<br />
slightly less than 8 people per 1000.<br />
The Demographic Transition<br />
Maps.com<br />
WH <strong>Freeman</strong> and Company Publishers<br />
Domosh/The Human Mosaic, 12e<br />
Perm Fig: 303<br />
Domosh_Fig3.03b - Birth Rate<br />
April 20, 2011 - Final<br />
Cyan Magenta Yellow Black<br />
All industrialized, technologically advanced countries have<br />
low fertility rates and stabilized or declining populations,<br />
having passed through what is called<br />
the demographic transition (Figure<br />
3.7, page 82). In preindustrial societies,<br />
birth and death rates were<br />
demographic transition<br />
A term used to describe the<br />
movement from high birth and<br />
death rates to low birth and<br />
death rates.<br />
both high, resulting in almost no population growth.<br />
Because these were agrarian societies that depended<br />
on family labor, many children meant larger workforces,<br />
thus the high birthrates. But low levels of public health<br />
and limited access to health care, particularly for the very<br />
young, also meant high death rates. With the coming of<br />
the industrial era, medical advances and improvements<br />
in diet set the stage for a drop in death rates. Human life<br />
expectancy in industrialized countries soared from an
78 <strong>Chapter</strong> 3 <strong>Population</strong> <strong>Geography</strong><br />
Fertility Rate<br />
TFR<br />
180 140 100 60 20<br />
Under 2.1<br />
80<br />
80<br />
2.1–3.0<br />
3.1–4.0<br />
60<br />
4.1–5.0<br />
5.1–6.0<br />
40<br />
Over 6.0<br />
Not available<br />
20<br />
0<br />
140 120<br />
20<br />
0 1000 2000 mi.<br />
0 1000 2000 3000<br />
km<br />
Scale at latitude 35°<br />
Figure 3.4 The total fertility rate (TFR) in the<br />
world. The TFR indicates the average number of<br />
children born to women over their lifetimes. A rate of<br />
2.1 is needed to produce a stable population over<br />
the long run; below that, population will decline. Fast<br />
growth is associated with a TFR of 5.0 or higher.<br />
(Source: <strong>Population</strong> Reference Bureau.)<br />
Flat Polar Quartic<br />
equal area projection<br />
40<br />
100 80 60 40 20<br />
average of 35 years in the eighteenth century to 75 years or<br />
more at present. Yet birthrates did not fall so quickly, leading<br />
to a population explosion as fertility outpaced mortality.<br />
In Figure 3.7, this is shown in late stage 2 and early<br />
stage 3 of the model. Eventually, a decline in the birthrate<br />
followed the decline in the death rate, slowing population<br />
growth. An important reason leading to lower fertility levels<br />
involves the high cost of children in industrial societies,<br />
particularly because childhood itself becomes a prolonged<br />
period of economic dependence on parents. Finally, in<br />
Maps.com<br />
WH <strong>Freeman</strong> and Company Publishers<br />
Domosh/The Human Mosaic, 12e<br />
Perm Fig: 304<br />
Domosh_Fig3.04a - Total Fertility Rate<br />
April 20, 2011 - Final<br />
Cyan Magenta Yellow Black<br />
the postindustrial period, the demographic transition<br />
produced zero population growth or actual population<br />
decline (Figure 3.7, page 82, and Figure 3.8, pages 84–85).<br />
Achieving lower death rates is relatively cost effective,<br />
historically requiring little more than the provision of safe<br />
drinking water and vaccinations against common infectious<br />
disease. Lowering death rates tends to be uncontroversial<br />
and quickly achieved, demographically speaking.<br />
Getting birthrates to fall, however, can be far more difficult,<br />
especially for a government official who wants to be
Region 79<br />
40 0 40 80 120 160<br />
80<br />
60 60<br />
40<br />
20<br />
0<br />
20<br />
40<br />
20<br />
0 20 40 60 80 100 120 140 160 180<br />
reelected. Birth control, abortion, and challenging longheld<br />
beliefs about family size can prove quite controversial,<br />
and political leaders may be reluctant to legislate for them.<br />
Indeed, the Chinese implementation of its one-child-percouple<br />
policy (see Subject to Debate, page 87) probably<br />
would not have been possible in a country with a democratically<br />
elected government. In addition, because it involves<br />
changing a cultural norm, the idea of smaller families can<br />
take three or four generations to take hold. Increased educational<br />
levels for women are closely associated with falling<br />
Maps.com<br />
WH <strong>Freeman</strong> and Company Publishers<br />
Domosh/The Human Mosaic, 12e<br />
Perm Fig: 304<br />
Domosh_Fig3.04b - Total Fertility Rate<br />
April 20, 2011 - Final<br />
Cyan Magenta Yellow Black<br />
fertility levels, as is access to various contraceptive devices<br />
(Figure 3.9, page 86).<br />
The demographic transition is a model that predicts<br />
trends in birthrates, death rates, and overall population<br />
levels in the abstract. Yet, like many models used by demographers,<br />
it is based on the historical experience of western<br />
Europe: it is Eurocentric. It does a good<br />
job of describing population patterns<br />
over time in Europe, as well as in other<br />
wealthy regions. However, it has several<br />
Eurocentric<br />
Using the historical experience<br />
of Europe as the benchmark for<br />
all cases.
80 <strong>Chapter</strong> 3 <strong>Population</strong> <strong>Geography</strong><br />
Crude Death Rate<br />
80<br />
180 140 100 60 20<br />
80<br />
60<br />
Death Rate<br />
(deaths per year<br />
per 1,000 population)<br />
12 – 20<br />
10 – 11<br />
7 – 9<br />
1 – 6<br />
Not available<br />
40<br />
20<br />
0<br />
140 120<br />
20<br />
0 1000 2000 mi.<br />
0 1000 2000 3000<br />
km<br />
Scale at latitude 35°<br />
Flat Polar Quartic<br />
equal area projection<br />
40<br />
Figure 3.5 Crude death rate. This map<br />
shows deaths per thousand population per<br />
year. (Source: <strong>Population</strong> Reference Bureau.)<br />
100 80 60 40 20<br />
shortcomings. First is the inexorable stage-by-stage progression<br />
implicit in the model. Have countries or regions<br />
ever skipped a stage or regressed? Certainly. The case of<br />
China shows how policy, in this case government-imposed<br />
restrictions on births, can fast-forward an entire nation to<br />
stage 4 (see Subject to Debate). War, too, can occasion a<br />
return to an earlier stage in the model by increasing death<br />
rates. For instance, Angola and Afghanistan are two countries<br />
with recent histories of conflict and with some of the<br />
highest death rates in the world: 24 per 1000 and 18 per<br />
1000, respectively. In other cases, wealth has not led to<br />
declining<br />
Maps.com<br />
fertility. Thanks to oil exports, residents of Saudi<br />
WH <strong>Freeman</strong> and Company Publishers<br />
Domosh/The Human Mosaic, 12e<br />
Perm Fig: 305<br />
Domosh_Fig3.05a - Death Rate<br />
April 20, 2011 - Final<br />
Cyan Magenta Yellow Black<br />
Arabia enjoy relatively high average incomes; but fertility,<br />
too, remains relatively high at nearly 4 children per woman<br />
in 2010. Indeed, the <strong>Population</strong> Reference Bureau has<br />
pointed to a “demographic divide” between countries<br />
where the demographic transition model applies well and<br />
others—mostly poorer countries or those experiencing<br />
widespread conflict or disease—where birth and death<br />
rates do not necessarily follow the model’s predictions.<br />
Even in Europe, there are countries where fertility has<br />
dropped precipitously, while at the same time death rates<br />
have escalated. In countries such as Russia, which, according<br />
to Peter Coclanis, has “somehow managed to reverse
Region 81<br />
40 0 40 80 120 160<br />
80<br />
60 60<br />
40<br />
20<br />
0<br />
20<br />
40<br />
20<br />
0 20 40 60 80 100 120 140 160 180<br />
the so-called demographic transition,” the model itself<br />
must be questioned.<br />
Age Distributions<br />
Some countries have overwhelmingly young populations.<br />
In a majority of countries in Africa, as well as some countries<br />
in Latin America and tropical Asia, close to half the<br />
population is younger than 15 years of age (Figure 3.10,<br />
pages 88–89). In Uganda, for example, 51 percent of the<br />
population is younger than 15 years of age. In sub-Saharan<br />
Maps.com<br />
WH <strong>Freeman</strong> and Company Publishers<br />
Domosh/The Human Mosaic, 12e<br />
Perm Fig: 305<br />
Domosh_Fig3.05b - Death Rate<br />
April 20, 2011 - Final<br />
Cyan Magenta Yellow Black<br />
Africa, 44 percent of all people are younger than 15. Other<br />
countries, generally those that industrialized early, have<br />
a preponderance of middle-aged people in the over 15–<br />
under 65 age bracket. A growing number of affluent countries<br />
have remarkably aged populations. In Germany, for<br />
example, fully 19 percent of the people have now passed<br />
the traditional retirement age of 65. Many other European<br />
countries are not far behind. A sharp contrast emerges<br />
when Europe is compared with Africa, Latin America, or<br />
parts of Asia, where the average person never even lives to<br />
age 65. In Mauritania, Niger, Afghanistan, Guatemala, and<br />
many other countries, only 2 to 3 percent of the people<br />
have reached that age.
82 <strong>Chapter</strong> 3 <strong>Population</strong> <strong>Geography</strong><br />
Adult HIV/AIDS Cases<br />
80<br />
180 140 100 60 20<br />
80<br />
60<br />
Adults (ages 15 – 49)<br />
with HIV/AIDS<br />
15.0% – 26.1%<br />
5.0% – 14.9%<br />
1.0% – 4.9%<br />
0.5% – 0.9%<br />
0.0% – 0.4%<br />
Not available<br />
40<br />
20<br />
0<br />
140 120<br />
20<br />
0<br />
0<br />
1000 2000 mi.<br />
1000 2000 km<br />
Scale at latitude 35°<br />
Figure 3.6 The geography of HIV/AIDS,<br />
shown as the percent of adults (ages 15 to 49)<br />
with HIV/AIDS in 2005–2006. The quality of data<br />
gathering varies widely from one country to<br />
another and is particularly poor in Africa and<br />
most of Asia. (Sources: <strong>Population</strong> Reference Bureau<br />
and UNAIDS.)<br />
Flat Polar Quartic<br />
equal area projection<br />
40<br />
100 80 60 40 20<br />
Births and deaths per year per thousand people<br />
40<br />
30<br />
Stabilized<br />
population,<br />
high birth<br />
and death<br />
rates<br />
Death rate<br />
20<br />
Maps.com<br />
WH <strong>Freeman</strong> and Company Publishers<br />
Domosh/The Human Mosaic, 12e<br />
Perm Fig: 306<br />
Domosh12e_Fig3.06a - Adults (15-49) with HIV/AIDS<br />
10<br />
April 20, 2011 - Final<br />
Cyan Magenta Yellow Black<br />
Birthrate<br />
<strong>Population</strong><br />
explosion,<br />
high birthrate,<br />
decreasing death<br />
rate<br />
Decreasing<br />
growth,<br />
rapidly<br />
declining<br />
birthrate<br />
Low birth and<br />
death rates,<br />
low growth<br />
of population<br />
Stage 1 Stage 2 Stage 3 Stage 4 Stage 5<br />
0<br />
Time scale<br />
Postindustrial<br />
Preindustrial Beginning of<br />
industrialization<br />
Industrialization<br />
completed period<br />
Figure 3.7 The demographic transition<br />
as a graph. The “transition” occurs in several<br />
stages as the industrialization of a country<br />
progresses. In stage 2, the death rate<br />
declines rapidly, causing a population<br />
explosion as the gap between the number of<br />
births and deaths widens. Then, in stage 3,<br />
the birthrate begins a sharp decline. The<br />
transition ends when, in stage 4, both birth<br />
and death rates have reached low levels, by<br />
which time the total population is many times<br />
greater than at the beginning of the<br />
transformation. In the postindustrial stage,<br />
population decline eventually begins.
Region 83<br />
40 0 40 80 120 160<br />
80<br />
60 60<br />
40<br />
20<br />
0<br />
20<br />
40<br />
20<br />
0 20 40 60 80 100 120 140 160 180<br />
Countries with disproportionate numbers of old or<br />
young people often address these imbalances in innovative<br />
ways. Italy, for example, has one of the lowest birthrates in<br />
the world, with a TFR of only 1.3. In addition, Italy’s population<br />
is one of the oldest in the world: 20.3 percent of its<br />
population is age 65 or older. As a result of both its TFR<br />
and age distribution, Italy’s population is projected to<br />
shrink by 10 percent between 2010 and 2050. Of course,<br />
immigrants to Italy from other countries can and doubtlessly<br />
will counteract this trend, but this will entail contentious<br />
political and cultural debates.<br />
Given that the Italian culture does not embrace the<br />
institutionalization of the growing ranks of its elderly, and<br />
Maps.com<br />
WH <strong>Freeman</strong> and Company Publishers<br />
Domosh/The Human Mosaic, 12e<br />
Perm Fig: 306<br />
Domosh12e_Fig3.06b - Adults (15-49) with HIV/AIDS<br />
April 20, 2011 - Final<br />
Cyan Magenta Yellow Black<br />
faced with the reality that more Italian women than ever<br />
work outside the home and thus few adult women are willing<br />
or able to stay at home full time to care for their elders,<br />
Italians have gotten creative. Elderly Italians can apply for<br />
adoption by families in need of grandfathers or grandmothers.<br />
Frances D’Emilio recounts the experience of one<br />
such man, Giorgio Angelozzi, who moved in with the Rivas,<br />
a Roman family with two teenagers. Angelozzi said that<br />
Marlena Riva’s voice reminded him of his deceased wife,<br />
Lucia, and this is what convinced him to choose the Riva<br />
family. Dagmara Riva, the family’s teenage daughter, said<br />
that Mr. Angelozzi has helped her with Latin studies<br />
and that “Grandpa is a person of great experience, an
84 <strong>Chapter</strong> 3 <strong>Population</strong> <strong>Geography</strong><br />
Annual <strong>Population</strong> Change<br />
180 140 100 60 20<br />
80<br />
80<br />
60<br />
40<br />
Decrease<br />
Less than .25%<br />
.25%–1.0%<br />
20<br />
1.1%–2.0%<br />
2.1%–3.0%<br />
Over 3.0%<br />
0<br />
140 120<br />
20<br />
Not available<br />
0 1000 2000 mi.<br />
0 1000 2000 3000<br />
km<br />
Figure 3.8 Annual population increase.<br />
The change is calculated as the difference<br />
between the number of births and deaths in a<br />
year, taken as a percentage of total population.<br />
Migration is not considered. Note the contrast<br />
between tropical areas and the middle and<br />
upper latitudes. In several places, countries with<br />
a very slow increase border areas with<br />
extremely high growth. (Source: <strong>Population</strong><br />
Reference Bureau.)<br />
Scale at latitude 35°<br />
Flat Polar Quartic<br />
equal area projection<br />
40<br />
100 80 60 40 20<br />
affectionate person. We’re very happy we invited him to<br />
live with us.”<br />
Age structure also differs spatially within individual<br />
countries. For example, rural populations in the United<br />
States and many other countries are usually older than<br />
those in urban areas. The flight of young people to the cities<br />
has left some rural counties in the midsection of the<br />
United States with populations whose median age is 45 or<br />
older. Some warm areas of the United States have become<br />
retirement havens for the elderly; parts of Arizona and<br />
Florida, for example, have populations far above the average<br />
age. Communities such as Sun City near Phoenix,<br />
Maps.com<br />
WH <strong>Freeman</strong> and Company Publishers<br />
Domosh/The Human Mosaic, 12e<br />
Perm Fig: 308<br />
Domosh12e_Fig3.08a - Annual population Change<br />
April 20, 2011 - Final<br />
Cyan Magenta Yellow Black<br />
Arizona, legally restrict residence to the elderly (Figure<br />
3.11, page 89). In Great Britain, coastal districts have a<br />
much higher proportion of elderly than does the interior,<br />
suggesting that the aged often migrate to seaside locations<br />
when they retire.<br />
population pyramid<br />
A graph used to show the<br />
age and sex composition of<br />
a population.<br />
A very useful graphic device for<br />
comparing age characteristics is the<br />
population pyramid (Figure 3.12,<br />
page 90). Careful study of such pyramids<br />
not only reveals the past progress of birth control but<br />
also allows geographers to predict future population<br />
trends. Youth-weighted pyramids, those that are broad at
Region 85<br />
40 0 40 80 120 160<br />
80<br />
60 60<br />
40<br />
20<br />
0<br />
20<br />
40<br />
20<br />
0 20 40 60 80 100 120 140 160 180<br />
the base, suggest the rapid growth typical of the population<br />
explosion. What’s more, broad-based population pyramids<br />
not only reflect past births but also show that future growth<br />
will rely on the momentum of all of those young people<br />
growing into their reproductive years and having their own<br />
families, regardless of how small those families may be in<br />
contrast to earlier generations. Those population pyramids<br />
with more of a cylindrical shape represent countries<br />
approaching population stability or those in demographic<br />
decline. A quick look at a country’s population pyramid<br />
can tell volumes about its past as well as its future. How<br />
many dependent people—the very old and the very<br />
Maps.com<br />
WH <strong>Freeman</strong> and Company Publishers<br />
Domosh/The Human Mosaic, 12e<br />
Perm Fig: 308<br />
Domosh12e_Fig3.08b - Annual population Change<br />
April 20, 2011 - Final<br />
Cyan Magenta Yellow Black<br />
young—live there? Has the country suffered the demographic<br />
effects of genocide or a massive disease epidemic<br />
(Figure 3.13, page 92)? Are significantly more boys than<br />
girls being born? These questions and more can be<br />
explored at a glance using a population pyramid.<br />
The <strong>Geography</strong> of Gender<br />
Although the human race is divided almost evenly between<br />
females and males, geographical differences<br />
do occur in the sex ratio: the The numerical ratio of males to<br />
sex ratio<br />
ratio between men and women in a females in a population.
86 <strong>Chapter</strong> 3 <strong>Population</strong> <strong>Geography</strong><br />
80<br />
180<br />
140<br />
100<br />
60<br />
20<br />
80<br />
40<br />
0<br />
40<br />
80 120 160<br />
80<br />
60<br />
60<br />
60<br />
40<br />
40<br />
20<br />
20<br />
140 120<br />
0<br />
0<br />
0<br />
1000 2000 mi.<br />
1000 2000 3000 km<br />
20<br />
Scale at latitude 35°<br />
20<br />
Flat Polar Quartic<br />
equal area projection<br />
40<br />
40<br />
100 80 60 40 20<br />
20 0 20 40 60 80 100 120 140 160 180<br />
Percentage of Women Practicing Some Method of Contraception<br />
Under 10% 10% to 25% 25.1% to 50% 50.1% to 75% Over 75%<br />
Not available<br />
Figure 3.9 The geography of contraception in the modern world, as measured by the percentage of<br />
women using devices of any sort. Contraception is much more widely practiced than abortion, but<br />
cultures differ greatly in their level of acceptance. Several different devices are included. (Source: World<br />
<strong>Population</strong> Data Sheet.)<br />
population (Figure 3.14, pages 92–93). Slightly more boys<br />
than girls are born, but infant boys have slightly higher<br />
mortality rates than do infant girls. Recently settled areas<br />
typically have more males than females, as is evident in<br />
parts of Alaska, northern Canada, and tropical Australia.<br />
According to the U.S. Census Bureau, in 2009 males constituted<br />
52 percent of Alaska’s inhabitants. By contrast,<br />
Mississippi’s population was 52 percent female, reflecting<br />
in part the emigration of young males in search of<br />
better economic opportunities elsewhere. Some povertystricken<br />
parts of South Africa are as much as 59 percent<br />
female. Prolonged wars reduce the male population.<br />
And, in general, women tend to outlive men. The population<br />
pyramid is also useful in showing gender ratios. Note,<br />
for instance, the larger female populations in the upper<br />
bars for both the United States and Sun City, Arizona, in<br />
Figure 3.12 (page 90).<br />
Beyond such general patterns, gender often influences<br />
demographic traits in specific ways. Often gender<br />
Maps.com<br />
WH <strong>Freeman</strong> and Company Publishers<br />
Domosh/The Human Mosaic, 12e<br />
Perm Fig: 310<br />
Domosh12e_Fig3.09 - Percentage of Women Practicing some form of Contraception<br />
April 20, 2011 - Final<br />
Cyan Magenta Yellow Black<br />
roles—culturally specific notions<br />
of what it means to be a man and<br />
what it means to be a woman—are<br />
closely tied to how many children<br />
gender roles<br />
What it means to be a man or a<br />
woman in different cultural and<br />
historical contexts.<br />
are produced by couples. In many cultures, women are<br />
considered more womanly when they produce many offspring.<br />
By the same token, men are seen as more manly<br />
when they father many children. Because the raising of<br />
children often falls to women, the spaces that many cultures<br />
associate with women tend to be the private family<br />
spaces of the home. Public spaces such as streets, plazas,<br />
and the workplace, by contrast, are often associated with<br />
men. Some cultures go so far as to restrict where women<br />
and men may and may not go, resulting in a distinctive<br />
geography of gender, as Figure 3.15, page 94, illustrates<br />
(see also Seeing <strong>Geography</strong>, page 112). Falling fertility levels<br />
that coincide with higher levels of education for<br />
women, however, have resulted in numerous challenges<br />
to these cultural ideas of male and female spaces. As more
Subject to Debate<br />
Female: An Endangered Gender?<br />
Does the simple fact of being female expose a person to<br />
demographic peril? In most societies, women are viewed<br />
as valuable, even powerful, particularly as mothers,<br />
nurturers, teachers, and spiritual leaders. Yet in other<br />
important ways, to be female is to be endangered. We<br />
will consider this controversial idea with an eye to how<br />
demographics and culture closely shape each other.<br />
Many cultures demonstrate a marked preference for<br />
males. The academic term describing this is androcentrism;<br />
you may know it as patriarchy, male bias, or simply sexism.<br />
Whether a preference for males is a feature of all societies<br />
has been disputed. Some societies pass along forms of their<br />
wealth, property, and prestige from mother to daughter,<br />
rather than from father to son. This is rare, however,<br />
and it is clear that the roots of the cultural preference<br />
for males are historically far-reaching and widespread. In<br />
most societies, positions of economic, political, social, and<br />
cultural prestige and power are held largely by men. Men<br />
typically are considered to be the heads of households.<br />
Family names tend to pass from father to son, and with<br />
them, family honor and wealth. In traditional societies,<br />
when sons marry, they usually bring their wives to live in<br />
their parents’ house and are expected to assume economic<br />
responsibility for aging parents.<br />
For all of these reasons, in many places a cultural<br />
premium is placed on producing male children. Because<br />
couples often can choose to have more children, having<br />
a girl first is usually not a problem. However, in countries<br />
that have enacted strict population control programs,<br />
couples may not be given the chance to try again for<br />
a male child. This has resulted in severe pressures on<br />
couples to have boys in some countries, particularly in<br />
China and India. In both of these countries, femalespecific<br />
infanticide or abortion has resulted in a growing<br />
gender imbalance. Ultrasound devices that allow gender<br />
identification of fetuses are now available even to rural<br />
peasants in China. About 100,000 such devices were<br />
in use as early as 1990 in China, and by the middle of<br />
that decade there were 121 males for every 100 females<br />
among children two years of age or younger. The sex<br />
ratio in China is radically changing, and a profound<br />
gender imbalance already exists there. In India, too,<br />
there were only 927 girls for each 1000 boys in 2001.<br />
The cultural ramifications of such male-heavy<br />
populations are potentially profound. Men of<br />
marriageable age are increasingly unable to find female<br />
partners. Social analysts speculate that this will lead to<br />
human trafficking and violence against women. In China,<br />
the policy of one child per couple has resulted in the socalled<br />
four-two-one problem. This refers to the fact that<br />
the generational structure of many families now reflects<br />
four grandparents, two parents, and a single male child.<br />
This places enormous pressures on the shoulders of the<br />
male child to care for aging parents and grandparents.<br />
It also encourages parents and grandparents to lavish all<br />
of their attention, wealth, and hopes on the only child.<br />
For some families, this has led to the “little emperor<br />
syndrome,” whereby the male heir becomes spoiled,<br />
unable to cope independently, and even obese.<br />
Continuing the Debate<br />
As noted, most societies value females. For a number of<br />
reasons, however, some societies show a clear preference<br />
for males. Keeping all of this in mind, consider these<br />
questions:<br />
• Are Chinese families somewhat justified in<br />
emphasizing having a boy at all costs?<br />
• According to a recent report, Americans using<br />
technology to select their baby’s gender, unlike the<br />
Chinese, more often choose to have a girl. Why do you<br />
think there is a difference between male and female<br />
preference in these two societies?<br />
This “little emperor” poses with his<br />
grandparents. (Dennis Cox, LLC.)<br />
87
88 <strong>Chapter</strong> 3 <strong>Population</strong> <strong>Geography</strong><br />
Youth and Old-Age<br />
<strong>Population</strong>s<br />
80<br />
180 140 100 60 20<br />
80<br />
60<br />
40<br />
Young and Old<br />
<strong>Population</strong>s<br />
40% or more of<br />
population 15 years of<br />
age or younger<br />
20<br />
15% or more of<br />
population 65 years of<br />
age or older<br />
0<br />
140 120<br />
20<br />
Not available<br />
0 1000 2000 mi.<br />
0 1000 2000 3000 km<br />
Scale at latitude 35°<br />
Figure 3.10 The world pattern of youth and<br />
old age. Some countries have populations with<br />
unusually large numbers of elderly people; others<br />
have preponderantly young populations. What issues<br />
might be associated with either situation?<br />
(Source: <strong>Population</strong> Reference Bureau.)<br />
Flat Polar Quartic<br />
equal area projection<br />
40<br />
100 80 60 40 20<br />
and more women enter the workplace, for instance, ideas<br />
of where women should and should not go slowly become<br />
modified. Clearly, gender is an important factor to consider<br />
in our exploration of population geography (see<br />
also Subject to Debate, page 87, and Patricia’s Notebook,<br />
page 91).<br />
Standard of Living<br />
Various demographic traits can be used to assess standard<br />
of living and analyze it geographically. Figure 3.16, pages<br />
Maps.com<br />
94–95, is a WH simple <strong>Freeman</strong> and attempt Company Publishers to map living standards using the<br />
Domosh/The Human Mosaic, 12e<br />
infant mortality Perm Fig: 311rate: a measure of how many children per<br />
Domosh12e_Fig3.10a - Young and Old <strong>Population</strong>s<br />
April 20, 2011 - Final<br />
Cyan Magenta Yellow Black<br />
1000 population die before reaching<br />
one year of age. Many experts<br />
believe that the infant mortality<br />
rate is the best single index of living<br />
infant mortality rate<br />
The number of infants per<br />
1000 live births who die before<br />
reaching one year of age.<br />
standards because it is affected by many different factors:<br />
health, nutrition, sanitation, access to doctors, availability<br />
of clinics, education, ability to obtain medicines, and adequacy<br />
of housing. A vivid geographical pattern is revealed<br />
by the infant mortality rate.<br />
Another good measure of quality of life is the United<br />
Nations Human Development Index (HDI), which combines<br />
measures of literacy, life expectancy, education, and<br />
wealth (see Figure 1.11, pages 14–15). The highest possible<br />
(continued on page 93)
Region 89<br />
40 0 40 80 120 160<br />
80<br />
60 60<br />
40<br />
20<br />
0<br />
20<br />
40<br />
20<br />
0 20 40 60 80 100 120 140 160 180<br />
Maps.com<br />
WH <strong>Freeman</strong> and Company Publishers<br />
Domosh/The Human Mosaic, 12e<br />
Perm Fig: 311<br />
Domosh12e_Fig3.10b - Young and Old <strong>Population</strong>s<br />
April 20, 2011 - Final<br />
Cyan Magenta Yellow Black<br />
Figure 3.11 Residents of Sun City, Arizona,<br />
enjoy the many recreation opportunities provided<br />
in this planned retirement community, where the<br />
average age is 75. (A. Ramey/PhotoEdit Inc.)
90 <strong>Chapter</strong> 3 <strong>Population</strong> <strong>Geography</strong><br />
80+ 80+<br />
75–79 75–79<br />
70–74 70–74<br />
65–69 65–69<br />
60–64 60–64<br />
55–59 55–59<br />
50–54 50–54<br />
45–49 45–49<br />
40–44 40–44<br />
35–39 35–39<br />
30–34 30–34<br />
25–29 25–29<br />
20–24 20–24<br />
15–19 15–19<br />
10–14 10–14<br />
5–9 5–9<br />
0–4 0–4<br />
20 20<br />
World World <strong>Population</strong><br />
United United States States <strong>Population</strong><br />
Males Males<br />
10 10 0 0<br />
Females<br />
10 10 20 20<br />
80+ 80+<br />
75–79 75–79<br />
70–74 70–74<br />
65–69 65–69<br />
60–64 60–64<br />
55–59 55–59<br />
50–54 50–54<br />
45–49 45–49<br />
40–44 40–44<br />
35–39 35–39<br />
30–34 30–34<br />
25–29 25–29<br />
20–24 20–24<br />
15–19 15–19<br />
10–14 10–14<br />
5–9 5–9<br />
0–4 0–4<br />
20 20<br />
Males Males<br />
10 10 0 0<br />
Females<br />
10 10<br />
Percentage<br />
Percentage<br />
20 20<br />
80+ 80+<br />
75–79 75–79<br />
70–74 70–74<br />
65–69 65–69<br />
60–64 60–64<br />
55–59 55–59<br />
50–54 50–54<br />
45–49 45–49<br />
40–44 40–44<br />
35–39 35–39<br />
30–34 30–34<br />
25–29 25–29<br />
20–24 20–24<br />
15–19 15–19<br />
10–14 10–14<br />
5–9 5–9<br />
0–4 0–4<br />
20 20<br />
Sun Sun City, City, AZ, AZ, <strong>Population</strong><br />
Males Males<br />
Females<br />
80+ 80+<br />
75–79 75–79<br />
70–74 70–74<br />
65–69 65–69<br />
60–64 60–64<br />
55–59 55–59<br />
50–54 50–54<br />
45–49 45–49<br />
40–44 40–44<br />
35–39 35–39<br />
30–34 30–34<br />
25–29 25–29<br />
20–24 20–24<br />
15–19 15–19<br />
10–14 10–14<br />
5–9 5–9<br />
0–4 0–4<br />
10 10 0 0 10 10 20 20<br />
20 20<br />
Percentage<br />
Tanzania <strong>Population</strong><br />
Males Males<br />
Females<br />
10 10 0 0 10 10<br />
Percentage<br />
20 20<br />
80+ 80+<br />
75–79 75–79<br />
70–74 70–74<br />
65–69 65–69<br />
60–64 60–64<br />
55–59 55–59<br />
50–54 50–54<br />
45–49 45–49<br />
40–44 40–44<br />
35–39 35–39<br />
30–34 30–34<br />
25–29 25–29<br />
20–24 20–24<br />
15–19 15–19<br />
10–14 10–14<br />
5–9 5–9<br />
0–4 0–4<br />
20 20<br />
China China <strong>Population</strong><br />
Males Males<br />
Females<br />
10 10 0 0 10 10<br />
Percentage<br />
20 20<br />
Figure 3.12 <strong>Population</strong> pyramids for the world and selected countries and communities.<br />
Tanzania displays the classic stepped pyramid of a rapidly expanding population, whereas the U.S.<br />
pyramid looks more like a precariously balanced pillar. China’s population pyramid reflects the<br />
lowered numbers of young people as a result of that country’s one-child policy. How do these<br />
pyramids help predict future population growth? (Source: <strong>Population</strong> Reference Bureau.)
Region 91<br />
Patricia’s Notebook<br />
Demystifying the Sunday Crowds<br />
in Hong Kong<br />
Filipina domestic servants in Hong Kong. On Sunday, their day off, these women<br />
congregate in covered walkways and other public spaces. They exchange gossip, play cards,<br />
cut each other’s hair, and relax. (Courtesy of Patricia L. Price.)<br />
During a recent<br />
trip to Hong Patricia Price<br />
Kong, I was<br />
struck by the dense crowds of women that<br />
can be seen on Sundays. Some of these<br />
gatherings are in public spaces, such as<br />
parks. Others are found in city spaces that<br />
are usually heavily trafficked during<br />
workdays, such as the steps outside large<br />
office buildings. The largest crowd I<br />
observed was under the covered walkway of<br />
a subway station. Initially, I thought that<br />
these women were gathered for a political<br />
demonstration of some kind. In Latin<br />
America—the world region I’m most familiar<br />
with—large gatherings of people almost<br />
always mean that a protest march, political<br />
rally, or labor strike is about to begin. But<br />
there were no men to be seen anywhere in<br />
these Hong Kong throngs! In addition, they<br />
didn’t seem to be protesting anything.<br />
Rather, they happily chatted, ate, styled one<br />
another’s hair, and played cards.<br />
Later, I learned that these women were<br />
in fact maids enjoying their day off. For<br />
several decades now, women from the<br />
Philippines have migrated to Hong Kong to<br />
work as domestic servants, doing chores<br />
for and looking after the children of the families who hire them. Wages in Hong Kong are much higher than back home<br />
in the Philippines: a major pull factor. However, working conditions can be far from ideal, involving hard physical labor<br />
and long hours. Reports of abuse of Filipina servants by their employers are numerous. If a servant is fired, she will be<br />
deported if she cannot find another job quickly. The stress of long separations from husbands and children back in the<br />
Philippines has led to the breakup of families. In addition, some of these women find themselves coerced into Asia’s<br />
booming sex industry. Knowing this makes me think twice about these happy-looking women. Though being a domestic<br />
servant isn’t a pleasant or highly paid job anywhere in the world, Filipina maids in Hong Kong certainly seem to face a<br />
number of pressures, ranging from labor conditions, family circumstances, and the lack of good job alternatives. While<br />
the news coverage of domestic servants in the United States seems to be mostly about their status as documented or<br />
undocumented workers, there are obviously additional factors to keep in mind. These factors complicated my picture of<br />
these women, who, at first glance, seemed happy and carefree as they enjoyed their day off.<br />
Posted by Patricia Price
92 <strong>Chapter</strong> 3 <strong>Population</strong> <strong>Geography</strong><br />
Age in years<br />
80<br />
75<br />
70<br />
65<br />
60<br />
55<br />
50<br />
45<br />
40<br />
35<br />
30<br />
25<br />
20<br />
15<br />
10<br />
5<br />
Males<br />
Females<br />
Projected population<br />
structure in 2020<br />
Deficits due to AIDS<br />
0<br />
140 120 100 80 60 40 20 0 20 40 60 80 100 120 140<br />
<strong>Population</strong> (thousands)<br />
Figure 3.13 Projected population structure<br />
with and without the AIDS epidemic in<br />
Botswana in 2020. (Sources: U.S. Bureau of Census;<br />
Food and Agriculture Organization of the United Nations.)<br />
Gender Ratio<br />
80<br />
180 140 100 60 20<br />
80<br />
60<br />
Sex Ratio<br />
(Males/Females)<br />
40<br />
0.84–0.89<br />
0.90–0.97<br />
20<br />
0.98–0.99<br />
1<br />
1.01–1.02<br />
0<br />
140 120<br />
20<br />
1.03–1.09<br />
1.10–2.20<br />
0 1000 2000 mi.<br />
0 1000 2000 3000 km<br />
Scale at latitude 35°<br />
Flat Polar Quartic<br />
equal area projection<br />
40<br />
Figure 3.14 Females as a percentage of<br />
total population. What explanations can you<br />
come up with for the gender imbalances<br />
shown on this map? (Source: <strong>Population</strong><br />
Reference Bureau.)<br />
100 80 60 40 20
Region 93<br />
score is 1.000, and the three top-ranked countries in 2009<br />
were Norway, Australia, and Iceland.<br />
Examination of the HDI reveals some surprises. If all<br />
countries spent equally on those things that improve their<br />
HDI rankings, such as education and health care, then we<br />
would expect the wealthiest countries to place first on the<br />
list. According to the International Monetary Fund, the<br />
United States ranked 9th among 180 ranked nations in<br />
wealth as measured by the gross domestic product (GDP)<br />
per capita in 2009. Yet it ranked 13th in the world on the<br />
HDI. Compare this to Barbados, which ranked 45th by<br />
GDP per capita but came in much higher on the HDI at<br />
37th. Why did Barbados rank higher in living standards<br />
than its monetary wealth would indicate, whereas the<br />
United States ranked lower? We would have to conclude<br />
that the government of Barbados places a relative priority<br />
on spending for education and health care, whereas the<br />
government of the United States does not.<br />
Even more striking is the low standing of the United<br />
States when the Human Poverty Index (HPI) is used. The<br />
HPI measures social and economic deprivation by examining<br />
the prevalence of factors such as low life expectancy,<br />
illiteracy, poverty, and unemployment. Among the world’s<br />
high-income countries, the United States ranks near the<br />
bottom, with only Italy and Ireland having larger numbers<br />
of deprived people.<br />
40 0 40 80 120 160<br />
80<br />
60 60<br />
40<br />
20<br />
0<br />
20<br />
40<br />
20<br />
0 20 40 60 80 100 120 140 160 180
94 <strong>Chapter</strong> 3 <strong>Population</strong> <strong>Geography</strong><br />
Figure 3.15 Segregated beach. This<br />
portion of the beachfront along the Israeli city<br />
of Tel Aviv allows women and men to swim on<br />
separate days. Young children of both genders<br />
accompany their mothers, whereas older boys<br />
visit with their fathers. Gender-based<br />
segregation is important for Israel’s orthodox<br />
Jews. (Courtesy of Patricia L. Price.)<br />
Infant Mortality Rate<br />
80<br />
180 140 100 60 20<br />
80<br />
60<br />
Infant Mortality<br />
Rate<br />
40<br />
Under 5<br />
5–10<br />
10.1–20<br />
20<br />
20.1–50<br />
50.1–100<br />
Over 100<br />
Not available<br />
0<br />
140 120<br />
0 1000 2000 mi.<br />
0 1000 2000 3000<br />
Scale at latitude 35°<br />
km<br />
20<br />
Figure 3.16 The present world pattern of<br />
infant mortality rate. The numbers indicate the<br />
number of children per 1000 born who die<br />
before reaching one year of age. The world’s<br />
infant mortality rate is 44. Many experts believe<br />
that this rate is the best single measure of living<br />
standards. (Source: <strong>Population</strong> Reference Bureau.)<br />
Flat Polar Quartic<br />
equal area projection<br />
40<br />
100 80 60 40 20
Mobility 95<br />
Mobility<br />
How does demography relate to the theme<br />
of mobility? After natural increases and<br />
decreases in populations, the second<br />
of the two basic ways in which population<br />
numbers are altered is the migration of people from<br />
one place to another, and it offers a straightforward illustration<br />
of relocation diffusion. When people migrate,<br />
they sometimes bring more than simply their culture;<br />
they can also bring disease. The introduction of diseases<br />
to new places can have dramatic and devastating consequences.<br />
Thus, the spread of diseases is also considered<br />
as part of the theme of mobility because diseases move<br />
with people.<br />
Migration<br />
Humankind is not tied to one locale. Homo sapiens most<br />
likely evolved in Africa, and ever since, we have proved<br />
remarkably able to adapt to new and different physical<br />
environments. We have made ourselves at home in all<br />
but the most inhospitable climates, shunning only such<br />
places as ice-sheathed Antarctica and the shifting sands<br />
of the Arabian Peninsula’s “Empty Quarter.” Our permanent<br />
habitat extends from the edge of the ice sheets to<br />
the seashores, from desert valleys below sea level to high<br />
mountain slopes. This far-flung distribution is the product<br />
of migration.<br />
Early human groups moved in response to the migration<br />
of the animals they hunted for food and the ripening<br />
seasons of the plants they gathered. Indeed, the<br />
40 0 40 80 120 160<br />
80<br />
60 60<br />
40<br />
20<br />
0<br />
20<br />
40<br />
20<br />
0 20 40 60 80 100 120 140 160 180
96 <strong>Chapter</strong> 3 <strong>Population</strong> <strong>Geography</strong><br />
Aztlán<br />
The original home<br />
Atzcapotzalco<br />
(“Place of the anthill“),<br />
stopped four years here<br />
Acalhuacan<br />
(“Place of canoes”),<br />
stopped four years here<br />
Tenochtitlán<br />
(Founded about A.D.1325 )<br />
Figure 3.17 Segments of an Aztec codex, depicting the prehistoric migration of the ancient Aztecs<br />
from an island, possibly in northwestern Mexico, to another island in a lake at the site of present-day<br />
Mexico City, where they founded their capital, Tenochtitlán. Clearly, the epic migration was a central event<br />
in their collective memory. (After de Macgregor, 1984: 217.)<br />
agricultural revolution, whereby humans domesticated crops<br />
and animals and accumulated surplus food supplies, allowed<br />
human groups to stop their seasonal migrations. But why did<br />
certain groups opt for long-distance relocation? Some<br />
migrated in response to environmental collapse, others in<br />
response to religious or ethnic persecution. Still others—<br />
probably the majority, in fact—migrated in search of better<br />
opportunities. For those who migrate, the process generally<br />
ranks as one of the most significant events of their lives. Even<br />
ancient migrations often remain embedded in folklore for<br />
centuries or millennia (Figure 3.17).<br />
The Decision to Move Migration takes place when people<br />
decide that moving is preferable to staying and when the<br />
difficulties of moving seem to be more than offset by the<br />
expected rewards. In the nineteenth century, more than<br />
50 million European emigrants left their homelands in<br />
search of better lives. Today, migration patterns are very<br />
different (Figure 3.18). Europe, for example, now predominantly<br />
receives immigrants rather than sending out emigrants.<br />
International migration stands at an all-time high,<br />
much of it labor migration associated with the process of<br />
globalization. About 160 million people today live outside<br />
the country of their birth.<br />
Historically, and to this day, forced migration also<br />
often occurs. The westward displacement of the Native<br />
American population of the United States; the dispersal of<br />
the Jews from Palestine in Roman times and from Europe<br />
in the mid-twentieth century; the export of Africans to the<br />
Americas as slaves; and the Clearances, or forced removal<br />
of farmers from Scotland’s Highlands to make way for<br />
large-scale sheep raising—all provide depressing examples.<br />
Today, refugee movements are all too common, prompted<br />
mainly by despotism, war, ethnic persecution, and famine.<br />
Recent decades have witnessed a<br />
worldwide flood of refugees: people<br />
who leave their country because<br />
of persecution based on race, ethnicity,<br />
religion, nationality, or political<br />
opinion (note that economic<br />
persecution does not fall under the definition of refugee).<br />
Perhaps as many as 16 million people who live outside their<br />
native country are refugees.<br />
Every migration, from the ancient dispersal of humankind<br />
out of Africa to the present-day movement toward<br />
urban areas, is governed by a host<br />
of push-and-pull factors that act to<br />
make the old home unattractive or<br />
unlivable and the new land attractive.<br />
Generally, push factors are<br />
the most central. After all, a basic<br />
refugees<br />
Those fleeing from persecution<br />
in their country of nationality.<br />
The persecution can be<br />
religious, political, racial, or<br />
ethnic.<br />
push-and-pull factors<br />
Unfavorable, repelling<br />
conditions (push factors) and<br />
favorable, attractive conditions<br />
(pull factors) that interact to<br />
affect migration and other<br />
elements of diffusion.<br />
dissatisfaction with the homeland is prerequisite to voluntary<br />
migration. The most important factor prompting<br />
migration throughout the thousands of years of human<br />
existence has been economic. More often than not, migrating<br />
people seek greater prosperity through better access to<br />
resources, especially land. Both forced migrations and refugee<br />
movements, however, challenge the basic assumption
Mobility 97<br />
From Asia<br />
To U.S.<br />
and Canada<br />
Figure 3.18 Major and minor migration<br />
flows today. Why have these flows changed<br />
so profoundly in the past hundred years?<br />
(Source: <strong>Population</strong> Reference Bureau.)<br />
To Japan<br />
From South<br />
America<br />
From all<br />
SE Asia<br />
Major migration stream<br />
Minor migration stream<br />
of the push-and-pull model, which posits that human<br />
movement is the result of choices.<br />
Diseases on the Move<br />
Throughout history, infectious disease has periodically decimated<br />
human populations. One has only to think of the<br />
vivid accounts of the Black Death episodes that together<br />
killed one-third of medieval Europe’s population to get a<br />
sense of how devastating disease can be. Importantly for<br />
cultural geographers, diseases both move in spatially specific<br />
ways and occasion responses that are spatial in nature.<br />
The spread of disease provides classic illustrations of<br />
both expansion and relocation diffusion. Some diseases are<br />
noted for their tendency to expand outward from their<br />
points of origin. Commonly borne by air or water, the viral<br />
pathogens for contagious diseases such as influenza and<br />
cholera spread from person to person throughout an<br />
affected area. Some diseases spread in a hierarchical diffusion<br />
fashion, whereby only certain social strata are exposed.<br />
The poor, for example, have always been much more exposed<br />
to the unsanitary conditions—rats, fleas, excrement,<br />
and crowding—that have occasioned disease epidemics.<br />
Other illnesses, particularly airborne diseases, affect all<br />
social and economic classes without regard for human hierarchies:<br />
their diffusion pattern is literally contagious.<br />
Indeed, disease and migration have long enjoyed a close<br />
relationship. Diseases have spread and relocated thanks to<br />
human movement. Likewise, widespread human migrations<br />
have occurred as the result of disease outbreaks.<br />
When humans engage in long-distance mobility, their<br />
diseases move along with them. Thus, cholera—a waterborne<br />
disease that had for centuries been endemic to the<br />
Ganges River region of India—broke out in Calcutta (now<br />
called Kolkata) in the early 1800s. Because Calcutta was an<br />
important node in Britain’s colonial empire, cholera quickly<br />
began to relocate far beyond India’s borders. Soldiers, pilgrims,<br />
traders, and travelers spread cholera throughout<br />
Europe, then from port to port across the world through<br />
relocation diffusion, making cholera the first disease of<br />
global proportions.<br />
Early responses to contagious diseases were often spatial<br />
in nature. Isolation of infected people from the healthy population—known<br />
as quarantine—was practiced. Sometimes<br />
only the sick individuals were quarantined, whereas at other<br />
times households or entire villages were shut off from outside<br />
contact. Whole shiploads of eastern European immigrants<br />
to New York City were routinely quarantined in the<br />
late nineteenth century. Another early spatial response was<br />
to flee the area where infection had occurred. During the<br />
time of the plague in fourteenth-century Europe, some<br />
healthy individuals abandoned their ill neighbors, spouses,<br />
and even children. Some of them formed altogether separate<br />
communities, whereas others sought merely to escape<br />
the city walls for the countryside (Figure 3.19, page 98).<br />
Targeted spatial strategies could be implemented once it<br />
became known that some diseases spread through specific<br />
means. The best-known example is John Snow’s 1854 mapping<br />
of cholera outbreaks in London, illustrated in Figure<br />
3.20 (page 98), which allowed him to trace the source of the<br />
infection to one water pump. Thanks to his detective work,<br />
and the development of a broader medical understanding<br />
of the role of germs in the spread of disease, cholera was discovered<br />
to be a waterborne disease that could be controlled<br />
by increasing the sanitary conditions of water delivery.<br />
The threat of deadly disease is hardly a thing of the<br />
past. Today, geographers play vital roles in understanding<br />
the diffusion of HIV/AIDS, SARS (severe acute respiratory
98 <strong>Chapter</strong> 3 <strong>Population</strong> <strong>Geography</strong><br />
Figure 3.19 Fleeing from disease. This woodcut, which was printed in 1630, depicts Londoners<br />
leaving the pestilent city in a cart. In 1665–1666, London experienced the so-called Great Plague, an<br />
outbreak of bubonic plague that killed one-fifth of the city’s population. (Bettmann/Corbis.)<br />
Figure 3.20 Mapping disease. This map was constructed by London physician John Snow. Snow was<br />
skeptical of the notion that “bad air” somehow carried disease. He interviewed residents of the Soho<br />
neighborhood stricken by cholera to construct this map of cholera cases and used it to trace the outbreak<br />
to the contaminated Broad Street pump. Snow is considered to be a founder of modern epidemiology.<br />
(Courtesy of The John Snow Archive.)
Globalization 99<br />
syndrome), and the so-called swine flu in order to better<br />
address outbreaks and halt the spread of these global<br />
scourges. By mapping the spread of these contemporary<br />
diseases, understanding the pathways traveled by their carriers,<br />
and developing appropriate spatial responses, it is<br />
hoped that mass epidemics and disease-related panics can<br />
be avoided.<br />
Globalization<br />
How much is enough? How much is too<br />
much? One of the great debates today<br />
involves the population of the Earth.<br />
How many people can the Earth support?<br />
Should humans limit their reproduction, and who<br />
should decide? There are no precise numbers involved in<br />
this debate, but these questions are so hotly contested because<br />
addressing them in a conscientious way may well determine<br />
the long-term fate of the human race.<br />
<strong>Population</strong> Explosion?<br />
population explosion<br />
The rapid, accelerating<br />
increase in world population<br />
since about 1650 and<br />
especially since about 1900.<br />
One of the fundamental issues of the<br />
modern age is the population explosion:<br />
a dramatic increase in world<br />
population since 1900 (Figure 3.21).<br />
The crucial element triggering this explosion has been a<br />
steep decline in the death rate, particularly for infants and<br />
children, in most of the world, without an accompanying<br />
universal decline in fertility. At one time in traditional cultures,<br />
only two or three offspring in a family of six to eight<br />
children might live to adulthood, but when improved<br />
health conditions allowed more children to survive, the<br />
cultural norm encouraging large families persisted.<br />
Until very recently, the number of people in the world<br />
has been increasing geometrically, doubling in shorter and<br />
shorter periods of time. It took from the beginning of<br />
human history until a.d. 1800 for the Earth’s population<br />
to grow to 1 billion people. But from 1800 to 1930, it grew<br />
to 2 billion, and in only 45 more years it doubled again<br />
(Figure 3.22, page 100). The overall effect of even a few<br />
population doublings is astonishing. As an illustration of a<br />
simple geometric progression, consider the following legend.<br />
A king was willing to grant any wish to the person who<br />
could supply a grain of wheat for the first square of his<br />
chessboard, two grains for the second square, four for<br />
the third, eight for the fourth, and so on. To cover all<br />
64 squares and win, the candidate would have had to present<br />
a cache of wheat larger than today’s worldwide wheat<br />
crop. Looking at the population explosion in another way,<br />
it is estimated that 61 billion humans have lived in the<br />
entire 200,000-year period since Homo sapiens originated. Of<br />
these, 6.8 billion (roughly 10 percent) are alive today. One<br />
12<br />
11<br />
2100<br />
10<br />
<strong>Population</strong> growth (in billions)<br />
9<br />
8<br />
7<br />
6<br />
5<br />
4<br />
Old<br />
Stone<br />
Age New Stone Age Bronze Age<br />
Iron<br />
Age<br />
Modern<br />
Age<br />
Middle<br />
Age<br />
2000<br />
1975<br />
3<br />
2<br />
1<br />
1+ million<br />
years<br />
7000<br />
B.C.<br />
6000<br />
B.C.<br />
5000<br />
B.C.<br />
4000<br />
B.C.<br />
Black Death – The Plague<br />
3000<br />
B.C.<br />
Time<br />
2000<br />
B.C.<br />
1000<br />
B.C.<br />
A.D.<br />
1<br />
1950<br />
1900<br />
1800<br />
A.D.<br />
1000<br />
A.D.<br />
2000<br />
A.D.<br />
3000<br />
A.D.<br />
4000<br />
A.D.<br />
5000<br />
Figure 3.21 S-shaped world<br />
population curve. Is the global<br />
population explosion nearing its end? If<br />
this graph is right, the world’s population<br />
will stabilize at nearly 11 billion by the<br />
year 2100. (Adapted from <strong>Population</strong> Reference<br />
Bureau and United Nations, World <strong>Population</strong><br />
Projections 2100, 1998.)
100 <strong>Chapter</strong> 3 <strong>Population</strong> <strong>Geography</strong><br />
2000<br />
6 billion<br />
6 billion<br />
1987<br />
5 billion<br />
5 billion<br />
<strong>Population</strong><br />
Resources<br />
1975<br />
4 billion<br />
1960<br />
3 billion<br />
1930<br />
2 billion<br />
4 billion<br />
3 billion<br />
2 billion<br />
Quantity<br />
10,000 B.C.<br />
5 million<br />
Year 1A.D.<br />
250 million<br />
1800<br />
1 billion<br />
0<br />
10,000 B.C. 5000 B.C. Year 1A.D. 1000 2000<br />
1 billion<br />
Time<br />
t l<br />
Figure 3.22 World population doubling timeline. This graph illustrates<br />
the ever-faster doubling times of the world’s population. Whereas<br />
accumulating the first billion people took all of human history until about<br />
a.d. 1800, the next billion took slightly more than a century to add, the<br />
third billion took only 30 years, and the fourth took only 15 years. (Adapted<br />
from Sustainablescale.org.)<br />
Figure 3.23 Malthus’s dismal equation. Thomas Malthus based his<br />
theory of population growth on the simple notion that resources (food)<br />
grow in a linear fashion, whereas population grows geometrically.<br />
Beyond time t l<br />
, population outstrips resources, resulting in famine,<br />
conflict, and disease.<br />
of every 10 humans who ever lived on Earth is alive today. If<br />
we were to consider only those humans who survived into<br />
adulthood, the proportion alive today would come closer to<br />
one in five!<br />
Some scholars foresaw long ago that an ever-increasing<br />
global population would eventually present difficulties.<br />
The most famous pioneer observer of population growth,<br />
the English economist and cleric Thomas Malthus, published<br />
An Essay on the Principle of <strong>Population</strong>—known as the<br />
“dismal essay”—in 1798. He believed that the human ability<br />
to multiply far exceeded our ability to increase food<br />
production. Consequently, Malthus maintained that “a<br />
strong and constantly operating check on population”<br />
would necessarily act as a natural control on numbers. Malthus<br />
regarded famine, disease, and war as the inevitable<br />
outcome of the human population’s outstripping the food<br />
supply (Figure 3.23). He wrote, “<strong>Population</strong>, when unchecked,<br />
increases in a geometrical ratio. Subsistence only<br />
increases in an arithmetical ratio. A slight acquaintance<br />
with numbers will show the immensity of the first power in<br />
comparison of the second.”<br />
The adjective Malthusian entered<br />
Malthusian<br />
Those who hold the views of the English language to describe the<br />
Thomas Malthus, who believed dismal future Malthus foresaw. Being<br />
that overpopulation is the root a cleric as well as an economist, however,<br />
Malthus believed that if humans<br />
cause of poverty, illness, and<br />
warfare.<br />
could voluntarily restrain the “passion<br />
between the sexes,” they might avoid their otherwise<br />
miserable fate.<br />
Or Creativity in the Face of Scarcity?<br />
But was Malthus right? From the very first, his ideas were<br />
controversial. The founders of communism, Karl Marx<br />
and Friedrich Engels, blamed poverty and starvation on<br />
the evils of capitalist society. Taking this latter view might<br />
lead one to believe that the miseries of starvation, warfare,<br />
and disease are more the result of maldistribution of the<br />
world’s wealth than of overpopulation. Indeed, severe<br />
food shortages in the late 2000s in several regions point to<br />
precisely this issue of inequitable food distribution and its<br />
catastrophic consequences.<br />
Malthus did not consider that when faced with conundrums<br />
such as scarce food supplies, human beings are highly<br />
creative. This has led critics of Malthus and his modern-day<br />
followers to point out that although the global population<br />
has doubled three times since Malthus wrote his essay, food<br />
supplies have doubled five times. Scientific innovations such<br />
as the green revolution have led to food increases that have<br />
far outpaced population growth (see <strong>Chapter</strong> 8). Other measures<br />
of well-being, including life expectancy, air quality, and<br />
average education levels, have all improved, too. Some of<br />
Malthus’s critics, known as cornucopians,<br />
argue that human beings<br />
are, in fact, our greatest resource<br />
and that attempts to curb our<br />
numbers misguidedly cheat us<br />
out of geniuses who could devise<br />
creative solutions to our resource<br />
cornucopians<br />
Those who believe that science<br />
and technology can solve resource<br />
shortages. In this view,<br />
human beings are our greatest<br />
resource rather than a burden to<br />
be limited.
Globalization 101<br />
neo-Malthusians<br />
Modern day followers of<br />
Thomas Malthus.<br />
shortages. Modern-day followers of<br />
Malthus, known as neo-Malthusians,<br />
counter that the Earth’s support systems<br />
are being strained beyond their capacity by the widespread<br />
adoption of wasteful Western lifestyles.<br />
The fact is that the world’s population is growing more<br />
slowly than before. The world’s TFR has fallen to 2.6; one<br />
demographer has declared that “the population explosion<br />
is over”; and Figure 3.21 (page 99) depicts a leveling-off of<br />
global population at about 11 billion by the year 2100, suggesting<br />
that the world’s current “population explosion” is<br />
merely a stage in a global demographic transition. Relatively<br />
stable population totals worldwide, however, mask<br />
the population declines and aging of the population structure<br />
already under way in some regions of the world.<br />
It is difficult to speculate about the state of the world’s<br />
population beyond the year 2050. What is clear, however, is<br />
that the lifestyles we adopt will affect how many people the<br />
Earth can ultimately support. In particular, whether wealthy<br />
countries continue to use the amount of resources they currently<br />
do, and whether developing countries decide to follow<br />
a Western-style route toward more and more resource<br />
consumption, will significantly determine whether we have<br />
already overpopulated the planet.<br />
The Rule of 72<br />
A handy tool for calculating the doubling time of a population<br />
is called the Rule of 72: take a country’s rate of<br />
annual increase, expressed as a percent, and divide it into<br />
the number 72. The result is the number of years a population,<br />
growing at a given rate, will take to double.<br />
For example, the natural annual growth of the United<br />
States in 2007 was 0.6 percent. Dividing 72 by 0.6 yields<br />
120, which means that the population of the United States<br />
will double every 120 years. This does not, however, factor<br />
in the relatively high levels of immigration experienced by<br />
the United States, which will cause its population to double<br />
faster than every 120 years.<br />
What about countries with faster rates of growth? Consider<br />
Guatemala, which is growing at 2.8 percent per year.<br />
Doing the math, we find that Guatemala’s population is<br />
doubling every 25.7 years!<br />
Percentages such as 0.6 or 2.8 don’t sound like such<br />
high rates. If we were discussing your bank account rather<br />
than the populations of countries, you would hope that your<br />
money would double more quickly than every 25 years!<br />
(Incidentally, you can apply the Rule of 72 to your bank<br />
account or to any other figure that grows at a steady annual<br />
rate.) You may be tempted to say, “Look, there are only 12<br />
million people in Guatemala, so it doesn’t really matter if its<br />
population is doubling quickly. What really matters is that at<br />
an annual increase of 1.7 percent, India’s 1 billion people<br />
will double to 2 billion in 42 years, and China’s 1.3 billion<br />
will double as fast as the U.S. population—every 120 years—<br />
but that will add another 1.3 billion to the world’s population,<br />
more than four times what the United States will add by<br />
doubling!”<br />
This assessment is partly right and partly wrong,<br />
depending on your vantage point. Viewed at the global<br />
scale, it does indeed make a significant difference when<br />
China’s or India’s population doubles. But if you are a resident<br />
of Guatemala or an official of the Guatemalan government,<br />
a doubling of your country’s population every<br />
25 years means that health care, education, jobs, fresh<br />
water, and housing must be supplied to twice as many people<br />
every 25 years. As mentioned in the introduction to this<br />
chapter, the scale at which population questions are asked<br />
is vital for the answers that are given.<br />
<strong>Population</strong> Control Programs<br />
Though the debates may occur at a global scale, most population<br />
control programs are devised and implemented<br />
at the national level. When faced with perceived national<br />
security threats, some governments respond by supporting<br />
pronatalist programs that are designed to increase the<br />
population. Labor shortages in Nordic countries have led to<br />
incentives for couples to have larger families. Most population<br />
programs, however, are antinatalist: they seek to reduce<br />
fertility. Needless to say, this is an easier task for a nonelected<br />
government to carry out because limiting fertility challenges<br />
traditional gender roles and norms about family size.<br />
Although China certainly is not the only country that<br />
has sought to limit its population growth, its so-called onechild<br />
policy provides the best-known modern example.<br />
Mao Zedong, the longtime leader of the People’s Republic<br />
of China (1949–1976), did not initially discourage large<br />
families in the belief that “every mouth comes with two<br />
hands.” In other words, he believed that a large population<br />
would strengthen the country in the face of external political<br />
pressures. He reversed his position in the 1970s when it<br />
became clear that China faced resource shortages as a<br />
result of its burgeoning population. In 1980, the one-childper-couple<br />
policy was adopted. With it, Chinese authorities<br />
sought not merely to halt population growth but, ultimately,<br />
to decrease the national population. All over China<br />
today one sees billboards and posters admonishing the citizens<br />
that “one couple, one child” is the ideal family (Figure<br />
3.24, page 102). Violators face huge monetary fines, cannot<br />
request new housing, lose the rather generous benefits<br />
provided to the elderly by the government, forfeit their<br />
children’s access to higher education, and may even lose<br />
their jobs. Late marriages are encouraged. In response,<br />
between 1970 and 1980, the TFR in China plummeted<br />
from 5.9 births per woman to only 2.7, then to 2.2 by 1990,
102 <strong>Chapter</strong> 3 <strong>Population</strong> <strong>Geography</strong><br />
Figure 3.24 <strong>Population</strong> control in the People’s Republic of China. China has aggressively promoted a policy<br />
of “one couple, one child” in an attempt to relieve the pressures of overpopulation. These billboards convey the<br />
government’s message. Violators—those with more than one child—are subject to fines, loss of job and old-age<br />
benefits, loss of access to better housing, and other penalties. How effective would such billboards be in<br />
influencing people’s decisions? Why is one of the signs in English? (Courtesy of Terry G. Jordan-Bychkov.)<br />
2.0 by 1994, 1.7 by 2007, and 1.5 by 2010 (see Figure 3.3,<br />
pages 76–77).<br />
China achieved one of the greatest short-term reductions<br />
of birthrates ever recorded, thus proving that cultural<br />
changes can be imposed from above, rather than simply<br />
waiting for them to diffuse organically. In recent years, the<br />
Chinese population control program has been less rigidly<br />
enforced as economic growth has eroded the government’s<br />
control over the people. This relaxation has allowed more<br />
couples to have two children instead of one; however, the<br />
increase in economic opportunity and migration to cities<br />
have led some couples to have smaller families voluntarily.<br />
Because of China’s population size, its actions will greatly<br />
affect the global context as well as its own national one (see<br />
Subject to Debate on page 87 for a discussion of the gender<br />
implications of strict population control policies).<br />
Reflecting on <strong>Geography</strong><br />
Would a global population control policy be desirable or even feasible?<br />
Nature-Culture<br />
Why do human populations form such<br />
a diverse mosaic? The reasons are often<br />
cultural. Though the differences<br />
may have started out as adaptations to<br />
given physical conditions, when repeated from generation<br />
to generation these patterns become woven tightly into the<br />
cultural fabric of places. Thus, demographic practices such<br />
as living in crowded settlements or having large families<br />
may well have deep roots in both nature and culture.<br />
Environmental Influence<br />
Local population characteristics are often influenced in a<br />
possibilistic manner by the availability of resources. In the<br />
middle latitudes, population densities tend to be greatest<br />
where the terrain is level, the climate is mild and humid,<br />
the soil is fertile, mineral resources are abundant, and the<br />
sea is accessible. Conversely, population tends to thin out<br />
with excessive elevation, aridity, coldness, ruggedness of<br />
terrain, and distance from the coast.<br />
Climatic factors influence where people settle. Most of<br />
the sparsely populated zones in the world have, in some<br />
respect, “defective” climates from the human viewpoint (see<br />
Figure 3.1, pages 72–73). The thinly populated northern<br />
edges of Eurasia and North America are excessively cold,<br />
and the belt from North Africa into the heart of Eurasia<br />
matches the major desert zones of the Eastern Hemisphere.<br />
Humans remain creatures of the humid and subhumid<br />
tropics, subtropics, or midlatitudes and have not fared well<br />
in excessively cold or dry areas. Small populations of Inuit<br />
(Eskimo), Sami (Lapps), and other peoples live in some of<br />
the less hospitable areas of the Earth, but these regions do<br />
not support large populations. Humans have proven remarkably<br />
adaptable, and our cultures contain strategies that allow<br />
us to live in many different physical environments; as a species,<br />
however, perhaps we have not entirely moved beyond
Nature-Culture 103<br />
the adaptive strategies that suited us so well to the climatic<br />
features of sub-Saharan Africa, where we began.<br />
Humankind’s preference for lower elevations is especially<br />
true for the middle and higher latitudes. Most mountain<br />
ranges in those latitudes stand out as sparsely populated<br />
regions. By contrast, inhabitants of the tropics often prefer<br />
to live at higher elevations, concentrating in dense clusters<br />
in mountain valleys and basins (see Figure 3.1). For example,<br />
in tropical portions of South America, more people live<br />
in the Andes Mountains than in the nearby Amazon lowlands.<br />
The capital cities of many tropical and subtropical<br />
nations lie in mountain areas above 3000 feet (900 meters)<br />
in elevation. Living at higher elevations allows residents to<br />
escape the hot, humid climate and diseases of the tropic lowlands.<br />
In addition, these areas were settled because the fertile<br />
volcanic soils of these mountain valleys and basins were<br />
able to support larger populations in agrarian societies.<br />
Humans often live near the sea. The continents of Eurasia,<br />
Australia, and South America resemble hollow shells,<br />
with the majority of the population clustered around the<br />
rim of each continent (see Figure 3.1). In Australia, half<br />
the total population lives in only five port cities, and most of<br />
the remainder is spread out over nearby coastal areas. This<br />
preference for living by the sea stems partly from the trade<br />
and fishing opportunities the sea offers. At the same time,<br />
continental interiors tend to be regions of climatic extremes.<br />
For example, Australians speak of the “dead heart” of their<br />
continent, an interior land of excessive dryness and heat.<br />
Disease also affects population distribution. Some diseases<br />
attack valuable domestic animals, depriving people of<br />
food and clothing resources. Such diseases have an indirect<br />
effect on population density. For example, in parts of East<br />
Africa, a form of sleeping sickness attacks livestock. This particular<br />
disease is almost invariably fatal to cattle but not to<br />
humans. The people in this part of East Africa depend heavily<br />
on cattle, which provide food, represent wealth, and serve<br />
a religious function in some tribes. The spread of a disease<br />
fatal to cattle has caused entire tribes to migrate away from<br />
infested areas, leaving those areas unpopulated.<br />
Environmental Perception<br />
and <strong>Population</strong> Distribution<br />
Perception of the physical environment plays a major role<br />
in a group’s decision about where to settle and live. Different<br />
cultural groups often “see” the same physical environment<br />
in different ways. These varied responses to a single<br />
environment influence the distribution of people. A good<br />
example appears in a part of the European Alps shared<br />
by German- and Italian-speaking peoples. The mountain<br />
ridges in that area—near the point where Switzerland,<br />
Italy, and Austria border one another—run in an east-west<br />
direction, so that each ridge has a sunny, south-facing slope<br />
and a shady, north-facing one. German-speaking people,<br />
who rely on dairy farming, long ago established permanent<br />
settlements some 650 feet (200 meters) higher on<br />
the shady slopes than the settlements of Italians, who are<br />
culturally tied to warmth-loving crops, on the sunny slopes.<br />
This example demonstrates how contrasting cultural attitudes<br />
toward the physical environment and land use affect<br />
settlement patterns.<br />
Sometimes, the same cultural group changes its perception<br />
of an environment over time, with a resulting redistribution<br />
of its population. The coalfields of western Europe<br />
provide a good case in point. Before the industrial age, many<br />
coal-rich areas—such as the Midlands of England, southern<br />
Wales, and the lands between the headwaters of the Oder (or<br />
Odra) and Vistula rivers in Poland—were only sparsely or<br />
moderately settled. The development of steam-powered<br />
engines and the increased use of coal in the iron-smelting<br />
process, however, created a tremendous demand. Industries<br />
grew up near the European coalfields, and people flocked to<br />
these areas to take advantage of the new jobs. In other words,<br />
once a technological development gave a new cultural value<br />
to coal, many sparsely populated areas containing that resource<br />
acquired large concentrations of people.<br />
Recent studies indicate that much of the interregional<br />
migration in the United States today is prompted by a desire<br />
for a pleasant climate and other desirable physical environmental<br />
traits, such as beautiful scenery. Surveys of immigrants<br />
to Arizona revealed that its sunny, warm climate is a<br />
major reason for migration. An attractive environment provided<br />
the dominant factor in the growth of the population<br />
and economy of Florida. The most desirable environmental<br />
traits that serve as stimulants for American migration include<br />
(1) mild winter climate and mountainous terrain, (2) a<br />
diverse natural vegetation that includes forests and a mild<br />
summer climate with low humidity, (3) the presence of lakes<br />
and rivers, and (4) nearness to the seacoast. Different age<br />
and cultural groups often express different preferences, but<br />
all are influenced by their perceptions of the physical environment<br />
in making decisions about migration.<br />
Reflecting on <strong>Geography</strong><br />
What is your ideal climate? Do you now live in a place with such a<br />
climate? If not, do you eventually intend to migrate for this reason?<br />
<strong>Population</strong> Density and Environmental<br />
Alteration<br />
People modify their habitats through their adaptive strategies.<br />
Particularly in areas where population density is high,<br />
radical alterations often occur. This can happen in fragile<br />
environments even at relatively low population densities<br />
because, as discussed earlier in this chapter, the Earth’s
104 <strong>Chapter</strong> 3 <strong>Population</strong> <strong>Geography</strong><br />
carrying capacity varies greatly from one place to another<br />
and from one culture to another.<br />
Many of our adaptive strategies are not sustainable.<br />
<strong>Population</strong> pressures and local ecological crises are closely<br />
related. For example, in Haiti, where rural population<br />
pressures have become particularly severe, the trees in previously<br />
forested areas have been stripped for fuel, leaving<br />
the surrounding fields and pastures increasingly denuded<br />
and vulnerable to erosion (Figure 3.25). In short, overpopulation<br />
relative to resource availability can precipitate environmental<br />
destruction—which, in turn, results in a<br />
downward cycle of worsening poverty, with an eventual<br />
catastrophe that is both ecological and demographic.<br />
Thus, many cultural ecologists believe that attempts to<br />
restore the balance of nature will not succeed until we halt<br />
or even reverse population growth, although they recognize<br />
that other causes are also at work in ecological crises.<br />
The worldwide ecological crisis is not solely a function<br />
of overpopulation. A relatively small percentage of the<br />
Earth’s population controls much of the industrial technology<br />
and consumes a disproportionate percentage of the<br />
world’s resources each year. Americans, who make up less<br />
than 5 percent of the global population, account for about<br />
25 percent of the natural resources consumed globally each<br />
year. New houses built in the United States in 2002 were, on<br />
average, 38 percent bigger than those built in 1975, despite<br />
a shrinking average household size. If everyone in the world<br />
had an average American standard of living, the Earth could<br />
support only about 500 million people—only 8 percent of<br />
the present population. As the economies of large countries<br />
such as India and China continue to surge, the resource<br />
Figure 3.25 Overpopulation and deforestation. This aerial<br />
photograph depicts the border between Haiti and the Dominican<br />
Republic. Both nations share the Caribbean island of Hispaniola.<br />
<strong>Population</strong> pressures in Haiti, on the left side of the photograph, have<br />
led to deforestation; the Dominican Republic is the greener area to the<br />
right. The political border is also an environmental border. (NASA.)<br />
consumption of their populations is likely to rise as well<br />
because the human desire to consume appears to be limited<br />
only by the ability to pay for it. Indeed, in mid-2010, China<br />
surpassed the United States to become the world’s largest<br />
consumer of energy resources.<br />
Cultural<br />
LANDSCAPE<br />
What are the many ways in which demographic<br />
factors are expressed in the<br />
cultural landscape? <strong>Population</strong> geographies<br />
are visible in the landscapes around us. The varied<br />
densities of human settlements and the shapes these take<br />
in different places provide clues to the intertwined cultural<br />
and demographic strategies implemented in response to diverse<br />
local factors. These clues are evident wherever people<br />
have settled, be they urban, suburban, or rural locations.<br />
Less visible, but no less important, factors are also at work on<br />
and throughout the cultural landscape. In this final part of<br />
the chapter we examine the diverse, and often creative, ways<br />
in which different places are organized spatially in order to<br />
accommodate the populations that live there.<br />
Diverse Settlement Types<br />
Human settlements range in density from the isolated farmsteads<br />
found in some rural areas to the teeming streets of<br />
megacities such as Kolkata, India (see Seeing <strong>Geography</strong>,<br />
page 112). The size and pattern of human settlements depend<br />
in part on the size and needs of the population to be<br />
accommodated. Small rural populations and those engaged<br />
in subsistence farming don’t inhabit large, dense cities. Nomadic<br />
peoples require dwellings that can be easily packed up<br />
and moved, and they tend to have few household possessions<br />
(Figure 3.26). On the other end of the spectrum, dense cities<br />
make more sense for populations employed in the service<br />
and information sectors. These people benefit from being as<br />
close as possible to their jobs, and higher densities—at least<br />
in theory—reduce commuting distances. People in postindustrial<br />
societies also tend to have smaller families, which can be<br />
more easily accommodated in apartments (Figure 3.27).
Cultural Landscape 105<br />
FIgure 3.26 Nomadic family moving<br />
on. These Mongol herders are nomadic;<br />
they move often in search of the best<br />
pasture for their livestock. Here, a family<br />
packs their yurt, a traditional Mongolian<br />
tent structure, and their few household<br />
possessions. (Bruno Morandi/The Image Bank/<br />
Getty Images.)<br />
But there is also a significant cultural aspect at work,<br />
such that similar populations may live in settlements that<br />
look and feel vastly different from each other. Take rural<br />
settlements, for instance.<br />
In many parts of the world, farming people group themselves<br />
together in clustered settlements called farm villages.<br />
These tightly bunched settlements vary in size from a few<br />
dozen inhabitants to several thousand. Contained in the<br />
village farmstead are the house, barn,<br />
sheds, pens, and garden. The fields, pastures,<br />
and meadows lie out in the country<br />
beyond the limits of the village, and farmers<br />
must journey out from the village each<br />
day to work the land.<br />
Farm villages are the most common<br />
form of agricultural settlement in much<br />
farm villages<br />
Clustered rural settlements of<br />
moderate size, inhabited by<br />
people who are engaged in<br />
farming.<br />
farmstead<br />
The center of farm operations,<br />
containing the house, barn,<br />
sheds, and livestock pens.<br />
Figure 3.27 High-density dwelling in<br />
Amsterdam. The Borneo-Sporenburg<br />
development provides high-density,<br />
low-rise housing to accommodate<br />
Holland’s small families in an urban<br />
setting. Instead of yards, these dwellings<br />
feature rooftop terraces. The waterfront<br />
also provides a kind of “green space” for<br />
residents, who tie their boats up in front of<br />
their houses. (© Iain Masterton/Alamy.)
106 <strong>Chapter</strong> 3 <strong>Population</strong> <strong>Geography</strong><br />
of Europe, in many parts of Latin America, in the densely<br />
settled farming regions of Asia (including much of India,<br />
China, and Japan), and among the sedentary farming peoples<br />
of Africa and the Middle East.<br />
In many other parts of the world, the rural population<br />
lives on dispersed, isolated farmsteads, often some distance<br />
from the nearest neighbors (Figure 3.28). These dispersed<br />
rural settlements grew up mainly in Anglo America, Australia,<br />
New Zealand, and South Africa—that is, in the lands<br />
colonized by emigrating Europeans.<br />
Why do so many farm people settle together in villages?<br />
Historically, the countryside was unsafe, threatened<br />
by roving bands of outlaws and raiders. Farmers could better<br />
defend themselves against such dangers by grouping<br />
together in villages. In many parts of the world, the populations<br />
of villages have grown larger during periods of insecurity<br />
and shrunk again when peace returned. Many farm<br />
villages occupy the most easily defended sites in their vicinity,<br />
what geographers call strong-point settlements.<br />
In addition to concerns about defense, the quality of<br />
the environment helps determine whether people settle<br />
in villages. In deserts and in limestone areas, where the<br />
ground absorbs moisture quickly, farmsteads are built<br />
around the few sources of water. Such wet-point villages cluster<br />
around oases or deep wells. Conversely, a superabundance<br />
of water—in marshes, swamps, and areas subject to<br />
floods—often prompts people to settle in villages on available<br />
dry points at higher elevations.<br />
Figure 3.28 A truly isolated farmstead, in the Vesturland region of western<br />
Iceland. This type of rural settlement dominates almost all lands colonized by Europeans<br />
who migrated overseas. Iceland was settled by Norse Vikings a thousand years ago.<br />
(© Jay Dickman/Corbis.)<br />
Various communal ties strongly bind villagers together.<br />
Farmers linked to one another by blood relationships, religious<br />
customs, communal landownership, or other similar<br />
bonds usually form clustered villages. Mormon farm villages<br />
in the United States provide an excellent example of the<br />
clustering force of religion. Communal or state ownership<br />
of the land—as in China and parts of Israel—encourages<br />
the formation of farm villages.<br />
The conditions encouraging dispersed settlement are<br />
precisely the opposite of those favoring village development.<br />
These include peace and security in the countryside,<br />
eliminating the need for defense; colonization by<br />
individual pioneer families rather than by socially cohesive<br />
groups; private agricultural enterprise, as opposed to some<br />
form of communalism; and well-drained land where water<br />
is readily available. Most dispersed farmsteads originated<br />
rather recently, dating primarily from the colonization of<br />
new farmland in the past two or three centuries.<br />
Reflecting on <strong>Geography</strong><br />
What challenges might a settlement pattern of isolated farmsteads<br />
present for the people who live there?<br />
Landscapes and Demographic Change<br />
<strong>Population</strong> change in a place can occur rapidly or more<br />
slowly over time. Rapid depopulation<br />
can come about as the result of a decrease in population that<br />
depopulation<br />
sudden catastrophic sometimes occurs as the result<br />
events, such as natural<br />
disasters, disease such as natural disasters,<br />
of sudden catastrophic events,<br />
disease epidemics, and warfare.<br />
epidemics, and warfare<br />
(Figure 3.29). Or depopulation can take<br />
place at a slower pace. For example, places<br />
may lose population over time because of the<br />
gradual out-migration of people in search of<br />
opportunities elsewhere, as a cumulative result<br />
of declining fertility rates, or as a response<br />
to climate change.<br />
<strong>Population</strong>s can also grow in more or less<br />
rapid fashions. A place might experience an<br />
abrupt influx of people who have been displaced<br />
from other areas. <strong>Population</strong> increases<br />
commonly occur more gradually, as the result<br />
of demographic improvements such as longer<br />
life spans or lower infant mortality rates,<br />
or the accumulation of steady streams of immigrants<br />
to attractive areas over time.<br />
Depopulation in one area and population<br />
increase in another are often linked<br />
processes. For instance, you could easily envision<br />
a scenario in which the same natural<br />
disaster victims exiting one place become
Cultural Landscape 107<br />
Figure 3.29 Refugees flee fighting<br />
in eastern Congo. This area of the<br />
Democratic Republic of Congo, near the<br />
Rwandan border, has experienced the<br />
repeated movement of people displaced<br />
by civil strife. (Stephen Morrison/epa/Corbis.)<br />
the refugees suddenly flooding into a neighboring area.<br />
As a longer-term example, you could equally well imagine<br />
how broad economic changes or technological innovations<br />
could lead to regional population shifts whereby some<br />
areas become depopulated and others gain population.<br />
Indeed, shifting economic and technological conditions<br />
have influenced the demographic landscape in profound<br />
ways. The process of industrialization during the<br />
past 200 years has caused the greatest voluntary relocation<br />
of people in world history. Within industrial nations,<br />
people moved from rural areas to cluster in manufacturing<br />
regions (see <strong>Chapter</strong> 10). Agricultural changes have<br />
also influenced population density. For example, the complete<br />
mechanization of cotton and wheat cultivation in midtwentieth-century<br />
America allowed those crops to be raised<br />
by a much smaller labor force (see <strong>Chapter</strong> 8). As a result,<br />
profound depopulation occurred, to the extent that many<br />
small towns serving these rural inhabitants ceased to exist.<br />
Regardless of the reasons, population changes must<br />
be accommodated, and these adaptations are invariably reflected<br />
in the cultural landscape.<br />
Depopulation in History: Ancient Rome There are as many<br />
theories accounting for the decline of the Roman Empire<br />
as there are historians theorizing about it. Lead poisoning,<br />
overextension of the empire’s reach, conquest by Germanic<br />
tribes, and at least 200 other theories have been proposed.<br />
Rome, the empire’s capital city, suffered this process<br />
acutely. For nearly a millennium, Rome had been the<br />
world’s wealthiest, most powerful, and most populous<br />
city (Figure 3.30, page 108). At the close of the first century<br />
a.d., Rome’s population surpassed 1 million. As the<br />
Roman Empire’s economic, political, and military might<br />
waned across the third, fourth, and fifth centuries, the<br />
demographic balance shifted as well. Under the emperor<br />
Constantine in a.d. 330, the empire was split into eastern<br />
and western halves, and its capital was relocated to Constantinople<br />
(now Istanbul, in modern-day Turkey).<br />
As barbarian invasions further weakened the divided<br />
empire, Rome’s physical infrastructure—its famed roads,<br />
bridges, aqueducts, and monumental buildings—crumbled,<br />
as did its impressive administrative infrastructure.<br />
With no access to former amenities, from running water to<br />
educational opportunities, Rome’s population had shrunk<br />
to around 20,000 by a.d. 550. The Roman landscape had<br />
become a ghost of its former glory: dilapidated, uninhabited,<br />
and in ruins (see Figure 3.30).<br />
Bogotá Rising Dilapidated-looking landscapes can result<br />
from population decline, as the previous example of ancient<br />
Rome illustrates, but they can also arise from rapid<br />
population influx. Many of the world’s shantytowns exemplify<br />
the sort of chaotic landscape that can result from<br />
rapid population increases. Los Altos de Cazucá, a neighborhood<br />
in the Colombian capital of Bogotá, is but one<br />
example. In this case, the population influx comes mostly<br />
from people arriving in the capital after being displaced by<br />
armed conflict in the countryside.
108 <strong>Chapter</strong> 3 <strong>Population</strong> <strong>Geography</strong><br />
Figure 3.30 Rome at its height and Rome in ruins. The image on the left, from a nineteenth-century engraving,<br />
shows Rome at its height, as seen from Mt. Palatine, one of Rome’s seven hills. The image on the right, from a<br />
nineteenth-century painting, shows the ruins of the Roman Forum from the Capitoline Hill, another of Rome’s seven<br />
hills. (Both photos: The Granger Collection, New York/The Granger Collection.)<br />
The United Nations High Commissioner for Refugees<br />
(UNHCR) estimates that, by 2009, there were 26 million<br />
internally displaced persons (IDPs) due to armed conflict<br />
worldwide. Colombia is one of the globe’s hotspots for<br />
IDPs, alongside Sudan. Colombia’s estimated 5 million<br />
IDPs have been uprooted largely as the result of ongoing<br />
civil warfare between the paramilitary group known as the<br />
FARC (Revolutionary Armed Forces of Colombia) and government<br />
forces bent on eradicating them. The UNHCR<br />
has identified this as the “worst humanitarian crisis in the<br />
western hemisphere.”<br />
Colombia’s armed conflict has depopulated the rural<br />
areas where it occurs, forcing its victims into the cities.<br />
Terrorized, landless, and impoverished, the mainly indigenous<br />
and Afro-Colombian IDPs settle in the outskirts of<br />
cities like Colombia’s capital, Bogotá.<br />
Los Altos de Cazucá is one of the settlements inhabited<br />
by Colombia’s internally displaced persons (Figure<br />
3.31). Known as shantytowns, areas like Los Altos de Cazucá<br />
arise for different reasons, but they exist in all large<br />
cities throughout the developing world. Housing is constructed<br />
by the residents themselves, using found materials<br />
like cardboard, tin panels, and old tires. Some shantytowns<br />
are located far away from downtown areas where<br />
wealthy people reside and where jobs are, while others are<br />
Figure 3.31 Los Altos de Cazucá. This is a shantytown on the<br />
outskirts of Colombia’s capital city, Bogotá. Many of its approximately<br />
50,000 residents are displaced people from other parts of the country.<br />
(imagebroker.net/SuperStock.)
Cultural Landscape 109<br />
Figure 3.32 Landscapes of poverty and wealth.<br />
This scene from Bogotá is a common Latin American<br />
urban landscape, with wealthy high-rises located<br />
next to impoverished shantytowns. (Victor Englebert.)<br />
literally pressed up against wealthier neighborhoods (Figure<br />
3.32).<br />
Most shantytowns arise spontaneously, in order to address<br />
population influx to cities that lack the resources to<br />
plan systematically for rapid growth. But are shantytowns<br />
temporary, disappearing as their residents become incorporated<br />
into city life? Hardly. Instead, shantytowns gradually<br />
become part of the urban fabric. Indeed, most of the spatial<br />
expansion of Latin American cities like Bogotá occurs<br />
precisely thanks to growth of the shantytowns surrounding<br />
them. Over time, the dwellings are constructed of morepermanent<br />
materials such as concrete blocks. Roads are<br />
paved and running water installed. Power and phone lines<br />
are extended. The once-temporary areas slowly become<br />
visually, economically, and culturally integrated into the<br />
permanent fabric of the city. New shantytowns then arise<br />
beyond their borders, to accommodate recent arrivals.<br />
Reflecting on <strong>Geography</strong><br />
Many cities in the United States have seen shantytowns arise in the<br />
wake of the home foreclosure crisis of the late 2000s. Are these<br />
comparable to Los Altos de Cazucá? In what significant ways are<br />
they similar, and in what ways are they different? (Figure 3.33)<br />
Figure 3.33 Mortgage foreclosure<br />
tent city in Reno, Nevada. Nevada was<br />
one of the hardest-hit states during the<br />
economic crisis in which many people<br />
lost their jobs and their homes; some<br />
even became homeless. Similar tent<br />
cities could be found in many U.S.<br />
cities in the late 2000s. (Max Whittaker/<br />
Getty Images.)
110 <strong>Chapter</strong> 3 <strong>Population</strong> <strong>Geography</strong><br />
CONCLUSION<br />
In our study of population geography, we have seen that<br />
humankind is unevenly distributed over the Earth. Spatial<br />
variations in fertility, death rates, rates of population<br />
change, age groups, gender ratios, and standards of living<br />
also exist: these patterns can be depicted as demographic<br />
culture regions. The principles of mobility prove useful<br />
in analyzing human migration and also help explain the<br />
spread of factors influencing demographic characteristics<br />
such as disease.<br />
<strong>Population</strong> geography proves particularly intriguing<br />
when scale is taken into account. Although most geodemographic<br />
issues are experienced locally, and policies shaping<br />
them are usually set at the national level, the important<br />
debates about the world’s population are truly global in<br />
nature.<br />
The theme of nature-culture shows how the natural<br />
environment and people’s perception of and engagement<br />
with it influence demographic factors. Nature-culture<br />
interactions shape the spatial distribution of people and<br />
sometimes help guide migrations. In addition, population<br />
density is linked to the level of environmental alteration,<br />
and overpopulation can have a destructive impact on the<br />
environment.<br />
The cultural landscape visually expresses the varied<br />
ways in which societies accommodate their populations.<br />
How people distribute themselves over the Earth’s surface<br />
finds a vivid expression in the cultural landscape. The look<br />
and feel of places are constantly adapting to demographic<br />
change.<br />
closeness expected in their dealings. Such closeness might well be<br />
interpreted as overstepping one’s bounds, literally, in the United States!<br />
In this exercise, you will gather some data on the amount of personal<br />
space needed by those around you. Observe and record your<br />
findings, and discuss them in class as a group.<br />
Steps to Understanding Personal Space<br />
Step 1: Observe your professors as they lecture in class. Is your class<br />
a large one that meets in a lecture hall? If so, where does<br />
your professor sit or stand in relation to the students? Does<br />
the professor have his or her own designated space in the<br />
classroom? Where is it located, and how big is it? Does the<br />
professor ever step outside of it? How does this professor’s<br />
use of space compare to that of other professors you have,<br />
and why do you think this is so? If you have a smaller class,<br />
DOING GEOGRAPHY<br />
Public Space, Personal Space: Too Close for Comfort?<br />
Culture can condition people to accept or reject crowding. Personal<br />
space—the amount of space that individuals feel “belongs” to them<br />
as they move about their everyday business—varies from one cultural<br />
group to another. As the Seeing <strong>Geography</strong> section for this chapter notes,<br />
different people seem to require different amounts of personal space.<br />
One’s comfort zone varies with social class, gender, ethnicity, the situation<br />
at hand, and what one has grown accustomed to over one’s life.<br />
Some Arabs, for example, consider it appropriate and even polite to be<br />
close enough for another to smell his or her breath during conversation.<br />
Those from cultures that have not developed a high tolerance for personal<br />
contact might experience such closeness as intrusive. Americans<br />
conducting business in Japan are often surprised at the level of physical<br />
<strong>Population</strong> densities in parks. These two images depict similarly<br />
designed public playgrounds featuring a large sandbox. The park<br />
on the top is located in Minnesota in the United States; the park on<br />
the bottom is located in Taipei, Taiwan. Where would you rather<br />
play? Why? (Top: James Shaffer/PhotoEdit; Bottom: Christian Klein/Alamy.)
<strong>Population</strong> <strong>Geography</strong> on the Internet 111<br />
compare the use of space by that professor. Is it different<br />
from the behavior of the professors in large lecture halls?<br />
Under what circumstances, if any, do your professors get<br />
close to students, and how close do they get?<br />
Step 2: How close can you get to friends? Strike up a conversation<br />
with a same-gender friend standing next to you. Discreetly<br />
move closer and closer to your friend until he or she moves<br />
away or says something about your proximity. How much<br />
space separated you when this happened? What do you<br />
think would happen if you tried this with a stranger? With a<br />
friend or a stranger of a different gender? With a friend or a<br />
stranger from a different culture?<br />
Step 3: Discuss your findings. Did all your classmates have similar<br />
experiences, or were your findings notably different?<br />
Are all students in your class from similar economic or<br />
ethnic backgrounds? If not, that may explain some of the<br />
differences that emerge.<br />
There has been some talk lately about the future of the everhuger<br />
“McMansions” and sprawling suburban developments that for<br />
several decades have characterized middle-class life in the United<br />
States. Clearly, both waste resources. McMansions are expensive to<br />
heat and cool, and their landscaping is often out-of-step with the local<br />
environment. Living in a suburb often means commuting long distances<br />
to jobs or school, in cars occupied by just one or two people. But<br />
think, too, about the proxemics involved and consider these questions:<br />
Key Terms<br />
• Is there such a thing as too much space?<br />
• Do you know or have you heard of people who have opted<br />
out of living large in the ’burbs? Why do you think they made<br />
this decision?<br />
• In what ways do planners and architects take culturally<br />
diverse preferences about personal space into account when<br />
they design cities, streets, buildings, homes, and classrooms?<br />
carrying capacity p. 74<br />
cornucopians p. 100<br />
demographic transition p. 77<br />
depopulation p. 106<br />
Eurocentric p. 79<br />
farmstead p. 105<br />
farm villages p. 105<br />
gender roles p. 86<br />
geodemography p. 71<br />
infant mortality rate p. 88<br />
Malthusian p. 100<br />
neo-Malthusians p. 101<br />
population density p. 72<br />
population explosion p. 99<br />
population geography p. 71<br />
population pyramid p. 84<br />
proxemics p. 112<br />
push-and-pull factors p. 96<br />
refugees p. 96<br />
sex ratio p. 85<br />
total fertility rate (TFR) p. 75<br />
zero population growth p. 75<br />
<strong>Population</strong> <strong>Geography</strong> on the Internet<br />
You can learn more about population geography on the<br />
Internet at the following web sites:<br />
<strong>Population</strong> Reference Bureau, Inc., Washington, D.C.<br />
http:// www.prb.org<br />
This organization is concerned principally with<br />
overpopulation and standard of living. The “World<br />
<strong>Population</strong> Data Sheet” provides up-to-date basic<br />
demographic information at a glance, and the<br />
“Datafinder” section has a wealth of images on all aspects<br />
of global population for use in presentations and reports.<br />
Some of the maps in this chapter were adapted from<br />
PRB maps.<br />
United Nations High Commissioner for Refugees<br />
http:// www.unhcr.org<br />
This United Nations web site provides basic information<br />
about refugee situations worldwide. The site includes<br />
regularly updated maps showing refugee locations and<br />
populations as well as photos of refugee life.<br />
U.S. Census Bureau <strong>Population</strong> Clocks<br />
http:// www.census.gov/main/www/popclock.html<br />
Check real-time figures here for the population of the<br />
United States and the population of the world. The<br />
main web site, http://www.census.gov, hosts the most<br />
important and comprehensive data sets available on the<br />
U.S. population.<br />
World Health Organization, Geneva, Switzerland<br />
http:// www.who.int/en<br />
Learn about the group that distributes information on<br />
health, mortality, and epidemics as it seeks to improve<br />
health conditions around the globe. The “Global Health<br />
Atlas” allows you to create detailed maps from WHO data.<br />
Worldwatch Institute, Washington, D.C.<br />
http:// www.worldwatch.org<br />
This organization is concerned with the ecological<br />
consequences of overpopulation and the wasteful use of<br />
resources. It seeks sustainable ways to support the world’s<br />
population and brings attention to ecological crises.
112 <strong>Chapter</strong> 3 <strong>Population</strong> <strong>Geography</strong><br />
seeing geography Street in Kolkata, India<br />
Would you feel comfortable walking here? If not, why not?<br />
A street scene in the large city of Kolkata, India.<br />
Do you need your “personal space”? Most Americans<br />
and Canadians do. If so, Kolkata (formerly Calcutta),<br />
India, is a place you might want to avoid. West Bengal<br />
state, where Kolkata is located, has the highest population<br />
density in the country.<br />
Why do people form such dense clusters? The theme<br />
of cultural interaction would tell us of push factors that<br />
encourage people to leave their farms and move to the city.<br />
Some can no longer make a living or feed their families<br />
with the food provided by the tiny plots of land they work.<br />
Others are forced off the land by landlords who want to<br />
convert their farms to use mechanized Western methods of<br />
agriculture that use far less labor (see <strong>Chapter</strong> 8). But<br />
cultural interaction also tells us of pull factors exerted by<br />
cities such as Kolkata—the hope or promise of betterpaying<br />
jobs, the encouragement of friends and relatives<br />
who came to the city earlier, or the greater availability of<br />
government services. And so, pushed and pulled, they<br />
come to the teeming, overcrowded city, to jostle and elbow<br />
their way through the streets.<br />
But it is not only cities in the developing world that<br />
become so dense. If you have ever visited, or lived in,<br />
Manhattan, New York, you are all too familiar with dense<br />
crowds of people. In fact, there are some who grow up in<br />
these environments and find that the relative solitude of<br />
rural areas verges on terrifying. They prefer the bustle of<br />
activity and the sounds of the city, and they feel at home in<br />
a crowd.<br />
Being a woman is another reason that you might feel<br />
uncomfortable in this Kolkata street environment. Notice<br />
the nearly complete absence of women in this crowd. Many<br />
societies have strict norms that dictate where women, and<br />
men, may and may not go. Harassment or even violence<br />
may be the result of violating these norms.<br />
The study of the size and shape of people’s envelopes of<br />
personal space is called proxemics.<br />
Anthropologist Edward T. Hall,<br />
whose book The Hidden Dimension is<br />
listed in Ten Recommended Books<br />
proxemics<br />
The study of the size and<br />
shape of people’s envelopes<br />
of personal space.<br />
on <strong>Population</strong> <strong>Geography</strong> at the end of the chapter, is the<br />
founder of this science. Urban planners, architects,<br />
psychologists, and sociologists, as well as geographers, use<br />
proxemics to explain why some people need more space<br />
than others and how this varies culturally.<br />
Sources<br />
Coclanis, Peter. 2010. “Russia’s Demographic Crisis and Gloomy<br />
Future,” The Chronicle of Higher Education, 19 February, pp. B9<br />
– B11.<br />
de Macgregor, María T. de Gutiérrez. 1984. “<strong>Population</strong> <strong>Geography</strong><br />
in Mexico,” in John J. Clarke (ed.), <strong>Geography</strong> and <strong>Population</strong>.<br />
Oxford: Pergamon.<br />
D’Emilio, Frances. 2004. “Italy’s Seniors Finding Comfort with<br />
Strangers,” Miami Herald, 30 October, pp. 1A–2A.<br />
Gould, Peter. 1993. The Slow Plague: A <strong>Geography</strong> of the AIDS Pandemic.<br />
Oxford: Blackwell.<br />
Hooper, Edward. 1999. The River: A Journey to the Source of HIV and<br />
AIDS. Boston: Little, Brown.<br />
Malthus, Thomas R. 1989 [1798]. An Essay on the Principle of <strong>Population</strong>.<br />
Patricia James (ed.). Cambridge: Cambridge University<br />
Press.<br />
Paul, Bimal K. 1994. “AIDS in Asia.” Geographical Review 84:<br />
367–379.
Journals in <strong>Population</strong> <strong>Geography</strong> 113<br />
Shannon, Gary W., Gerald F. Pyle, and Rashid L. Bashshur. 1991.<br />
The <strong>Geography</strong> of AIDS: Origins and Course of an Epidemic. New<br />
York: Guilford.<br />
Rosin, Hanna. 2010. “The End of Men.” Atlantic Monthly, July/<br />
August. Available online at http://www.theatlantic.com/<br />
magazine/archive/2010/07/the-end-of-men/8135/.<br />
United Nations High Commissioner for Refugees. 2009. Global<br />
Report 2008. New York: United Nations.<br />
World Bank, “Statistics in Africa.” Available online at http://www.<br />
worldbank.org/afr/stats.<br />
World <strong>Population</strong> Data Sheet. 2007. Washington, D.C.: <strong>Population</strong><br />
Reference Bureau.<br />
Ten Recommended Books on <strong>Population</strong> <strong>Geography</strong><br />
(For additional suggested readings, see The Human Mosaic<br />
web site: www.whfreeman.com/domosh12e)<br />
Castles, Stephen, and Mark J. Miller. 1998. The Age of Migration:<br />
International <strong>Population</strong> Movements in the Modern World, 2nd ed.<br />
New York: Guilford. A global perspective on migrations, why<br />
they occur, and the effects they have on different countries, in<br />
an age of an unprecedented volume of migration. Explores<br />
how migration has led to the formation of ethnic minorities in<br />
numerous countries as well as its impact on domestic politics<br />
and economics.<br />
Diamond, Jared. 2005. Collapse: How Societies Choose to Fail or Succeed.<br />
New York: Penguin. Why do thriving civilizations die out?<br />
Ecology, biology, and geography all play a role in Diamond’s<br />
analysis.<br />
Hall, Edward T. 1966. The Hidden Dimension. Garden City, N.Y.:<br />
Doubleday. This is the classic study of proxemics conducted<br />
by an anthropologist. Hall argues that culture, above all else,<br />
shapes our criteria for defining, organizing, and using space.<br />
Johnson, Steven. 2006. The Ghost Map: The Story of London’s Most<br />
Terrifying Epidemic—And How It Changed Science, Cities, and the<br />
Modern World. New York: Riverhead Books. In this gripping historical<br />
narrative, physician John Snow’s tracing of the Soho<br />
cholera outbreak of 1854 is placed in the larger context of the<br />
history of science and urbanization.<br />
Mann, Charles C. 2006. 1491. New York: Vintage. This highly<br />
readable account of the American landscape on the eve of<br />
European conquest challenges long-held notions. Contending<br />
that the indigenous population of the Americas was in fact<br />
much larger and well-off than assumed, Mann paints a picture<br />
of a preconquest landscape that was culturally rich, technologically<br />
sophisticated, and environmentally compromised.<br />
Meade, Melinda S., and Robert J. Earickson. 2005. Medical <strong>Geography</strong>,<br />
2nd ed. New York: Guilford. Surveys the perspectives,<br />
theories, and methodologies that geographers use in studying<br />
human health; a primary text that undergraduates can readily<br />
understand.<br />
Newbold, K. Bruce. 2007. Six Billion Plus: World <strong>Population</strong> in the<br />
Twenty-First Century, 2nd ed. Lanham, Md.: Rowman & Littlefield.<br />
The impact of increased global population levels across<br />
the next century is assessed with respect to interaction with<br />
environmental, epidemiological, mobility, and security issues.<br />
Roberts, Brian K. 1996. Landscapes of Settlement. London: Routledge.<br />
Discusses the role and significance of rural settlements,<br />
drawing from global case studies. Outlines the formation of different<br />
spatial arrangements at the farmstead, hamlet, and village<br />
scales.<br />
Seager, Joni, and Mona Domosh. 2001. Putting Women in Place:<br />
Feminist Geographers Make Sense of the World. New York: Guilford.<br />
A highly readable account of why paying attention to gender is<br />
crucial to understanding the spaces in which we live and work.<br />
Tone, Andrea. 2002. Devices and Desires: A History of Contraceptives<br />
in America. New York: Hill & Wang. This social history of birth<br />
control in the United States details the fascinating relationship<br />
between the state and the long-standing attempts of men<br />
and women to limit their fertility.<br />
Journals in <strong>Population</strong> <strong>Geography</strong><br />
Gender, Place and Culture: A Journal of Feminist <strong>Geography</strong>. Published<br />
by the Carfax Publishing Co., P.O. Box 2025, Dunnellon, Fla.<br />
34430. Volume 1 appeared in 1994.<br />
<strong>Population</strong> and Environment: A Journal of Interdisciplinary Studies.<br />
Volume 1 was published in 1996.