Chapter 3 Population Geography - W.H. Freeman
Chapter 3 Population Geography - W.H. Freeman
Chapter 3 Population Geography - W.H. Freeman

Create successful ePaper yourself
Turn your PDF publications into a flip-book with our unique Google optimized e-Paper software.
Region 75<br />
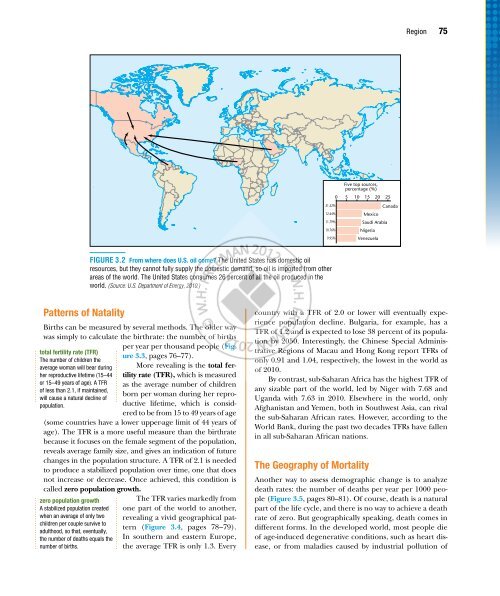
21.52%<br />
12.44%<br />
11.79%<br />
10.76%<br />
9.95%<br />
Five top sources,<br />
percentage (%)<br />
0 5 10 15 20 25<br />
Canada<br />
Mexico<br />
Saudi Arabia<br />
Nigeria<br />
Venezuela<br />
Figure 3.2 From where does U.S. oil come? The United States has domestic oil<br />
resources, but they cannot fully supply the domestic demand, so oil is imported from other<br />
areas of the world. The United States consumes 26 percent of all the oil produced in the<br />
world. (Source: U.S. Department of Energy, 2010.)<br />
Patterns of Natality<br />
Births can be measured by several methods. The older way<br />
was simply to calculate the birthrate: the number of births<br />
per year per thousand people (Figure<br />
3.3, pages 76 –77).<br />
total fertility rate (TFR)<br />
The number of children the<br />
average woman will bear during More revealing is the total fertility<br />
rate (TFR), which is measured<br />
her reproductive lifetime (15–44<br />
or 15–49 years of age). A TFR as the average number of children<br />
of less than 2.1, if maintained,<br />
born per woman during her reproductive<br />
lifetime, which is consid-<br />
will cause a natural decline of<br />
population.<br />
ered to be from 15 to 49 years of age<br />
(some countries have a lower upper-age limit of 44 years of<br />
age). The TFR is a more useful measure than the birthrate<br />
because it focuses on the female segment of the population,<br />
reveals average family size, and gives an indication of future<br />
changes in the population structure. A TFR of 2.1 is needed<br />
to produce a stabilized population over time, one that does<br />
not increase or decrease. Once achieved, this condition is<br />
called zero population growth.<br />
zero population growth<br />
Maps.com<br />
A stabilized population created<br />
WH <strong>Freeman</strong> and Company Publishers<br />
Domosh/The when Human average Mosaic, of 12eonly two<br />
Perm children Fig: 302 per couple survive to<br />
Domosh12e_Fig3.02 - From where does U.S. oil come?<br />
April 20, adulthood, 2011 - Final so that, eventually,<br />
Cyan Magenta Yellow Black<br />
the number of deaths equals the<br />
number of births.<br />
The TFR varies markedly from<br />
one part of the world to another,<br />
revealing a vivid geographical pattern<br />
(Figure 3.4, pages 78 –79).<br />
In southern and eastern Europe,<br />
the average TFR is only 1.3. Every<br />
country with a TFR of 2.0 or lower will eventually experience<br />
population decline. Bulgaria, for example, has a<br />
TFR of 1.2 and is expected to lose 38 percent of its population<br />
by 2050. Interestingly, the Chinese Special Administrative<br />
Regions of Macau and Hong Kong report TFRs of<br />
only 0.91 and 1.04, respectively, the lowest in the world as<br />
of 2010.<br />
By contrast, sub-Saharan Africa has the highest TFR of<br />
any sizable part of the world, led by Niger with 7.68 and<br />
Uganda with 7.63 in 2010. Elsewhere in the world, only<br />
Afghanistan and Yemen, both in Southwest Asia, can rival<br />
the sub-Saharan African rates. However, according to the<br />
World Bank, during the past two decades TFRs have fallen<br />
in all sub-Saharan African nations.<br />
The <strong>Geography</strong> of Mortality<br />
Another way to assess demographic change is to analyze<br />
death rates: the number of deaths per year per 1000 people<br />
(Figure 3.5, pages 80–81). Of course, death is a natural<br />
part of the life cycle, and there is no way to achieve a death<br />
rate of zero. But geographically speaking, death comes in<br />
different forms. In the developed world, most people die<br />
of age-induced degenerative conditions, such as heart disease,<br />
or from maladies caused by industrial pollution of