Chapter 3 Population Geography - W.H. Freeman
Chapter 3 Population Geography - W.H. Freeman
Chapter 3 Population Geography - W.H. Freeman

Create successful ePaper yourself
Turn your PDF publications into a flip-book with our unique Google optimized e-Paper software.
78 <strong>Chapter</strong> 3 <strong>Population</strong> <strong>Geography</strong><br />
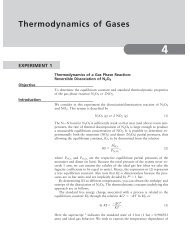
Fertility Rate<br />
TFR<br />
180 140 100 60 20<br />
Under 2.1<br />
80<br />
80<br />
2.1–3.0<br />
3.1–4.0<br />
60<br />
4.1–5.0<br />
5.1–6.0<br />
40<br />
Over 6.0<br />
Not available<br />
20<br />
0<br />
140 120<br />
20<br />
0 1000 2000 mi.<br />
0 1000 2000 3000<br />
km<br />
Scale at latitude 35°<br />
Figure 3.4 The total fertility rate (TFR) in the<br />
world. The TFR indicates the average number of<br />
children born to women over their lifetimes. A rate of<br />
2.1 is needed to produce a stable population over<br />
the long run; below that, population will decline. Fast<br />
growth is associated with a TFR of 5.0 or higher.<br />
(Source: <strong>Population</strong> Reference Bureau.)<br />
Flat Polar Quartic<br />
equal area projection<br />
40<br />
100 80 60 40 20<br />
average of 35 years in the eighteenth century to 75 years or<br />
more at present. Yet birthrates did not fall so quickly, leading<br />
to a population explosion as fertility outpaced mortality.<br />
In Figure 3.7, this is shown in late stage 2 and early<br />
stage 3 of the model. Eventually, a decline in the birthrate<br />
followed the decline in the death rate, slowing population<br />
growth. An important reason leading to lower fertility levels<br />
involves the high cost of children in industrial societies,<br />
particularly because childhood itself becomes a prolonged<br />
period of economic dependence on parents. Finally, in<br />
Maps.com<br />
WH <strong>Freeman</strong> and Company Publishers<br />
Domosh/The Human Mosaic, 12e<br />
Perm Fig: 304<br />
Domosh_Fig3.04a - Total Fertility Rate<br />
April 20, 2011 - Final<br />
Cyan Magenta Yellow Black<br />
the postindustrial period, the demographic transition<br />
produced zero population growth or actual population<br />
decline (Figure 3.7, page 82, and Figure 3.8, pages 84–85).<br />
Achieving lower death rates is relatively cost effective,<br />
historically requiring little more than the provision of safe<br />
drinking water and vaccinations against common infectious<br />
disease. Lowering death rates tends to be uncontroversial<br />
and quickly achieved, demographically speaking.<br />
Getting birthrates to fall, however, can be far more difficult,<br />
especially for a government official who wants to be