Chapter 3 Population Geography - W.H. Freeman
Chapter 3 Population Geography - W.H. Freeman
Chapter 3 Population Geography - W.H. Freeman

You also want an ePaper? Increase the reach of your titles
YUMPU automatically turns print PDFs into web optimized ePapers that Google loves.
Region 85<br />
40 0 40 80 120 160<br />
80<br />
60 60<br />
40<br />
20<br />
0<br />
20<br />
40<br />
20<br />
0 20 40 60 80 100 120 140 160 180<br />
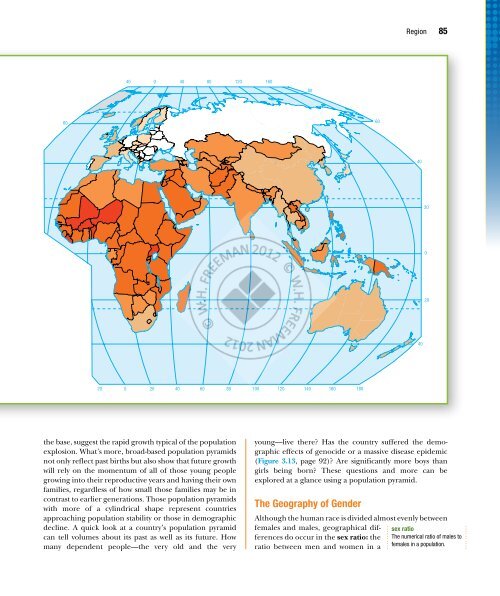
the base, suggest the rapid growth typical of the population<br />
explosion. What’s more, broad-based population pyramids<br />
not only reflect past births but also show that future growth<br />
will rely on the momentum of all of those young people<br />
growing into their reproductive years and having their own<br />
families, regardless of how small those families may be in<br />
contrast to earlier generations. Those population pyramids<br />
with more of a cylindrical shape represent countries<br />
approaching population stability or those in demographic<br />
decline. A quick look at a country’s population pyramid<br />
can tell volumes about its past as well as its future. How<br />
many dependent people—the very old and the very<br />
Maps.com<br />
WH <strong>Freeman</strong> and Company Publishers<br />
Domosh/The Human Mosaic, 12e<br />
Perm Fig: 308<br />
Domosh12e_Fig3.08b - Annual population Change<br />
April 20, 2011 - Final<br />
Cyan Magenta Yellow Black<br />
young—live there? Has the country suffered the demographic<br />
effects of genocide or a massive disease epidemic<br />
(Figure 3.13, page 92)? Are significantly more boys than<br />
girls being born? These questions and more can be<br />
explored at a glance using a population pyramid.<br />
The <strong>Geography</strong> of Gender<br />
Although the human race is divided almost evenly between<br />
females and males, geographical differences<br />
do occur in the sex ratio: the The numerical ratio of males to<br />
sex ratio<br />
ratio between men and women in a females in a population.