A Guided Walk Down Wall Street: An Introduction to Econophysics
A Guided Walk Down Wall Street: An Introduction to Econophysics
A Guided Walk Down Wall Street: An Introduction to Econophysics

Create successful ePaper yourself
Turn your PDF publications into a flip-book with our unique Google optimized e-Paper software.
Brazilian Journal of Physics, vol. 34, no. 3B, September, 2004 1039<br />
A <strong>Guided</strong> <strong>Walk</strong> <strong>Down</strong> <strong>Wall</strong> <strong>Street</strong>: <strong>An</strong> <strong>Introduction</strong> <strong>to</strong> <strong>Econophysics</strong><br />
Giovani L. Vasconcelos<br />
Laboratório de Física Teórica e Computacional, Departamen<strong>to</strong> de Física,<br />
Universidade Federal de Pernambuco, 50670-901 Recife, PE, Brazil<br />
Received on 10 May, 2004<br />
This article contains the lecture notes for the short course “<strong>Introduction</strong> <strong>to</strong> <strong>Econophysics</strong>,” delivered at the II<br />
Brazilian School on Statistical Mechanics, held in São Carlos, Brazil, in February 2004. The main goal of<br />
the present notes is twofold: i) <strong>to</strong> provide a brief introduction <strong>to</strong> the problem of pricing financial derivatives<br />
in continuous time; and ii) <strong>to</strong> review some of the related problems <strong>to</strong> which physicists have made relevant<br />
contributions in recent years.<br />
1 <strong>Introduction</strong><br />
This article comprises the set of notes for the short course<br />
“<strong>Introduction</strong> <strong>to</strong> <strong>Econophysics</strong>,” delivered at the II Brazilian<br />
School on Statistical Mechanics, held at the University of<br />
São Paulo, in São Carlos, SP, Brazil, in February 2004. The<br />
course consisted of five lectures and was aimed at physics<br />
graduate students with no previous exposition <strong>to</strong> the subject.<br />
The main goal of the course was twofold: i) <strong>to</strong> provide<br />
a brief introduction <strong>to</strong> the basic models for pricing financial<br />
derivatives; and ii) <strong>to</strong> review some of the related problems in<br />
Finance <strong>to</strong> which physicists have made significant contributions<br />
over the last decade. The recent body of work done by<br />
physicists and others have produced convincing evidences<br />
that the standard model of Finance (see below) is not fully<br />
capable of describing real markets, and hence new ideas and<br />
models are called for, some of which have come straight<br />
from Physics. In selecting some of the more recent work<br />
done by physicists <strong>to</strong> discuss here, I have tried <strong>to</strong> restrict<br />
myself <strong>to</strong> problems that may have a direct bear on models<br />
for pricing derivatives. <strong>An</strong>d even in such cases only a brief<br />
overview of the problems is given. It should then be emphasized<br />
that these notes are not intended as a review article on<br />
<strong>Econophysics</strong>, which is nowadays a broad interdisciplinary<br />
area, but rather as a pedagogical introduction <strong>to</strong> the mathematics<br />
(and physics?) of financial derivatives. Hence no<br />
attempt has been made <strong>to</strong> provide a comprehensive list of<br />
references.<br />
No claim of originality is made here regarding the contents<br />
of the present notes. Indeed, the basic theory of financial<br />
derivatives can now be found in numerous textbooks,<br />
written at a different mathematical levels and aiming at specific<br />
(or mixed) audiences, such as economists [1, 2, 3, 4],<br />
applied mathematicians [5, 6, 7, 8], physicists [9, 10, 11],<br />
etc. (Here I have listed only the texts that were most often<br />
consulted while writing these notes.) Nevertheless, some<br />
aspects of presentation given here have not, <strong>to</strong> my knowledge,<br />
appeared before. <strong>An</strong> example is the analogy between<br />
market efficiency and a certain symmetry principle that is<br />
put forward in Sec. V. Similarly, the discussion of some of<br />
the more recent research problems is based on the already<br />
published literature. <strong>An</strong> exception is Fig. 12 which contains<br />
unpublished results obtained by R. L. Costa and myself.<br />
The present notes are organized as follows. Section<br />
II gives some basic notions of Finance, intended <strong>to</strong> introduce<br />
the terminology as well as the main problems that I<br />
shall be considering. In Sec. III, I discuss the Brownian<br />
motion, under a more formal viewpoint than most Physics<br />
graduate students are perhaps familiar with, and then develop<br />
the so-called Itô s<strong>to</strong>chastic calculus. Section IV contains<br />
what is the raison d’etre of the present notes, the<br />
Black-Scholes model for pricing financial derivatives. In<br />
Sec. V, the martingale approach for pricing derivatives is<br />
introduced. In particular, I recast the notions of market efficiency<br />
and no-arbitrage as a ‘symmetry principle’ and its<br />
associated ‘conservation law.’ Sections VI and VII discuss<br />
two possible ways in which real markets may deviate from<br />
the standard Black-Scholes model. The first of such possibilities<br />
is that financial asset prices have non-Gaussian distributions<br />
(Sec. VI), while the second one concerns the presence<br />
of long-range correlations or memory effects in financial<br />
data (Sec. VII). Conclusions are presented in Sec. VIII.<br />
For completeness, I give in Appendix A the formal definitions<br />
of probability space, random variables, and s<strong>to</strong>chastic<br />
processes.<br />
2 Basic Notions of Finance<br />
2.1 Riskless and risky financial assets<br />
Suppose you deposit at time t = 0 an amount of R$ 1 in<strong>to</strong> a<br />
bank account that pays an interest rate r. Then over time the<br />
amount of money you have in the bank, let us call it B(t),<br />
will increase at a rate<br />
dB<br />
= rB. (1)<br />
dt<br />
Solving this equation subject <strong>to</strong> the initial condition B(0) =<br />
1 yields<br />
B(t) = e rt . (2)
1040 Giovani L. Vasconcelos<br />
A bank account is an example of a riskless financial<br />
assets, since you are guaranteed <strong>to</strong> receive a known (usually<br />
fixed) interest rate r, regardless of the market situation.<br />
Roughly speaking, the way banks operate is that they borrow<br />
from people who have money <strong>to</strong> ‘spare’, but are not willing<br />
<strong>to</strong> take risks, and lend (at higher interest rates) <strong>to</strong> people<br />
who ‘need’ money, say, <strong>to</strong> invest in some risky enterprise.<br />
By diversifying their lending, banks can reduce their overall<br />
risk, so that even if some of these loans turn bad they can<br />
still meet their obligations <strong>to</strong> the inves<strong>to</strong>rs from whom they<br />
borrowed.<br />
Governments and private companies can also borrow<br />
money from inves<strong>to</strong>rs by issuing bonds. Like a bank account,<br />
a bond pays a (fixed or floating) interest rate on a regular<br />
basis, the main difference being that the repayment of<br />
the loan occurs only at a specified time, called the bond maturity.<br />
<strong>An</strong>other difference is that bonds are not strictly riskfree<br />
assets because there is always a chance that the bond<br />
issuer may default on interest payments or (worse) on the<br />
principal. However, since governments have a much lower<br />
risk <strong>to</strong> default than corporations, certain government bonds<br />
can be considered <strong>to</strong> be risk free.<br />
A company can also raise capital by issuing s<strong>to</strong>cks or<br />
shares. Basically, a s<strong>to</strong>ck represents the ownership of a<br />
small piece of the company. By selling many such ‘small<br />
pieces’, a company can raise capital at lower costs than if it<br />
were <strong>to</strong> borrow from a bank. As will be discussed shortly,<br />
s<strong>to</strong>cks are risky financial assets because their prices are subjected<br />
<strong>to</strong> unpredictable fluctuations. In fact, this is what<br />
makes s<strong>to</strong>cks attractive <strong>to</strong> aggressive inves<strong>to</strong>rs who seek <strong>to</strong><br />
profit from the price fluctuations by pursuing the old advice<br />
<strong>to</strong> “buy low and sell high.”<br />
The buying and selling of s<strong>to</strong>cks are usually done in organized<br />
exchanges, such as, the New York S<strong>to</strong>ck Exchange<br />
(NYSE) and the São Paulo S<strong>to</strong>ck Exchange (BOVESPA).<br />
Most s<strong>to</strong>ck exchanges have indexes that represent some sort<br />
of average behavior of the corresponding market. Each index<br />
has its own methodology. For example, the Dow Jones<br />
Industrial Average of the NYSE, which is arguably the most<br />
famous s<strong>to</strong>ck index, corresponds <strong>to</strong> an average over 30 industrial<br />
companies. The Ibovespa index of the São Paulo<br />
S<strong>to</strong>ck Exchange, in contrast, represents the present value of<br />
a hypothetical portfolio made up of the s<strong>to</strong>cks that al<strong>to</strong>gether<br />
correspond <strong>to</strong> 80% of the trading volume. <strong>An</strong>other well<br />
known s<strong>to</strong>ck index is the Standard & Poor’s 500 (S&P500)<br />
Index calculated on the basis of data about 500 companies<br />
listed on the NYSE. [Many other risky financial assets, such<br />
as, currency exchange rates, interest rates, and commodities<br />
(precious metals, oil, grains, etc), are traded on organized<br />
markets but these will not be discussed any further in the<br />
present notes.]<br />
2.2 The random nature of s<strong>to</strong>ck prices<br />
Since a s<strong>to</strong>ck represents a ‘small piece’ of a company, the<br />
s<strong>to</strong>ck price should somehow reflect the overall value (net<br />
worth) of this company. However, the present value of a firm<br />
depends not only on the firm’s current situation but also on<br />
its future performance. So here one sees already the basic<br />
problem in pricing risky financial assets: we are trying <strong>to</strong><br />
predict the future on the basis of present information. Thus,<br />
if a new information is revealed that might in one way or<br />
another affect the company’s future performance, then the<br />
s<strong>to</strong>ck price will vary accordingly. It should therefore be<br />
clear from this simple discussion that the future price of a<br />
s<strong>to</strong>ck will always be subjected <strong>to</strong> a certain degree of uncertainty.<br />
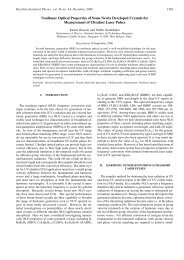
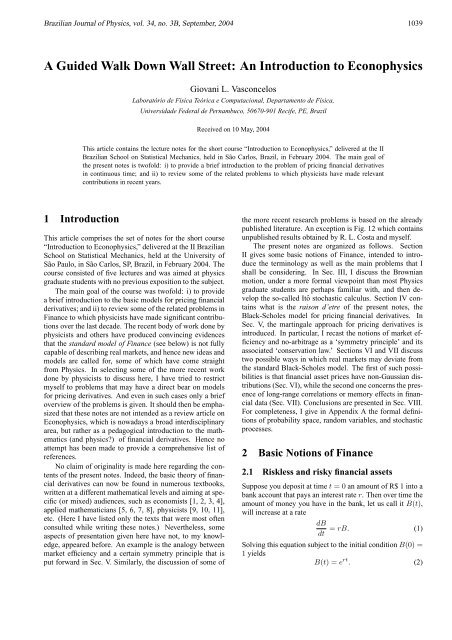
This is reflected in the typical ‘erratic behavior’ that<br />
s<strong>to</strong>ck prices show when graphed as a function of time. <strong>An</strong><br />
example of such a graph is shown in Fig. 1 for the case of<br />
the Ibovespa s<strong>to</strong>ck index.<br />
12000<br />
8000<br />
4000<br />
0<br />
1968 1972 1976 1980 1984 1988 1992 1996 2000<br />
date<br />
Figure 1. Daily closing values of the deflated Ibovespa index in the<br />
period 1968–2003.<br />
Although s<strong>to</strong>ck prices may vary in a rather unpredictable<br />
way, this does not mean that they cannot be modeled. It says<br />
only that they should be described in a probabilistic fashion.<br />
To make the argument a little more precise, let S be the price<br />
of a given s<strong>to</strong>ck and suppose we want <strong>to</strong> write an equation<br />
analogous <strong>to</strong> (1) for the rate of increase of S:<br />
dS<br />
dt<br />
= R(t)S, (3)<br />
where R(t) represents the ‘rate of return’ of the s<strong>to</strong>ck. The<br />
question then is: what is R(t)? From our previous discussion,<br />
it is reasonable <strong>to</strong> expect that R(t) could be separated<br />
in<strong>to</strong> two components: i) a predictable mean rate of return,<br />
<strong>to</strong> be denoted by µ, and ii) a fluctuating (‘noisy’) term ξ(t),<br />
responsible for the randomness or uncertainty in the s<strong>to</strong>ck<br />
price. Thus, after writing R(t) = µ + ξ(t) in (3) we have<br />
dS<br />
dt<br />
= [µ + ξ(t)] S. (4)<br />
Now, one of the best models for ‘noise’ is, of course, the<br />
white noise, so it should not come as a surprise <strong>to</strong> a physicist<br />
that Brownian motion and white noise play an important<br />
rôle in finance, as will be discussed in detail shortly.<br />
2.3 Options and derivatives<br />
Besides the primary financial assets already mentioned<br />
(s<strong>to</strong>cks, commodities, exchange rate, etc), many other financial<br />
instruments, such as options and futures contracts,
Brazilian Journal of Physics, vol. 34, no. 3B, September, 2004 1041<br />
are traded on organized markets (exchanges). These securities<br />
are generically called derivatives, because they derive<br />
their value from the price of some primary underlying asset.<br />
Derivatives are also sometimes referred <strong>to</strong> as contingent<br />
claims, since their values are contingent on the evolution of<br />
the underlying asset. In the present notes, I will discuss only<br />
one of the most basic derivatives, namely, options.<br />
<strong>An</strong> option is a contract that gives its holder the right, but<br />
not the obligation, <strong>to</strong> buy or sell a certain asset for a specified<br />
price at some future time. The other part of the contract,<br />
the option underwriter, is obliged <strong>to</strong> sell or buy the asset at<br />
the specified price. The right <strong>to</strong> buy (sell) is called a call<br />
(put) option. If the option can only be exercised at the future<br />
date specified in the contract, then it is said <strong>to</strong> be a European<br />
option. American options, on the other hand, can be<br />
exercised at any time up <strong>to</strong> maturity. (For pedagogical reasons,<br />
only European derivatives will be considered here.) To<br />
establish some notation let us give a formal definition of a<br />
European option.<br />
Definition 1 A European call option with exercise price (or<br />
strike price) K and maturity (or expiration date) T on the<br />
underlying asset S is a contract that gives the holder the<br />
right <strong>to</strong> buy the underlying asset for the price K at time T .<br />
A European put option is the same as above, the only<br />
difference being that it gives the holder the right <strong>to</strong> sell the<br />
underlying asset for the exercise price at the expiration date.<br />
If at the expiration date T the s<strong>to</strong>ck price S T is above the<br />
strike price K, the holder of a call option will exercise his<br />
right <strong>to</strong> buy the s<strong>to</strong>ck from the underwriter at price K and<br />
sell it in the market at the spot price S T , pocketing the difference<br />
S T −K. On the other hand, if at expiration the price<br />
S T closes below K then the call option becomes worthless<br />
(since it would be cheaper <strong>to</strong> buy the s<strong>to</strong>ck in the market).<br />
The payoff of a call option at maturity is therefore given by<br />
C<br />
payoff call = max(S T − K, 0). (5)<br />
K<br />
t
1042 Giovani L. Vasconcelos<br />
of the Black-Scholes model [and the establishment of the<br />
first option exchange in Chicago also in 1973] have option<br />
markets thrived. One of the main objectives of the present<br />
notes is <strong>to</strong> explain the theoretical framework, namely, the<br />
Black-Scholes model and some of its extensions, in which<br />
options and other derivatives are priced. I will therefore not<br />
say much about the practical aspects of trading with options.<br />
2.4 Hedging, speculation, and arbitrage<br />
Inves<strong>to</strong>rs in derivative markets can be classified in<strong>to</strong> three<br />
main categories: hedgers, specula<strong>to</strong>rs, and arbitrageurs.<br />
Hedgers are interested in using derivatives <strong>to</strong> reduce the<br />
risk they already face in their portfolio. For example, suppose<br />
you own a s<strong>to</strong>ck and are afraid that its price might go<br />
down within the next months. One possible way <strong>to</strong> limit<br />
your risk is <strong>to</strong> sell the s<strong>to</strong>ck now and put the money in a<br />
bank account. But then you won’t profit if the market goes<br />
up. A better hedging strategy would clearly be <strong>to</strong> buy a put<br />
option on the s<strong>to</strong>ck, so that you only have <strong>to</strong> sell the s<strong>to</strong>ck<br />
if it goes below a certain price, while getting <strong>to</strong> keep it if<br />
the price goes up. In this case an option works pretty much<br />
as an insurance: you pay a small price (the option premium<br />
C 0 ) <strong>to</strong> insure your holdings against possibly high losses.<br />
Specula<strong>to</strong>rs, in contrast <strong>to</strong> hedgers, seek <strong>to</strong> make profit<br />
by taking risks. They ‘take a position’ in the market, by betting<br />
that the price on a given financial asset will go either<br />
up or down. For instance, if you think that a certain s<strong>to</strong>ck<br />
will go up in the near future, you could “buy and hold” the<br />
s<strong>to</strong>ck in the hope of selling it later at a profit. But then there<br />
is the risk that the price goes down. A better strategy would<br />
thus be <strong>to</strong> buy a call option on the s<strong>to</strong>ck. This not only is<br />
far cheaper than buying the s<strong>to</strong>ck itself but also can yield<br />
a much higher return on your initial investment. (Why?)<br />
However, if the market does not move in the way you expected<br />
and the option expire worthless, you end up with a<br />
100% loss. (That’s why speculating with option is a very<br />
risky business.)<br />
Arbitrageurs seek <strong>to</strong> make a riskless profit by entering<br />
simultaneously in<strong>to</strong> transactions in two or more markets,<br />
usually without having <strong>to</strong> make any initial commitment of<br />
money. The possibility of making a riskless profit, starting<br />
with no money at all, is called an arbitrage opportunity or,<br />
simply, an arbitrage. A more formal definition of arbitrage<br />
will be given later. For the time being, it suffices <strong>to</strong> give an<br />
example of how an arbitrage opportunity may arise.<br />
But before going in<strong>to</strong> this example, it is necessary first<br />
<strong>to</strong> discuss the notion of a short sell. ‘Shorting’ means selling<br />
an asset that one does not own. For example, if you place an<br />
order <strong>to</strong> your broker <strong>to</strong> short a s<strong>to</strong>ck, the broker will “borrow”<br />
a s<strong>to</strong>ck from somebody else’s account, sell it in the<br />
market, and credit the proceeds in<strong>to</strong> your account. When<br />
you then decide <strong>to</strong> close your short position (there usually is<br />
a limit on how long an asset can be held short), your broker<br />
will buy the s<strong>to</strong>ck in the market (taking the money from your<br />
account) and return it <strong>to</strong> its original owner. If in the meantime<br />
the s<strong>to</strong>ck prices decreased, the short sell brings a profit,<br />
otherwise the short seller incurs in a loss. This is why a<br />
short sell is usually done simultaneously with another operation<br />
<strong>to</strong> compensate for this risk (as in the arbitrage example<br />
below). It should also be noted, in passing, that buying the<br />
actual asset corresponds <strong>to</strong> taking a ‘long position’ on this<br />
asset.<br />
Let us now consider our hypothetical arbitrage example.<br />
Many Brazilian companies listed in the São Paulo S<strong>to</strong>ck Exchange<br />
also have their s<strong>to</strong>cks traded on the New York S<strong>to</strong>ck<br />
Exchange in the form of the so-called American Deposi<strong>to</strong>ry<br />
Receipt (ADR). Suppose then that a s<strong>to</strong>ck is quoted in<br />
São Paulo at R$ 100, with its ADR counterpart trading in<br />
New York at US$ 34, while the currency rate exchange is<br />
1 USD = 2.90 BRL. Starting with no initial commitment,<br />
an arbitrageur could sell short N s<strong>to</strong>cks in São Paulo and<br />
use the proceeds <strong>to</strong> buy N ADR’s in New York (and later<br />
have them transferred <strong>to</strong> São Paulo <strong>to</strong> close his short position).<br />
The riskless profit in such operation would be R$<br />
(100 − 2.90 × 34)N = R$ 1.40 N. (In practice, the transaction<br />
costs would eliminate the profit for all but large institutional<br />
inves<strong>to</strong>rs [1].)<br />
Note, however, that such ‘mispricing’ cannot last long:<br />
buy orders in New York will force the ADR price up, while<br />
sell orders in São Paulo will have the opposite effect on the<br />
s<strong>to</strong>ck price, so that an equilibrium price for both the ADR<br />
and the s<strong>to</strong>ck is soon reached, whereupon arbitrage will no<br />
longer be possible. In this sense, the actions of an arbitrageur<br />
are self-defeating, for they tend <strong>to</strong> destroy the very<br />
arbitrage opportunity he is acting upon—but before this happens<br />
a lot of money can be made. Since there are many<br />
people looking for such riskless chances <strong>to</strong> make money, a<br />
well-functioning market should be free of arbitrage. This is<br />
the main idea behind the principle that in an efficient market<br />
there is no arbitrage, which is commonly known as the<br />
“no-free-lunch” condition.<br />
2.5 The no-arbitrage principle in a (binomial)<br />
nutshell<br />
Here we shall consider a one-step binomial model <strong>to</strong> illustrate<br />
the principle of no-arbitrage and how it can be used<br />
<strong>to</strong> price derivatives. Suppose that <strong>to</strong>day’s price of an ordinary<br />
Petrobras s<strong>to</strong>cks (PETR3 in their Bovespa acronym) is<br />
S 0 = 57 BRL. Imagine then that in the next time-period,<br />
say, one month, the s<strong>to</strong>ck can either go up <strong>to</strong> S1 u = 65 with<br />
probability p or go down <strong>to</strong> S1 d = 53 with probability q. For<br />
simplicity let us take p = q = 1/2. Our binomial model for<br />
the s<strong>to</strong>ck price dynamics is illustrated in Fig. 4. Note that<br />
in this case the s<strong>to</strong>ck mean rate of return, µ, is given by the<br />
expression: (1+µ)S 0 = E[S 1 ], where E[S] denotes the expected<br />
value of S (see Sec. III A for more on this notation).<br />
Using the values shown in Fig. 4, one then gets µ = 0.035<br />
or µ = 3.5%. Let us also assume that the risk-free interest<br />
rate is r = 0.6% monthly.<br />
Consider next a call option on PETR3 with exercise<br />
price K = 57 and expiration in the next time period, i.e.,<br />
T = 1. Referring <strong>to</strong> (5) and Fig. 4, one immediately sees<br />
that at expiration the possible values (payoffs) for this option<br />
in our binomial model are as shown in Fig. 5: C1 u = 8<br />
or C1<br />
d = 0 with equal probability. The question then is <strong>to</strong><br />
determine the ‘rational’ price C 0 that one should pay for the
Brazilian Journal of Physics, vol. 34, no. 3B, September, 2004 1043<br />
option. Below we will solve this problem using two different<br />
but related methods. The idea here is <strong>to</strong> illustrate the<br />
main principles involved in option pricing, which will be<br />
generalized later for the case of continuous time.<br />
S = 57 0<br />
p = 1/2<br />
p = 1/2<br />
S = 65 1<br />
S = 53 1<br />
Figure 4. One-step binomial model for a s<strong>to</strong>ck.<br />
C 1= 65-57 = 8<br />
p = 1/2<br />
C 0<br />
p = 1/2<br />
C 1= 0<br />
Figure 5. Option value in the one-step binomial model.<br />
V 0 = C 0-57∆<br />
p = 1/2<br />
V = 8-65∆<br />
p = 1/2<br />
V 1 = -53 ∆<br />
Figure 6. Delta-hedging portfolio in the one-step binomial model.<br />
First, we describe the so-called delta-hedging argument.<br />
Consider a portfolio made up of one option C and a short<br />
position on ∆ s<strong>to</strong>cks, where ∆ is <strong>to</strong> be determined later, and<br />
let V t denote the money value of such a portfolio at time t.<br />
We thus have<br />
V t = C t − ∆S t ,<br />
where the minus sign denotes that we have short sold ∆<br />
s<strong>to</strong>cks (i.e., we ‘owe’ ∆ s<strong>to</strong>cks in the market). From Figs. 4<br />
and 5, one clearly sees that the possibles values for this portfolio<br />
in our one-step model are as illustrated in Fig. 6. Let<br />
us now chose ∆ such that the value V 1 of the portfolio is<br />
the same in both ‘market situations.’ Referring <strong>to</strong> Fig. 6 one<br />
immediately finds<br />
V u<br />
1 = V d<br />
1 =⇒ 8 − ∆ · 65 = −∆ · 53 =⇒ ∆ = 2 3 .<br />
Thus, by choosing ∆ = 2/3 we have completely eliminated<br />
the risk from our portfolio, since in both (up or down) scenarios<br />
the portfolio has the same value V 1 . But since this<br />
1<br />
portfolio is riskless, its rate of return must be equal <strong>to</strong> the<br />
risk-free interest rate r, otherwise there would be an arbitrage<br />
opportunity, as the following argument shows.<br />
Let r ′ denote the portfolio rate of return, i.e., r ′ is the<br />
solution <strong>to</strong> the following equation<br />
(1 + r ′ )V 0 = V 1 . (7)<br />
If r ′ < r, then an arbitrageur should take a long position<br />
on (i.e., buy) the option and a short position on ∆ s<strong>to</strong>cks.<br />
To see why this is an arbitrage, let us go through the argument<br />
in detail. At time t = 0 the arbitrageur’s net cashflow<br />
would be B 0 = |V 0 | = ∆ · S 0 − C 0 , which he should<br />
put in the bank so that in the next period he would have<br />
B 1 = (1 + r)|V 0 |. At time t = 1, he should then close his<br />
short position on ∆ s<strong>to</strong>cks, either exercising his option (up<br />
scenario) or buying ∆ s<strong>to</strong>cks directly in the market (down<br />
scenario). In either case, he would have <strong>to</strong> pay the same<br />
amount |V 1 | = (1 + r ′ )|V 0 | < B 1 , and hence would be left<br />
with a profit of B 1 − |V 1 |. On the other hand, if r ′ > r the<br />
arbitrageur should adopt the opposite strategy: go short on<br />
(i.e., underwrite) the option and long on ∆ s<strong>to</strong>cks (borrowing<br />
money from the bank <strong>to</strong> do so).<br />
We have thus shown that <strong>to</strong> avoid arbitrage we must have<br />
r ′ = r. This is indeed a very general principle that deserves<br />
<strong>to</strong> be stated in full: in a market free of arbitrage any riskless<br />
portfolio must yield the risk-free interest rate r. This<br />
no-arbitrage principle is at the core of the modern theory of<br />
pricing derivatives, and, as such, it will be used several times<br />
in these notes.<br />
Let us now return <strong>to</strong> our option pricing problem. Setting<br />
r ′ = r in (7) and substituting the values of V 0 and V 1 given<br />
in Fig. 6, we obtain<br />
(1 + r) [C 0 − ∆ S 0 ] = −∆ S d 1 . (8)<br />
Inserting the values of r = 0.006, S 0 = 57, S d 1 = 53, and<br />
∆ = 2/3 in<strong>to</strong> the equation above, it then follows that the<br />
option price that rules out arbitrage is<br />
C 0 = 2.88. (9)<br />
It is instructive <strong>to</strong> derive the option price through a<br />
second method, namely, the martingale approach or riskneutral<br />
valuation. To this end, we first note that from Fig. 5<br />
we see that the expected value of the option at expiration is<br />
E[C 1 ] = 1 2 8 + 1 2<br />
0 = 4. One could then think, not <strong>to</strong>tally<br />
unreasonably, that the correct option price should be<br />
the expected payoff discounted <strong>to</strong> the present time with the<br />
risk-free interest rate. In this case one would get<br />
C ′ 0 = E[C 1]<br />
1 + r = 4<br />
1.006 = 3.98,<br />
which is quite different from the price found in (9). The<br />
faulty point of the argument above is that, while we used the<br />
risk-free rate r <strong>to</strong> discount the expected payoff E[C 1 ], we<br />
have implicitly used the s<strong>to</strong>ck mean rate of return µ when<br />
calculating E[C 1 ]. Using these two different rates leads <strong>to</strong><br />
a wrong price, which would in turn give rise <strong>to</strong> an arbitrage<br />
opportunity.
1044 Giovani L. Vasconcelos<br />
A way <strong>to</strong> avoid this arbitrage is <strong>to</strong> find fictitious probabilities<br />
q u and q d , with q u + q d = 1, such that the s<strong>to</strong>ck expected<br />
return calculated with these new probabilities would<br />
equal the risk-free rate r. That is, we must demand that<br />
S 0 (1 + r) = E Q [S 1 ] ≡ q u · S u 1 + q d · S d 1 , (10)<br />
where E Q [x] denotes expected value with respect <strong>to</strong> the new<br />
probabilities q u and q d . Using the values for S u 1 and S d 1<br />
given in Fig. 4, we easily find that<br />
q u = 0.3618, q d = 0.6382.<br />
Under these probabilities, the expected value E Q [C 1 ] of the<br />
option at maturity becomes E Q [C 1 ] = 0.3618×8+0.6382×<br />
0 = 2.894, which discounted <strong>to</strong> the present time yields<br />
C 0 = EQ [C 1 ]<br />
1 + r<br />
= 2.894<br />
1.006 = 2.88,<br />
thus recovering the same price found with the delta-hedging<br />
argument.<br />
Note that under the fictitious probability q u and q d , all<br />
financial assets (bank account, s<strong>to</strong>ck, and option) in our binomial<br />
model yield exactly the same riskless rate r. Probabilities<br />
that have this property of ‘transforming’ risky assets<br />
in<strong>to</strong> seemingly risk-free ones are called an equivalent martingale<br />
measure. Martingale measures is a <strong>to</strong>pic of great<br />
relevance in Finance, as will be discussed in more detail in<br />
Sec. IV.<br />
In closing this subsection, it should be noted that the<br />
one-step binomial model considered above can be easily<br />
generalized <strong>to</strong> a binomial tree with, say, N time steps. But<br />
for want of space this will not be done here. (I anticipare<br />
here, however, that Black-Scholes model <strong>to</strong> be considered<br />
later corresponds precisely <strong>to</strong> the continuous-time limit of<br />
the binomial multistep model.) It is perhaps also worth mentioning<br />
that binomial models are often used in practice <strong>to</strong><br />
price exotic derivatives, for which no closed formula exists,<br />
since such models are rather easy <strong>to</strong> implement on the computer;<br />
see, e.g., [1] for more details on binomial models.<br />
2.6 Put-Call parity<br />
In the previous subsection I only considered the price of a<br />
(European) call option, and the attentive reader might have<br />
wondered how can one determine the price of the corresponding<br />
put option. It turns out that there is a simple relationship<br />
between European put and call options, so that<br />
from the price of one of them we can obtain the price of the<br />
other. To see this, form the following portfolio: i) buy one<br />
s<strong>to</strong>ck S and one put option P on this s<strong>to</strong>ck with strike price<br />
K and maturity T , and ii) short one call option C with the<br />
same strike and maturity as the put option. The value of such<br />
portfolio would thus be<br />
V = S + P − C. (11)<br />
Now from (5) and (6), one immediately sees that at expiration<br />
we have P − C = K − S, so that the value of the above<br />
portfolio at time T becomes simply<br />
V T = K. (12)<br />
Since this portfolio has a known (i.e., riskless) value at time<br />
t = T , it then follows from the no-arbitrage condition that<br />
its value at any time 0 ≤ t ≤ T must be given by<br />
V = Ke −r(T −t) , (13)<br />
where r is the risk-free interest rate. Inserting (13) in<strong>to</strong> (11)<br />
immediately yields the so-called put-call parity relation:<br />
P = C − S + Ke −r(T −t) . (14)<br />
3 Brownian motion and s<strong>to</strong>chastic<br />
calculus<br />
3.1 One-dimensional random walk<br />
Every physics graduate student is familiar, in one way or another,<br />
with the concept of a Brownian motion. The cus<strong>to</strong>mary<br />
introduction [15] <strong>to</strong> this subject is through the notion of<br />
a random walk, in which the anecdotal drunk walks along a<br />
line taking at every time interval ∆t one step of size l, either<br />
<strong>to</strong> the right or <strong>to</strong> the left with equal probability. The position,<br />
X(t), of the walker after a time t = N∆t, where N<br />
is the number of steps taken, represents a s<strong>to</strong>chastic process.<br />
(See Appendix A for a formal definition of random variables<br />
and s<strong>to</strong>chastic processes.) As is well known, the probability<br />
P (X(t) = x) for the walker <strong>to</strong> be found at a given position<br />
x = nl, where n is an integer, at given time t, is described<br />
by a binomial distribution [15].<br />
Simply stated, the Brownian motion is the s<strong>to</strong>chastic<br />
process that results by taking the random walk <strong>to</strong> the continuous<br />
limit: ∆t → 0, l → 0, N → ∞, n → ∞ such that<br />
t = N∆t and x = nl remain finite. (A more formal definition<br />
is given below.) Here, however, some caution with the<br />
limits must be taken <strong>to</strong> ensure that a finite probability density<br />
p(x, t) is obtained: one must take ∆t → 0 and l → 0,<br />
such that l 2 = σ∆t, where σ is a constant. In this case one<br />
obtains that p(x, t) is given by a Gaussian distribution [15]:<br />
p(x, t) =<br />
{ }<br />
1<br />
√<br />
2πσ2 t exp − x2<br />
2σ 2 . (15)<br />
t<br />
At this point let us establish some notation. Let X be<br />
a random variable with probability density function (pdf)<br />
given by p(x). [Following standard practice, we shall denote<br />
a random variable by capital letters, while the values it<br />
takes will be written in small letters]. The opera<strong>to</strong>r for expectation<br />
value will be denoted either as E[·] or < · >, that<br />
is,<br />
E[f(X)] ≡ 〈f(X)〉 =<br />
∫ ∞<br />
−∞<br />
f(x)p(x)dx, (16)<br />
where f(x) is an arbitrary function. Although the angularbracket<br />
notation for expectation value is preferred by physicists,<br />
we shall often use the E notation which is more convenient<br />
for our purposes.
Brazilian Journal of Physics, vol. 34, no. 3B, September, 2004 1045<br />
A Gaussian or normal distribution with mean m and<br />
standard deviation σ will be denoted by N (m, σ), whose<br />
pdf is<br />
{ }<br />
1<br />
p N (x, t) = √ exp (x − m)2<br />
−<br />
2πσ<br />
2 2σ 2 . (17)<br />
Let us also recall that the (nonzero) moments of the Gaussian<br />
distribution are as follows<br />
E[X] = m, E[X 2 ] = σ 2 , (18)<br />
E[X 2n ] = 1 · 3 · 5 · ... · (2n − 1) σ 2n . (19)<br />
3.2 Brownian motion and white noise<br />
We have seen above that a 1D Brownian motion can be<br />
thought of as the limit of a random walk after infinitely<br />
many infinitesimal steps. This formulation was first given<br />
in 1900 by Bachelier [14] who also showed the connection<br />
between Brownian motion and the diffusion equation (five<br />
years before Einstein’s famous work on the subject [16]). It<br />
is thus telling that the first theory of Brownian motion was<br />
developed <strong>to</strong> model financial asset prices! A rigorous mathematical<br />
theory for the Brownian motion was constructed<br />
by Wiener [17] in 1923, after which the Brownian motion<br />
became also known as the Wiener process.<br />
Definition 2 The standard Brownian motion or Wiener process<br />
{W (t), t ≥ 0} is a s<strong>to</strong>chastic process with the following<br />
properties:<br />
1. W (0) = 0.<br />
2. The increments W (t) − W (s) are stationary and independent.<br />
3. For t > s, W (t) − W (s) has a normal distribution<br />
N (0, √ t − s).<br />
4. The trajec<strong>to</strong>ries are continuous (i.e., “no jumps”).<br />
The stationarity condition implies that the pdf of W (t)−<br />
W (s), for t > s, depends only on the time difference t − s.<br />
(For a more precise definition of stationary processes see<br />
Appendix A.) Now, it is not hard <strong>to</strong> convince oneself that<br />
conditions 2 and 3 imply that W (t) is distributed according<br />
<strong>to</strong> N (0, √ t) for t > 0. In particular, we have E[W (t)] = 0<br />
for all t ≥ 0. Furthermore, one can easily show that the<br />
covariance of the Brownian motion is given by<br />
E[W (t)W (s)] = s, for t > s.<br />
It is also clear from the definition above that the Brownian<br />
motion is a Gaussian process (see Appendix A for the formal<br />
definition of Gaussian processes). Then, since a Gaussian<br />
process is fully characterized by its mean and covariance,<br />
we can give the following alternative definition of the<br />
Brownian motion.<br />
Definition 3 The standard Brownian motion or Wiener process<br />
{W (t), t ≥ 0} is a Gaussian process with E[W (t)] =<br />
0 and E[W (t)W (s)] = min(s, t).<br />
The Brownian motion has the important property of having<br />
bounded quadratic variation. To see what this means,<br />
consider a partition {t i } n i=0 of the interval [0, t], where<br />
0 = t 0 < t 1 < . . . < t n = t. For simplicity, let us take<br />
equally spaced time intervals: t i − t i−1 = ∆t = t n . The<br />
quadratic variation of W (t) on [0, t] is defined as<br />
Q n =<br />
n∑<br />
∆Wi 2 , (20)<br />
i=0<br />
where ∆W i = W (t i ) − W (t i−1 ). Since ∆W i is distributed<br />
according <strong>to</strong> N (0, √ ∆t) we have that E[∆W 2 ] = ∆t,<br />
which implies that<br />
E[Q n ] = t. (21)<br />
Furthermore, using the fact that the increments ∆W i are independent<br />
and recalling that the variance of the sum of independent<br />
variables is the sum of the variances, we get for<br />
the variance of Q n :<br />
⌋<br />
var[Q n ] =<br />
=<br />
n∑<br />
var[∆Wi 2 ] =<br />
i=0<br />
n∑<br />
i=0<br />
n∑ {E[∆Wi 4 ] − ( E[∆Wi 2 ] ) } 2<br />
i=0<br />
[<br />
3(∆t) 2 − (∆t) 2] = 2t2<br />
n ,<br />
⌈<br />
where in the third equality we used (19) and the fact that<br />
∆W i has distribution N (0, √ ∆t). We thus see that<br />
var[Q n ] → 0, as n → ∞. (22)<br />
On the other hand, we have that<br />
[<br />
var[Q n ] = E (Q n − E[Q n ]) 2] [<br />
= E (Q n − t) 2] , (23)<br />
where in the last equality we have used (21). Comparing
1046 Giovani L. Vasconcelos<br />
(22) and (23) then yields<br />
[<br />
lim E (Q n − t) 2] = 0.<br />
n→∞<br />
We have thus proven that Q n converges <strong>to</strong> t in the mean<br />
square sense. This fact suggests that ∆W 2 can be thought<br />
of as being of the order of ∆t, meaning that as ∆t → 0 the<br />
quantity ∆W 2 “resembles more and more” the deterministic<br />
quantity ∆t. In terms of differentials, we write<br />
[dW ] 2 = dt. (24)<br />
Alternatively, we could say that dW is of order √ dt:<br />
dW = O( √ dt). (25)<br />
(I remark parenthetically that the boundedness of the<br />
quadratic variation of the Brownian motion should be<br />
∑<br />
contrasted with the fact that its <strong>to</strong>tal variation, A n =<br />
n<br />
i=0 |∆W i|, is unbounded, that is, A n → ∞ as n → ∞,<br />
with probability 1; see [7].)<br />
<strong>An</strong>other important property of the Brownian motion<br />
W (t) is the fact that it is self-similar (or more exactly selfaffine)<br />
in the following sense:<br />
W (at) d = a 1/2 W (t), (26)<br />
for all a > 0. Here d = means equality in the sense of probability<br />
distribution, that is, the two processes W (at) and<br />
a 1/2 W (t) have exactly the same finite-dimensional distributions<br />
p(x 1 , t 1 ; ..., x n , t n ) for any choice of t i , i = 1, ..., n,<br />
and n ≥ 1. Self-similarity means that any finite portion of<br />
a Brownian motion path when properly rescaled is (statistically)<br />
indistinguishable from the whole path. For example,<br />
if we ‘zoom in’ in any given region (no matter how small)<br />
of a Brownian motion path, by rescaling the time axis by a<br />
fac<strong>to</strong>r of a and the vertical axis by a fac<strong>to</strong>r of √ a, we obtain<br />
a curve similar (statistically speaking) <strong>to</strong> the original path.<br />
<strong>An</strong> example of this is shown in Fig. 7. In the language of<br />
fractals, we say that a trajec<strong>to</strong>ry of a Brownian motion is a<br />
fractal curve with fractal dimension D = 2.<br />
The self-similarity property implies that sample paths of<br />
a Brownian motion are nowhere differentiable (technically,<br />
with probability 1). A formal proof of this fact, although<br />
not difficult, is beyond the scope of the present notes, so that<br />
here we shall content ourselves with the following heuristic<br />
argument. Suppose we try <strong>to</strong> compute the derivative of<br />
W (t) in the usual sense, that is,<br />
dW<br />
dt<br />
∆W<br />
= lim<br />
∆t→0 ∆t<br />
= lim<br />
∆t→0<br />
W (t + ∆t) − W (t)<br />
.<br />
∆t<br />
But since ∆W is of order √ ∆t, it then follows that<br />
∆W<br />
∆t<br />
= O<br />
so that dW/dt = ∞ as ∆t → 0.<br />
( ) 1<br />
√ , (27)<br />
∆t<br />
W(t)<br />
W(t)<br />
80<br />
60<br />
40<br />
20<br />
0<br />
-20<br />
-40<br />
80<br />
70<br />
60<br />
50<br />
40<br />
30<br />
20<br />
0 2000 4000 6000 8000 10000 12000 14000<br />
t<br />
5000 6000 7000 8000<br />
t<br />
Figure 7. Self-similarity of a Brownian motion path. In (a) we plot<br />
a path of a Brownian motion with 15000 time steps. The curve in<br />
(b) is a blow-up of the region delimited by a rectangle in (a), where<br />
we have rescaled the x axis by a fac<strong>to</strong>r 4 and the y axis by a fac<strong>to</strong>r<br />
2. Note that the graphs in (a) and (b) “look the same,” statistically<br />
speaking. This process can be repeated indefinitely.<br />
Although the derivative of W (t) does not exist as a regular<br />
s<strong>to</strong>chastic process, it is possible <strong>to</strong> give a mathematical<br />
meaning <strong>to</strong> dW/dt as a generalized process (in the sense<br />
of generalized functions or distributions). In this case, the<br />
derivative of the W (t) is called the white noise process ξ(t):<br />
ξ(t) ≡ dW dt . (28)<br />
I shall, of course, not attempt <strong>to</strong> give a rigorous definition<br />
of the white noise, and so the following intuitive argument<br />
will suffice. Since according <strong>to</strong> (27) the derivative dW diverges<br />
as √ , a simple power-counting argument suggests<br />
dt<br />
1<br />
dt<br />
that integrals of the form<br />
I(t) =<br />
∫ t<br />
0<br />
g(t ′ )ξ(t ′ )dt ′ , (29)<br />
should converge (in some sense); see below.<br />
In physics, the white noise ξ(t) is simply ‘defined’ as<br />
a ‘rapidly fluctuating function’ [15] (in fact, a generalized<br />
s<strong>to</strong>chastic process) that satisfies the following conditions<br />
〈ξ(t)〉 = 0, (30)<br />
〈ξ(t)ξ(t ′ )〉 = δ(t − t ′ ). (31)
Brazilian Journal of Physics, vol. 34, no. 3B, September, 2004 1047<br />
These two relations give the ‘operational rules’ from which<br />
quantities such as the mean and the variance of the integral<br />
I(t) in (29) can be calculated. It is convenient, however, <strong>to</strong><br />
have an alternative definition of s<strong>to</strong>chastic integrals in terms<br />
of regular s<strong>to</strong>chastic process. Such a construction was first<br />
given by the Japanese mathematician Itô [18].<br />
3.3 Itô s<strong>to</strong>chastic integrals<br />
Using (28), let us first rewrite integral (29) as an “integral<br />
over the Wiener process” W (t):<br />
I(t) =<br />
∫ t<br />
0<br />
g(t ′ )dW (t ′ ). (32)<br />
The idea then is <strong>to</strong> define this integral as a kind of Riemann-<br />
Stieltjes integral. We thus take a partition {t i } n i=0 of the<br />
interval [0, t] and consider the partial sums<br />
⌋<br />
n∑<br />
n∑<br />
I n = g(t i−1 )∆W (t i ) ≡ g(t i−1 )[W (t i ) − W (t i−1 )]. (33)<br />
i=1<br />
i=1<br />
⌈<br />
The function g(t) above must satisfy certain appropriate<br />
conditions [7], the most important one being that g(t) be<br />
a non-anticipating function. This means, in particular, that<br />
the value g(t i−1 ) in (33) is independent of the ‘next increment’<br />
∆W (t i ) of the Brownian motion. [For this reason,<br />
choosing <strong>to</strong> evaluate g(t) at the beginning of the interval<br />
∆t i = t i − t i−1 is a crucial point in the definition of the Itô<br />
s<strong>to</strong>chastic integral. <strong>An</strong>other possible choice is <strong>to</strong> evaluate<br />
g(t) at the mid point t ∗ = (t i−1 + t i )/2, which leads <strong>to</strong> the<br />
Stra<strong>to</strong>novich integral [8]. In these notes I shall only consider<br />
Itô integrals.]<br />
Under the appropriate conditions on g(t), it is then possible<br />
<strong>to</strong> show that the partial sums I n converge in the mean<br />
square sense. That is, there exists a process I(t) such that<br />
[<br />
E (I n − I(t)) 2] → 0 as n → ∞. (34)<br />
Using the fact that g(t) is non-anticipating and that<br />
E [∆W (t)] = 0, it follows immediately from the definition<br />
(33) that I(t) has zero mean:<br />
[∫ t<br />
]<br />
E[I(t)] = E g(t ′ )dW (t ′ ) = 0, (35)<br />
0<br />
It is also possible <strong>to</strong> show that s<strong>to</strong>chastic integrals obey the<br />
so-called isometry property:<br />
[<br />
[<br />
(∫<br />
E {I(t)} 2] t<br />
) 2<br />
]<br />
= E g(t ′ )dW (t ′ )<br />
=<br />
∫ t<br />
0<br />
0<br />
E [ g 2 (t ′ ) ] dt ′ . (36)<br />
We now see that the true meaning of conditions (30) and<br />
(31) is given by properties (35) and (36), for the particular<br />
case when g(t) is a deterministic function.<br />
The Itô integral does not conform <strong>to</strong> the usual integration<br />
rules from deterministic calculus. <strong>An</strong> example is the<br />
formula below<br />
∫ t<br />
which is left as an exercise for the reader [19]. Itô integrals<br />
offer however a convenient way <strong>to</strong> define (and deal with)<br />
s<strong>to</strong>chastic differential equations, as we will see next.<br />
3.4 S<strong>to</strong>chastic differential equations<br />
Physicists are quite familiar with differential equations involving<br />
s<strong>to</strong>chastic terms, such as the Langevin equation<br />
dv<br />
dt<br />
= −γv + σξ(t), (37)<br />
which describes the motion of a Brownian particle in a viscous<br />
liquid [15]. Here γ is the viscosity of the fluid and σ is<br />
the ‘amplitude’ of the fluctuating force acting on the Brownian<br />
particle. (These parameters are usually considered <strong>to</strong> be<br />
constant but in general they could be non-anticipating functions<br />
of time.) Equation (37) does not however make much<br />
mathematical sense, since it evolves a quantity, namely, the<br />
derivative ξ(t) of the Brownian motion, that does not even<br />
exist (except as a generalized process). Nevertheless, it is<br />
possible <strong>to</strong> put this equation on a firm mathematical basis<br />
by expressing it as a s<strong>to</strong>chastic integral equation. First we<br />
rewrite (37) as<br />
which upon integration yields<br />
v(t) = v(0) −<br />
dv = −γvdt + σdW, (38)<br />
∫ t<br />
0<br />
γv(t ′ )dt ′ +<br />
∫ t<br />
0<br />
σdW (t ′ ). (39)<br />
This integral equation now makes perfectly good sense—in<br />
fact, its solution can be found explicitly [19].<br />
Let us now consider more general s<strong>to</strong>chastic differential<br />
equations (SDE) of the form<br />
0<br />
W dW = 1 2 W (t)2 − 1 2 t,<br />
dX = a(X, t)dt + b(X, t)dW, (40)
1048 Giovani L. Vasconcelos<br />
where a(x, t) and B(x, t) are known functions. Note that<br />
this ‘differential equation’ is actually a short-hand notation<br />
for the following s<strong>to</strong>chastic integral equation<br />
X(t) = X(0)+<br />
∫ t<br />
0<br />
a(X, t ′ )dt ′ +<br />
∫ t<br />
0<br />
b(X, t ′ )dW (t ′ ). (41)<br />
Under certain condition on the functions a(x, t) and b(x, t),<br />
it is possible <strong>to</strong> show (see, e.g., [8]) that the SDE (40) has a<br />
unique solution X(t).<br />
Let us discuss another simple SDE, namely, the Brownian<br />
motion with drift:<br />
dX = µdt + σdW, (42)<br />
where the constant µ represents the mean drift velocity. Integrating<br />
(42) immediately yields the process<br />
whose pdf is<br />
X(t) = µt + W (t), (43)<br />
p(x, t) = 1 { } (x − µt)<br />
2<br />
2πσ 2 t exp 2σ 2 . (44)<br />
t<br />
<strong>An</strong>other important example of a (linear) SDE that can be<br />
solved explicitly is the geometric Brownian motion that will<br />
be discussed shortly. But before doing that, let us discuss a<br />
rather useful result known as Itô lemma or Itô formula.<br />
3.5 Itô formula<br />
Consider the generic process X(t) described by the SDE<br />
(40), and suppose that we have a new s<strong>to</strong>chastic process Z<br />
defined by<br />
Z(t) = F (X(t), t), (45)<br />
for some given function F (x, t). We now wish <strong>to</strong> find the local<br />
dynamics followed by the Z(t), that is, the SDE whose<br />
solutions corresponds <strong>to</strong> the process Z(t) above. The answer<br />
is given by the Itô formula that we now proceed <strong>to</strong><br />
derive.<br />
First, consider the Taylor expansion of the function<br />
F (X, t):<br />
dF = ∂F ∂F<br />
dt +<br />
∂t ∂x dX + 1 ∂ 2 F<br />
2 ∂x 2 (dX)2 +<br />
+ 1 ∂ 2 F<br />
2 ∂t 2 (dt)2 + 1 ∂ 2 F<br />
dtdX + ... (46)<br />
2 ∂t∂x<br />
Note, however, that<br />
(dX) 2 = b 2 dW 2 + 2ab dtdW + a 2 (dt) 2<br />
= b 2 dt + O(dt 3/2 ), (47)<br />
where we used the fact that dW 2 = dt and dtdW =<br />
O(dt 3/2 ). (Here we have momentarily omitted the arguments<br />
of the functions a and b for ease of notation.) Inserting<br />
(47) in<strong>to</strong> (46) and retaining only terms up <strong>to</strong> order<br />
dt, we obtain<br />
[ ∂F<br />
dF =<br />
∂t + 1 ]<br />
2 b2 ∂2 F<br />
∂x 2 dt + b ∂F dX, (48)<br />
∂x<br />
which is known as Itô formula. Upon using (40) in the equation<br />
above, we obtain Itô formula in a more explicit fashion<br />
[ ∂F<br />
dF = + a(X, t)∂F<br />
∂t ∂x + 1 ]<br />
2 b2 (X, t) ∂2 F<br />
∂x 2 dt<br />
+ b(X, t) ∂F dW, (49)<br />
∂x<br />
What is noteworthy about this formula is the fact that the<br />
fluctuating part of the primary process X(t) contributes <strong>to</strong><br />
the drift of the derived process Z(t) = F (t, X) through the<br />
term 1 2 b2 (t, X) ∂2 F<br />
∂x<br />
. We shall next use Itô formula <strong>to</strong> solve<br />
2<br />
explicitly a certain class of linear SDE’s.<br />
3.6 Geometric Brownian motion<br />
A s<strong>to</strong>chastic process of great importance in Finance is the<br />
so-called geometric Brownian notion, which is defined as<br />
the solution <strong>to</strong> the following SDE<br />
dS = µSdt + σSdW, (50)<br />
where µ and σ are constants, subjected <strong>to</strong> a generic initial<br />
condition S(t 0 ) = S 0 . Let us now perform the following<br />
change of variables Z = ln S. Applying Itô formula (49)<br />
with a = µS, b = σS and F (S) = ln S, it then follows that<br />
dZ =<br />
(µ − 1 )<br />
2 σ2 dt + σdW, (51)<br />
which upon integration yields<br />
Z(t) = Z 0 +<br />
(µ − 1 )<br />
2 σ2 (t−t 0 )+σ[W (t)−W (t 0 )], (52)<br />
where Z 0 = ln S 0 . Reverting <strong>to</strong> the variable S we obtain the<br />
explicit solution of the SDE (50):<br />
S(t) = S 0 exp<br />
{(µ − 1 )<br />
}<br />
2 σ2 (t − t 0 ) + σ[W (t) − W (t 0 )] .<br />
(53)<br />
From (52) we immediately see that Z(t) − Z 0 is distributed<br />
according <strong>to</strong> N (( µ − 1 2 σ2) τ, σ √ τ ) , where τ =<br />
t − t 0 . It then follows that the geometric Brownian motion<br />
with initial value S(t 0 ) = S 0 has the following log-normal<br />
distribution:
Brazilian Journal of Physics, vol. 34, no. 3B, September, 2004 1049<br />
⎧ [ ( ) ⎪⎨ S<br />
1<br />
ln<br />
p(S, t; S 0 , t 0 ) = √<br />
2σ2 τS exp S 0<br />
− (µ − 1 2 σ2 )τ<br />
−<br />
⎪ ⎩ 2σ 2 τ<br />
] 2<br />
⎫<br />
⎪⎬<br />
⎪⎭ . (54)<br />
⌈<br />
The geometric Brownian motion is the basic model for s<strong>to</strong>ck<br />
price dynamics in the Black-Scholes framework, <strong>to</strong> which<br />
we now turn.<br />
4 The Standard Model of Finance<br />
4.1 Portfolio dynamics and arbitrage<br />
Consider a financial market with only two assets: a riskfree<br />
bank account B and a s<strong>to</strong>ck S. In vec<strong>to</strong>r notation,<br />
we write S(t) ⃗ = (B(t), S(t)) for the asset price vec<strong>to</strong>r at<br />
time t. A portfolio in this market consists of having an<br />
amount x 0 in the bank and owing x 1 s<strong>to</strong>cks. The vec<strong>to</strong>r<br />
⃗x(t) = (x 0 (t), x 1 (t)) thus describes the time evolution of<br />
your portfolio in the (B, S) space. Note that x i < 0 means<br />
a short position on the ith asset, i.e., you ‘owe the market’<br />
|x i | units of the ith asset. Let us denote by V ⃗x (t) the money<br />
value of the portfolio ⃗x(t):<br />
V ⃗x = ⃗x · ⃗S = x 0 B + x 1 S, (55)<br />
where the time dependence has been omitted for clarity. We<br />
shall also often suppress the subscript from V ⃗x (t) when there<br />
is no risk of confusion about <strong>to</strong> which portfolio we are referring.<br />
A portfolio is called self-financing if no money is taken<br />
from it for ‘consumption’ and no additional money is invested<br />
in it, so that any change in the portfolio value comes<br />
solely from changes in the asset prices. More precisely, a<br />
portfolio ⃗x is self-financing if its dynamics is given by<br />
dV ⃗x (t) = ⃗x(t) · d ⃗ S(t), t ≥ 0. (56)<br />
The reason for this definition is that in the discrete-time<br />
case, i.e., t = t n , n = 0, 1, 2, ..., the increase in wealth,<br />
∆V (t n ) = V (t n+1 ) − V (t n ), of a self-financing portfolio<br />
over the time interval t n+1 − t n is given by<br />
∆V (t n ) = ⃗x(t n ) · ∆ ⃗ S(t n ), (57)<br />
where ∆ ⃗ S(t n ) ≡ ⃗ S(t n+1 ) − ⃗ S(t n ). This means that over<br />
the time interval t n+1 − t n the value of the portfolio varies<br />
only owing <strong>to</strong> the changes in the asset prices themselves, and<br />
then at time t n+1 re-allocate the assets within the portfolio<br />
for the next time period. Equation (56) generalizes this idea<br />
for the continuous-time limit. If furthermore we decide on<br />
the make up of the portfolio by looking only at the current<br />
prices and not on past times, i.e., if<br />
⃗x(t) = ⃗x(t, ⃗ S(t)),<br />
then the portfolio is said <strong>to</strong> be Markovian. Here we shall<br />
deal exclusively with Markovian portfolios.<br />
As we have seen already in Sec. 2.4, an arbitrage represents<br />
the possibility of making a riskless profit with no<br />
initial commitment of money. A more formal definition of<br />
arbitrage is as follows.<br />
Definition 4 <strong>An</strong> arbitrage is a portfolio whose value V (t)<br />
obeys the following conditions<br />
(i) V (0) = 0<br />
(ii) V (t) ≥ 0 with probability 1 for all t > 0<br />
(iii) V (T ) > 0 with positive probability for some T > 0.<br />
The meaning of the first condition is self-evident. The<br />
second condition says that there is no chance of losing<br />
money, while the third one states that there is a possibility<br />
that the portfolio will acquire a positive value at some time<br />
T . Thus, if you hold this portfolio until this arbitrage time<br />
there is a real chance that you will make a riskless profit<br />
out of nothing. [If P (V (T ) > 0) = 1 we have a strong<br />
arbitrage opportunity, in which case we are sure <strong>to</strong> make a<br />
profit.] As we have already discussed in Sec. 2.4, arbitrage<br />
opportunities are very rare and can last only for a very short<br />
time (typically, of the order of seconds or a few minutes at<br />
most). In fact, in the famous Black-Scholes model that we<br />
will now discuss it is assumed that there is no arbitrage at<br />
all.<br />
4.2 The Black-Scholes model for option pricing<br />
The two main assumptions of the Black-Scholes model are:<br />
(i) There are two assets in the market, a bank account B<br />
and a s<strong>to</strong>ck S, whose price dynamics are governed by<br />
the following differential equations<br />
dB = rBdt, (58)<br />
dS = µSdt + σSdW , (59)<br />
where r is the risk-free interest rate, µ > 0 is the s<strong>to</strong>ck<br />
mean rate of return, σ > 0 is the volatility, and W (t)<br />
is the standard Brownian motion or Wiener process.<br />
(ii) The market is free of arbitrage.
1050 Giovani L. Vasconcelos<br />
Besides these two crucial hypothesis, there are additional<br />
Inserting this back in<strong>to</strong> (62), we then find<br />
We can now eliminate the risk [i.e., the s<strong>to</strong>chastic term<br />
Now from (68) and (70) we get that<br />
containing dW ] from this portfolio by choosing<br />
∆ = ∂C<br />
∂S . (63) x = 1 [<br />
C − S ∂C ]<br />
B , (72)<br />
simplifying (technical) assumptions, such as: (iii)<br />
there is a liquid market for the underlying asset S as well<br />
as for the derivative one wishes <strong>to</strong> price, (iv) there are no<br />
[ ∂C<br />
dΠ =<br />
∂t + 1 ]<br />
2 σ2 S 2 ∂2 C<br />
∂S 2 dt. (64)<br />
transaction costs (i.e., no bid-ask spread), and (v) unlimited<br />
short selling is allowed for an unlimited period of time. It<br />
is implied by (58) that there is no interest-rate spread either,<br />
that is, money is borrowed and lent at the same rate r. Equation<br />
Since we now have a risk-free (i.e., purely deterministic)<br />
portfolio, it must yield the same rate of return as the bank<br />
account, which means that<br />
(59) also implies that the s<strong>to</strong>ck pays no dividend. [This<br />
last assumption can be relaxed <strong>to</strong> allow for dividend payments<br />
dΠ = rΠdt. (65)<br />
at a known (i.e., deterministic) rate; see, e.g., [4] for<br />
details.]<br />
We shall next describe how derivatives can be ‘rationally’<br />
Comparing (64) with (65) and using (61) and (63), we then<br />
obtain the Black-Scholes equation:<br />
priced in the Black-Scholes model. We consider first<br />
a European call option for which a closed formula can be<br />
∂C<br />
found. (More general European contingent claims will be<br />
∂t + 1 2 σ2 S 2 ∂2 C ∂C<br />
+ rS − rC = 0,<br />
∂S2 ∂S<br />
(66)<br />
briefly considered at the end of the Section.) Let us then denote<br />
by C(S, t; K, T ) the present value of a European call<br />
which must be solved subjected <strong>to</strong> the following boundary<br />
condition<br />
option with strike price K and expiration date T on the underlying<br />
s<strong>to</strong>ck S. For ease of notation we shall drop the<br />
C(S, T ) = max(S − K, 0). (67)<br />
parameters K and T and simply write C(S, t). For later<br />
The solution <strong>to</strong> the above boundary-value problem can be<br />
use, we note here that according <strong>to</strong> Itô formula (49), with<br />
found explicitly (see below), but before going in<strong>to</strong> that it is<br />
a = µS and b = σS, the option price C obeys the following<br />
instructive <strong>to</strong> consider an alternative derivation of the BSE.<br />
dynamics<br />
[Note that the above derivation of the BSE remains valid<br />
[ ∂C ∂C<br />
dC = + µS<br />
∂t ∂S + 1 ]<br />
2 σ2 S 2 ∂2 C<br />
∂S 2 dt + σS ∂C<br />
∂S dW. also in the case that r, µ, and, σ are deterministic functions<br />
of time, although a solution in closed form is no longer possible.]<br />
(60)<br />
In what follows, we will arrive at a partial differential<br />
equation, the so-called Black-Scholes equation (BSE), for<br />
the option price C(S, t). For pedagogical reasons, we will<br />
4.2.2 The replicating portfolio<br />
present two alternative derivations of the BSE using two distinct<br />
but related arguments: i) the ∆-hedging portfolio and the (B, S) market that replicates the option C(S, t), and in<br />
Here we will show that it is possible <strong>to</strong> form a portfolio on<br />
ii) the replicating portfolio.<br />
the process of doing so we will arrive again at the BSE.<br />
Suppose then that there is indeed a self-financing portfolio<br />
4.2.1 The delta-hedging portfolio<br />
⃗x(t) = (x(t), y(t)), whose value Z(t) equals the option<br />
As in the binomial model of Sec. 2.5, we consider the selffinancing<br />
∆-hedging portfolio, consisting of a long position<br />
on the option and a short position on ∆ s<strong>to</strong>cks. The value<br />
price C(S, t) for all time t ≤ T :<br />
Z ≡ xB + yS = C, (68)<br />
Π(t) of this portfolio is<br />
Π(t) = C(S, t) − ∆ S.<br />
where we have omitted the time-dependence for brevity.<br />
Since the portfolio is self-financing it follows that<br />
Since the portfolio is self-financing, it follows from (56) that<br />
Π obeys the following dynamics<br />
dZ = xdB + ydS = (rxB + µyS)dt + σySdW. (69)<br />
dΠ = dC − ∆ dS, (61)<br />
But by assumption we have Z = C and so dZ = dC.<br />
Comparing (69) with (60) and equating the coefficients separately<br />
which in view of (59) and (60) becomes<br />
in both dW and dt, we obtain<br />
[ ∂C ∂C<br />
dΠ = + µS<br />
∂t ∂S + 1 ]<br />
2 σ2 S 2 ∂2 C<br />
∂S 2 − µ∆S dt<br />
y = ∂C<br />
( )<br />
∂S , (70)<br />
∂C<br />
+ σS<br />
∂S − ∆ dW. (62)<br />
∂C<br />
∂t − rxB + 1 2 σ2 S 2 ∂2 C<br />
= 0. (71)<br />
∂S2
Brazilian Journal of Physics, vol. 34, no. 3B, September, 2004 1051<br />
which inserted in<strong>to</strong> (71) yields again the BSE (66), as the<br />
reader can easily verify.<br />
= I(β) − I(α), (79)<br />
Inserting (77) in<strong>to</strong> the integral above we obtain<br />
To state this fact more precisely, let F (S, t) represent the<br />
price of an arbitrary European contingent claim with payoff<br />
∫<br />
1 ∞ (<br />
u(τ, x) = √ e βx′ − e αx′) e −(x−x′ ) 2 /4τ dx ′ F (S, T ) = Φ(S), where Φ is a known function. Retracing<br />
4πτ the steps outlined in Sec. 4.2.2, we immediately conclude<br />
We have thus proven, by direct construction, that the option<br />
C can be replicated in the (B, S)-market by the portfolio<br />
where<br />
(x, y), where x and y are given in (72) and (70), re-<br />
spectively, with option price C being the solution of the<br />
I(a) ≡ 1 ∫ ∞<br />
√ e ax′ e −(x−x′ ) 2 /4τ dx ′ .<br />
BSE (with the corresponding boundary condition). [To complete<br />
4πτ 0<br />
(80)<br />
the proof, we must also show that the initial price After completing the squares and performing some simplifi-<br />
C 0 = C(S, 0) is the ‘correct’ one, in the sense that if the option<br />
cation, we find that<br />
price were C 0 ′ ≠ C 0 , then there would be an arbitrage<br />
opportunity. In fact, if C 0 ′ > C 0 an arbitrageur should short<br />
the option and invest in the replicating portfolio, whereas if<br />
I(a) = e ax+a2τ N(d a ), (81)<br />
C 0 ′ < C 0 he should do the opposite.]<br />
where<br />
d a = x √ + 2aτ , (82)<br />
2τ<br />
4.3 The Black-Scholes formula<br />
and N(x) denotes the cumulative distribution function for a<br />
Here we will solve equation (66) subjected <strong>to</strong> the boundary normal variable N (0, 1):<br />
condition (67). Following the original work of Black and<br />
Scholes [12], the idea is <strong>to</strong> perform a change of variables so<br />
N(x) = 1 ∫ x<br />
√ e −s2 /2 ds. (83)<br />
as <strong>to</strong> turn the BSE in<strong>to</strong> the heat equation, which we know<br />
2π −∞<br />
how <strong>to</strong> solve. Here we will not use the original transformation<br />
employed by these authors but a related one [6], as Inserting (81) in<strong>to</strong> (79) and reverting back <strong>to</strong> the original<br />
shown below:<br />
dimensional variables, we obtain the famous Black-Scholes<br />
τ = T − t ( )<br />
formula for the price of a European call option:<br />
S<br />
2/σ 2 , x = ln , (73)<br />
K<br />
C(S, t) = SN(d 1 ) − Ke −r(T −t) N(d 2 ), (84)<br />
u(x, τ) = e αx+β2 τ C(S, t)<br />
K , (74) where<br />
where<br />
d 1 = ln ( ) (<br />
S<br />
K + r +<br />
1<br />
2 σ2) (T − t)<br />
α = 1 ( ) 2r<br />
2 σ 2 − 1 , β = 1 ( )<br />
σ √ , (85)<br />
T − t<br />
2r<br />
2 σ 2 + 1 . (75)<br />
(86)<br />
After a somewhat tedious but straightforward algebra<br />
d 2 = ln ( ) (<br />
S<br />
K + r −<br />
1<br />
2 σ2) (T − t)<br />
σ √ . (87)<br />
T − t<br />
[6], one obtains that in the new variables equation (66) reads<br />
This formula is so often used in practice that it is already<br />
∂u<br />
∂τ = ∂2 u<br />
∂x 2 , (76) pre-defined in many software packages (e.g., Excel, Matlab,<br />
Maple, etc) as well as in most modern hand calcula<strong>to</strong>rs<br />
while the terminal condition (67) becomes an initial condition<br />
with financial functions. It should noted, however, that many<br />
u(x, 0) = u 0 (x) = max ( e βx − e αx , 0 ) people (academics and practitioners alike) believe that the<br />
. (77) Black-Scholes model is <strong>to</strong>o idealized <strong>to</strong> describe real market<br />
situations; see Secs. V and VII for a brief discussion of<br />
We now recall that the Green’s function for the heat possible extensions of the BS model.<br />
equation is<br />
G(x, x ′ ) = √ 1 e −(x−x′ ) 2 /4τ ,<br />
4.4 Completeness in the Black-Scholes model<br />
4πτ<br />
We have seen above that it is possible <strong>to</strong> replicate a European<br />
so that its generic solution for an arbitrary initial condition<br />
call option C(S, t) using an appropriate self-financing<br />
u 0 (x) is given by<br />
portfolio in the (B, S) market. Looking back at the argument<br />
∫ ∞<br />
given in Sec. 4.2.2, we see that we never actually<br />
u(x, τ) = u 0 (x ′ )G(x, x ′ )dx ′<br />
made use of the fact that the derivative in question was a call<br />
=<br />
−∞ ∫<br />
1 ∞<br />
option—the nature of the derivative appeared only through<br />
√ u 0 (x ′ )e −(x−x′ ) 2 /4τ dx ′ . (78) the boundary condition (67). Thus, the derivation of the BSE<br />
4πτ −∞<br />
presented there must hold for any contingent claim!<br />
0
1052 Giovani L. Vasconcelos<br />
that the price F (S, t) will be the solution <strong>to</strong> the following<br />
boundary-value problem<br />
∂F<br />
∂t + 1 2 σ2 S 2 ∂2 F ∂F<br />
+ rS − rF = 0<br />
∂S2 ∂S<br />
, (88)<br />
F (S, T ) = Φ(S) . (89)<br />
Furthermore, if we repeat the arguments of preceding subsection<br />
and transform the Black-Scholes equation (88) in<strong>to</strong><br />
the heat equation, we obtain that F (S, t) will be given by<br />
F (S, t) = 1 √<br />
4πτ<br />
∫ ∞<br />
−∞<br />
Φ(x ′ )e −(x−x′ ) 2 /4τ dx ′ , (90)<br />
where Φ(x) denotes the payoff function in terms of the dimensionless<br />
variable x; see (73). Expressing this result in<br />
terms of the original variables S and t yields a generalized<br />
Black-Scholes formula<br />
F (S, t) =<br />
−r(T −t)<br />
e<br />
√<br />
2πσ2 (T − t)<br />
⌋<br />
∫ ∞<br />
0<br />
Φ(S ′ )e [ln (<br />
⌈<br />
S ′ )<br />
S −(r− 1 2 σ2 )(T −t)] 2 dS ′<br />
S ′ . (91)<br />
In summary, we have shown above that the Black-<br />
Scholes model is complete. A market is said <strong>to</strong> be complete<br />
if every contingent claim can be replicated with a<br />
self-financing portfolio on the primary assets. Our ‘proof<br />
of completeness’ given above is, of course, valid only for<br />
the case of European contingent claims with a simple payoff<br />
function Φ(S); it does not cover, for instance, pathdependent<br />
derivatives. It is possible however <strong>to</strong> give a formal<br />
proof that arbitrage-free models, such as the Black-<br />
Scholes model, are indeed complete; see Sec. 5.3.<br />
Comparing the generalized Black-Scholes formula (91)<br />
with the pdf of the geometric Brownian motion given in<br />
(54), we see that the former can be written in a convenient<br />
way as<br />
F (S, t) = e −r(T −t) E Q t,S [Φ(S T )], (92)<br />
where E Q t,S<br />
[·] denotes expectation value with respect <strong>to</strong> the<br />
probability density of a geometric Brownian motion with<br />
µ = r, initial time t, final time T , and initial value S; see<br />
(54). In other words, the present value of a contingent claim<br />
can be computed simply as its discounted expected value<br />
at maturity, under an appropriate probability measure. This<br />
idea will become more clear after we discuss the notion of<br />
an equivalent martingale measure.<br />
5 Efficient markets: the martingale<br />
approach<br />
5.1 Martingales<br />
The concept of a martingale plays a important rôle in finance<br />
[20]. Unfortunately, a proper introduction <strong>to</strong> martingales requires<br />
some knowledge of probability measure theory [21].<br />
Here however we will give a rather intuitive discussion of<br />
martingales. For completeness we have listed in Appendix<br />
A some basic concepts from probability theory that would<br />
be required <strong>to</strong> make the following discussion more rigorous.<br />
We begin by recalling that a probability space is a triple<br />
(Ω, F, P ), where<br />
• Ω is the space of elementary events or outcomes ω.<br />
• F is a properly chosen family of subsets of Ω, (i.e., a<br />
σ-algebra on Ω).<br />
• P is a probability measure on F.<br />
In Finance, an outcome ω is a ‘market situation.’ The<br />
family of subsets F specifies the class of events <strong>to</strong> which<br />
probabilities can be assigned. This is done through the<br />
concept of a σ-algebra, whose formal definition is given<br />
in Appendix A. A probability measure P on F is simply<br />
a function P : F → [0, 1], satisfying a few ‘obvious requirements’:<br />
P (∅) = 0, P (Ω) = 1, and P (A 1 ∪ A 2 ) =<br />
P (A 1 ) + P (A 2 ) if A 1 ∩ A 2 = ∅. <strong>An</strong> element A of F,<br />
A ∈ F, is called a “measurable set” or “observable event,”<br />
meaning that it is possible <strong>to</strong> assign a “probability of occurrence,”<br />
P (A) ∈ [0, 1], for this event. Hence, F is said <strong>to</strong> be<br />
the set of ‘observable events.’<br />
Suppose now that we have a random function X :<br />
Ω → R. If <strong>to</strong> every subset of Ω of the form {ω : a ≤<br />
X(ω) ≤ b} there corresponds an event A ⊂ F, then the<br />
function X is said <strong>to</strong> be measurable with respect <strong>to</strong> F or<br />
simply F-measurable. What this means is that it is possible<br />
<strong>to</strong> ‘measure’ (i.e., assign a probability <strong>to</strong>) events of<br />
the form {a ≤ X ≤ b} through the obvious definition:<br />
P ({a ≤ X ≤ b}) ≡ p(A). A F-measurable function X<br />
is called a random variable.<br />
Let us next consider the notion of an “information flow.”<br />
In a somewhat abstract way, we will represent the information<br />
available <strong>to</strong> an observer up <strong>to</strong> time t as a σ-algebra<br />
F t ⊂ F. In the context of Finance, the information set<br />
F t would contain, for instance, the price his<strong>to</strong>ry up <strong>to</strong> time<br />
t of all assets in the economy. It is natural <strong>to</strong> assume that<br />
F s ⊂ F t for s ≤ t, since we expect that, as time goes on,<br />
we gain new information (and do not discard the old ones).<br />
Such a collection of σ-algebras represents an “information<br />
flow,” or, more technically, a filtration.<br />
Definition 5 A filtration or information flow is a collection<br />
{F t } t≥0 of σ-algebras F t ⊂ F such that<br />
F s ⊂ F t , for 0 ≤ s ≤ t.
Brazilian Journal of Physics, vol. 34, no. 3B, September, 2004 1053<br />
Suppose now we have a s<strong>to</strong>chastic process X t defined on<br />
(Ω, F, P ). (Think of X t as being, say, the price of a given<br />
s<strong>to</strong>ck.) If the values of X t can be completely determined<br />
from the information F t , for all t ≥ 0, then the process X t<br />
is said <strong>to</strong> be adapted <strong>to</strong> the filtration {F t } t≥0 .<br />
Definition 6 The process X t is adapted <strong>to</strong> the filtration<br />
{F t } t≥0 if X t is F t -measurable for all t ≥ 0.<br />
A s<strong>to</strong>chastic process X t naturally generates an information<br />
flow, denoted by Ft<br />
X , which represents the “information<br />
contained in the trajec<strong>to</strong>ries of X(t) up <strong>to</strong> time t.” A<br />
process X(t) is obviously adapted <strong>to</strong> its natural filtration<br />
Ft X .<br />
A last piece of mathematics is necessary <strong>to</strong> define a martingale,<br />
namely, the notion of conditional expectation. This<br />
appears in connection with the crucial question of how the<br />
information, F t0 , available at present time influences our<br />
knowledge about future values of X(t). If X(t) and F t0<br />
are not independent, then it is reasonable <strong>to</strong> expect that the<br />
information available up <strong>to</strong> the present time reduces the uncertainty<br />
about the future values of X(t). To reflect this<br />
gain of information is useful <strong>to</strong> introduce a new s<strong>to</strong>chastic<br />
process<br />
Z(t) = E[X t |F t0 ], t > t 0 ,<br />
where the symbol E[X t |F t0 ] represents “the expected value<br />
of X t , contingent on the information gathered up <strong>to</strong> time t 0 .”<br />
A precise definition of conditional expectation is beyond<br />
the scope of these notes. Here it will suffice <strong>to</strong> say that given<br />
a random variable Y on a probability space (Ω, F, P ) and<br />
another σ-algebra F ′ ⊂ F, it is possible <strong>to</strong> define a random<br />
variable Z = E[Y |F ′ ], which represents “the expected<br />
value of Y , given the information contained in F ′ .” The<br />
variable Z is a coarser version of the original variable Y , in<br />
the sense that we have used the information on F ′ <strong>to</strong> reduce<br />
the uncertainty about Y . The following two properties of<br />
conditional expectations will be necessary later:<br />
E[Y |F t ] = Y, if Y is F t -measurable. (93)<br />
E[E[Y |F t ]] = E[Y ]. (94)<br />
The first property above is somewhat obvious: if Y is F t -<br />
measurable then Y and F t ‘contain the same information,’<br />
hence taking expectation of Y conditional <strong>to</strong> F t does not reduce<br />
the uncertainty about Y . The second property is the<br />
so-called law of iterated expectations, and basically represents<br />
the law of <strong>to</strong>tal probability.<br />
After these mathematical preliminaries, we are now in a<br />
position <strong>to</strong> define martingales.<br />
Definition 7 A s<strong>to</strong>chastic process M t is called a martingale<br />
with respect <strong>to</strong> the filtration {F t } t≥0 if<br />
(i) M t is adapted <strong>to</strong> the filtration {F t } t≥0<br />
(ii) E[|M t |] < ∞ for all t ≥ 0<br />
(iii) E[M t |F t0 ] = M t0 for all t ≥ t 0<br />
Condition (i) simply says that M t can be determined<br />
from the information available up <strong>to</strong> time t, whereas condition<br />
(ii) is a technicality. The defining property of a martingale<br />
is therefore condition (iii), which is usually referred<br />
<strong>to</strong> as the martingale condition. It says that the best prediction<br />
of future values of the process M(t), contingent on the<br />
information available at the present time, is the current value<br />
M t0 .<br />
Because of property (iii), a martingale is usually described<br />
as a “fair game.” To see why this is so, suppose that<br />
M n represents the fortune of a gambler at time n. (For convenience<br />
let us assume here that time is discrete.) The difference<br />
h n = M n −M n−1 is then the amount the gambler wins<br />
on the nth play (a negative win is of course a loss). Now let<br />
us compute the gambler’s expected gain on the (n + 1)th<br />
play, given the information up <strong>to</strong> time n:<br />
E[h n+1 |F n ] = E[M n+1 − M n |F n ]<br />
= E[M n+1 |F n ] − E[M n |F n ]<br />
= M n − M n<br />
= 0, (95)<br />
where in the third equality we used the martingale property<br />
and rule (93). We thus have that at each new play of the<br />
game the expected gain is null, and in this sense it is a “fair”<br />
game.<br />
A Brownian motion W (t) is a martingale with respect<br />
<strong>to</strong> its natural filtration. To show this, we only need <strong>to</strong> verify<br />
the martingale condition (since the other two conditions are<br />
trivially fulfilled):<br />
E[W (t)|F t0 ] = E[W (t) − W (t 0 ) + W (t 0 )|F t0 ]<br />
= E[W (t) − W (t 0 )|F t0 ] + E[W (t 0 )|F t0 ]<br />
= 0 + W (t 0 )<br />
= W (t 0 ). (96)<br />
In the third equality above we used the fact that the increments<br />
W (t) − W (t 0 ) are independent of F t0 and have zero<br />
mean, <strong>to</strong>gether with property (93). It is also possible <strong>to</strong><br />
show that Itô s<strong>to</strong>chastic integrals are martingales. Indeed,<br />
the theory of s<strong>to</strong>chastic integration is intimately connected<br />
with martingale theory [5].<br />
<strong>An</strong>other important property of martingales is that their<br />
expected value remains constant in time:<br />
E[M 0 ] = E[E[M t |F 0 ]] = E[M t ],<br />
where in first equality we used the martingale property,<br />
while in the second equality property (94) was used. Thus,<br />
a necessary (but not sufficient) condition for a process <strong>to</strong><br />
be a martingale is that it have no drift. Therefore, a diffusion<br />
process of the form (40) is not a martingales unless the<br />
drift term vanishes. For this reason, the geometric Brownian<br />
motion (50) is not a martingale. It is possible, however,<br />
<strong>to</strong> introduce a new probability measure Q, with respect <strong>to</strong><br />
which the geometric Brownian motion becomes a standard<br />
Brownian motion and hence a martingale, as discussed next.
1054 Giovani L. Vasconcelos<br />
5.2 Equivalent martingale measures<br />
Recall that a probability measure P on a measurable space<br />
(Ω, F) is a function P : F → [0, 1] that assigns <strong>to</strong> every<br />
event A ⊂ F a real number P (A) ∈ [0, 1]. Suppose now<br />
we have another probability measure Q defined on the same<br />
space (Ω, F). We say that the probability measures P and<br />
Q are equivalent if the following condition is satisfied:<br />
Q(A) = 0 ⇐⇒ P (A) = 0, for all A ∈ F. (97)<br />
To get a better grasp on the meaning of the condition above,<br />
consider a random variable X [on (Ω, F, P )]. If Q is a probability<br />
measure equivalent <strong>to</strong> P , then condition (97) implies<br />
that there exists a function ρ(X) such that expected values<br />
w.r.t Q are calculated in the following way<br />
E Q [g(X)] = E P [ρ(X)g(X)], (98)<br />
where g(x) is an arbitrary function. Alternatively, we may<br />
write (98) in terms of probability densities:<br />
f Q (x) = ρ(x)f P (x), (99)<br />
where f P (x) denotes the probability density of X w.r.t the<br />
measure P and f Q (x) is the density w.r.t Q. (The function<br />
ρ(x) is called the Radon-Nikodym derivative of measure Q<br />
with respect <strong>to</strong> measure P [21].)<br />
Consider now the Brownian motion with drift<br />
˜W (t) = at + W (t), 0 ≤ t ≤ T (100)<br />
where a is some constant. (The finite-horizon condition<br />
t < T is a technicality that is not relevant for our purposes.)<br />
As already noted, ˜W (t) is not a martingale (since<br />
its expected value is not constant). However, there is an<br />
equivalent probability measure Q, with respect <strong>to</strong> which the<br />
process ˜W (t) becomes the standard Brownian motion (and<br />
hence a martingale). This result is known as Girsanov theorem.<br />
Theorem 1 (Girsanov theorem) The process ˜W (t) given<br />
in (100) is a standard Brownian motion with respect <strong>to</strong> the<br />
probability measure Q defined by<br />
where M t is the process<br />
{<br />
M t = exp −aW t − 1 }<br />
2 a2 t<br />
f Q (˜x, t) = M t (˜x)f P (˜x, t), (101)<br />
{<br />
= exp −a ˜W t + 1 }<br />
2 a2 t .<br />
(102)<br />
Proof. For a formal proof see, e.g., [8]. Here we shall only<br />
sketch a proof of the fact that the process ˜W (t) is indeed<br />
distributed according <strong>to</strong> N (0, √ t), as the standard Brownian<br />
motion. First recall from (44) that the probability density<br />
f P (˜x, t) of ˜W (t) under the original measure P is<br />
f P (˜x, t) = 1 √<br />
2t<br />
exp<br />
{−<br />
(˜x − at)2<br />
2t<br />
}<br />
. (103)<br />
Now according <strong>to</strong> (101) and (102) we have that<br />
f Q (˜x, t) = e −a˜x+ 1 2 a2t f P (˜x, t). (104)<br />
Inserting (103) in<strong>to</strong> (104) then yields<br />
f Q (˜x, t) = 1 √<br />
2t<br />
e −˜x2 /2t , (105)<br />
which is precisely the pdf for the standard Brownian motion.<br />
Q.E.D.<br />
One of the main applications of change of measures is <strong>to</strong><br />
eliminate the drift in s<strong>to</strong>chastic differential equations, so that<br />
with respect <strong>to</strong> the new measure Q the process is a martingale.<br />
The measure Q is then called an equivalent martingale<br />
measure. Constructing the equivalent martingale measure<br />
for an arbitrary SDE of the form (41) is a rather complicated<br />
procedure [5]. One important exception are linear SDE’s<br />
where the Girsanov theorem gives the measure transformation<br />
in an explicit form, as shown below.<br />
Consider the geometric Brownian motion discussed in<br />
Sec. 3.6. For technical reasons [8], let us restrict ourselves<br />
<strong>to</strong> its finite-horizon version:<br />
dS = µSdt + σSdW, t < T. (106)<br />
where µ and σ are positive constants. This equation can then<br />
be rewritten as<br />
( µ<br />
)<br />
dS = σS<br />
σ dt + dW = σSd ˜W , (107)<br />
where<br />
˜W t = (µ/σ)t + W t , t < T. (108)<br />
Now, according <strong>to</strong> Girsanov theorem, ˜Wt is a standard<br />
Brownian motion with respect <strong>to</strong> the measure Q given in<br />
(101) with a = µ/σ, and since the SDE (107) has no drift,<br />
its solution S t is a martingale w.r.t. the measure Q.<br />
5.3 The ‘efficiency symmetry’ and the noarbitrage<br />
condition as its ‘conservation<br />
law’<br />
The notion of an efficient market plays a crucial role in Finance.<br />
Roughly speaking, in an efficient market all relevant<br />
information is already reflected in the prices [3]. This<br />
means, in particular, that past prices give no additional information<br />
that is not already contained in the current price.<br />
In an efficient market prices thus adjust immediately <strong>to</strong> the<br />
arrival of new information. Since the content of future information<br />
and their effect on prices are unknown, it should be<br />
impossible <strong>to</strong> make definite predictions about future price<br />
based on the information available <strong>to</strong>day. Thus, the best<br />
prediction for the expected future price (discounted <strong>to</strong> the<br />
present time) should be <strong>to</strong>day’s price. In other words, in<br />
a efficient market ‘discounted prices’ should be a martingale.<br />
This intuitive definition of efficiency is formalized below.<br />
[For technical reasons the results of this section will be
Brazilian Journal of Physics, vol. 34, no. 3B, September, 2004 1055<br />
restricted <strong>to</strong> the discrete-time case. Their extension <strong>to</strong> the<br />
continuous-time framework, although possible <strong>to</strong> a large extent,<br />
is more complicated and will not be attempted in the<br />
present notes; see, e.g., [5].]<br />
Consider a market formed by two assets (B, S), where<br />
B is our usual risk-free free asset and S is a risky asset. We<br />
suppose that S(t) follows a s<strong>to</strong>chastic process on a probability<br />
space (Ω, F, P ) endowed with a filtration {F t } t≥0 .<br />
Definition 8 Suppose the market (B, S) operates at discrete<br />
time t n , n = 1, 2, .... This market is said <strong>to</strong> be efficient<br />
if there exists (at least one) probability measure Q,<br />
equivalent <strong>to</strong> P , such that the ‘discounted price’ S(t)<br />
B(t) is a<br />
martingale with respect <strong>to</strong> the measure Q, that is,<br />
[ ] S(t)<br />
E Q B(t) | F t 0<br />
= S(t 0)<br />
B(t 0 ) , for t 0 ≤ t, (109)<br />
where E Q means expected value w.r.t. the measure Q.<br />
The requirement of efficiency, as defined above, is somewhat<br />
reminiscent of a symmetry principle in Physics. Indeed,<br />
we can recast definition (109) by saying that in a efficient<br />
market there exists a ‘special measure Q’ with respect<br />
<strong>to</strong> which discounted prices are invariant under a sort of ‘time<br />
translation,’ in the following sense:<br />
[ ]<br />
S(t + T )<br />
E Q B(t + T ) | F t<br />
= S(t)<br />
B(t) , (110)<br />
for any T > 0.<br />
In Physics, symmetry principles are intimately connected<br />
with conservation laws. (Recall, for instance, that<br />
the invariance of New<strong>to</strong>n’s law under time translation implies<br />
conservation of energy.) It is thus only natural <strong>to</strong><br />
ask whether the ‘efficiency symmetry’ above also leads <strong>to</strong><br />
a ‘conservation law.’ Perhaps not surprisingly, this is indeed<br />
the case, as stated in the following theorem, which is sometimes<br />
referred <strong>to</strong> as the First Fundamental Theorem of asset<br />
pricing.<br />
Theorem 2 Suppose the market (B, S) operates at discrete<br />
time t n , n = 1, 2, .... Then this market is efficient if and only<br />
if it is arbitrage-free.<br />
(See [5] for a proof.)<br />
Recall that absence of arbitrage means that any selffinancing<br />
portfolio with zero initial value, and with no<br />
chance of becoming negative, will remain zero-valued for<br />
all subsequent times. More precisely, the no-arbitrage condition<br />
says that<br />
V (0) = 0 and V (t) ≥ 0 a.s. =⇒ V (t) = 0 a.s.,<br />
(111)<br />
where a.s. means almost surely, i.e., with probability 1. The<br />
absence of arbitrage can thus be interpreted as a kind of<br />
‘conservation law’ for the “vacuum state” of the market: if<br />
you start in a state with zero initial money and do not take<br />
any risks, then you remain at this state for all times. I thus<br />
find it quite interesting that the so-called “no-free-lunch”<br />
condition can actually be seen as the conservation law associated<br />
with the efficiency symmetry.<br />
<strong>An</strong>other very important result is the Second Fundamental<br />
Theorem of asset pricing, linking the completeness of a<br />
market <strong>to</strong> the uniqueness of its equivalent martingale measure.<br />
Theorem 3 <strong>An</strong> arbitrage-free (B, S)-market is complete if<br />
and only if the equivalent martingale measure Q is unique.<br />
(See [5] for a proof.)<br />
We already know that the Black-Scholes model is complete.<br />
Below we will calculate its equivalent martingale<br />
measure explicitly, and it will become clear from the construction<br />
that it is indeed unique.<br />
5.4 Pricing derivatives with the equivalent<br />
martingale measure<br />
The notion of an equivalent martingale measure can be used<br />
<strong>to</strong> price derivatives in a rather direct way, without having <strong>to</strong><br />
solve a PDE. The idea is that in an efficient economy all financial<br />
assets are martingales with respect <strong>to</strong> the equivalent<br />
martingale measure Q. More precisely, if F (S, t) is a contingent<br />
claim with maturity T and payoff function Φ(S(T ))<br />
then from (109) we have<br />
F (S, t)<br />
B(t)<br />
= E Q t,S<br />
[ ] Φ(S(T ))<br />
, (112)<br />
B(T )<br />
where the subscripts t, S denote that the expected value is<br />
taken at present time t and with current value S, i.e., conditional<br />
<strong>to</strong> the information available at time t. It is not hard <strong>to</strong><br />
convince oneself that if the derivative price F were not given<br />
by (110), then there would be an arbitrage opportunity.<br />
In the Black-Scholes model, the risk-free asset is a bank<br />
account with fixed interest rate r, i.e., B(t) = e rt , so that<br />
(112) becomes<br />
or<br />
F (S, t) = e −r(T −t) E Q t,S<br />
[Φ(S(T ))] , (113)<br />
∫ ∞<br />
F (S, t) = e −r(T −t) Φ(S ′ )f Q (S ′ , T ; S, t)dS ′ , (114)<br />
0<br />
where f Q (S, t; S 0 , t 0 ) denotes the probability density, under<br />
the equivalent martingale measure Q, of the process S(t)<br />
with initial value S(t 0 ) = S 0 . All that remains <strong>to</strong> be done<br />
now is <strong>to</strong> find the equivalent martingale measure Q for the<br />
Black-Scholes model. To do this, consider the process<br />
Z(t) = S(t)<br />
B(t) = e−rt S(t). (115)
1056 Giovani L. Vasconcelos<br />
We then have<br />
where<br />
dZ = −re −rt Sdt + e −rt dS<br />
= (µ − r)Zdt + σZdW<br />
= σZd ˜W ,<br />
˜W (t) = [(µ − r)/σ] t + W (t). (116)<br />
Now recall that in the Black-Scholes model the s<strong>to</strong>ck price<br />
follows a geometric Brownian motion<br />
dS = µSdt + σSdW, (117)<br />
which in terms of the process ˜W (t) given in (116) reads<br />
dS = rSdt + σSd ˜W . (118)<br />
From Girsanov theorem we know that there is a equivalent<br />
martingale measure Q that turns ˜W (t) in<strong>to</strong> a Brownian<br />
motion. Equation (118) then shows that w.r.t the measure<br />
Q the price S(t) follows a geometric Brownian motion<br />
with mean rate of return equal <strong>to</strong> r. The probability density<br />
f Q (S ′ , T ; S, t) can now be obtained directly from (54), by<br />
simply setting µ = r and S 0 = S. One then gets<br />
f Q (S ′ , T ; S, t) =<br />
where τ = T − t. Inserting (119) in<strong>to</strong> (114) we obtain<br />
F (t, S) =<br />
⌋<br />
1<br />
S ′√ 2σ 2 τ exp ⎧<br />
⎪⎨<br />
⎪ ⎩<br />
−<br />
−r(T −t)<br />
e<br />
√<br />
2πσ2 (T − t)<br />
∫ ∞<br />
0<br />
[ (<br />
ln<br />
)<br />
S ′<br />
S<br />
− (r − 1 2 σ2 )τ<br />
2σ 2 τ<br />
] 2<br />
⎫<br />
⎪⎬<br />
⎪⎭ , (119)<br />
Φ(S ′ )e [ln(S′ /S)−(r− 1 2 σ2 )(T −t)] 2 dS′<br />
S ′ , (120)<br />
⌈<br />
which is precisely the expression obtained for the generic<br />
solution of the Black-Scholes equation given in (92). In the<br />
case of a European call option we have Φ(S ′ ) = max(S ′ −<br />
K, 0), which inserted in<strong>to</strong> (120) yields, after some algebra,<br />
the Black-Scholes formula (84).<br />
It is interesting <strong>to</strong> notice that under the equivalent martingale<br />
measure Q the s<strong>to</strong>ck price in the Black-Scholes<br />
model follows a geometric Brownian motion with the mean<br />
rate of return equal <strong>to</strong> the risk-free interest rate r; see (118).<br />
It is as if all inves<strong>to</strong>rs were risk neutral, in the sense they<br />
would be willing <strong>to</strong> invest on a risky s<strong>to</strong>ck even though its<br />
expected return is just what a risk-free bank account would<br />
yield. For this reason, the pricing method based on the<br />
equivalent martingale measure is commonly referred <strong>to</strong> as<br />
risk neutral valuation. Of course, actual inves<strong>to</strong>rs are not<br />
risk neutral. However, in an efficient market there is a ‘special<br />
reference frame’ where inves<strong>to</strong>rs can be treated as if<br />
they were indeed insensitive <strong>to</strong> risk.<br />
6 Beyond the Standard Model of Finance<br />
I: Non-Gaussian Distributions<br />
We have seen above that the Black-Scholes model is an elegant<br />
and powerful theoretical construct: it is complete, efficient,<br />
arbitrage-free, and Gaussian (in the sense that the<br />
s<strong>to</strong>ck returns are normally distributed). It is thus important<br />
<strong>to</strong> ask whether real markets actually fit in<strong>to</strong> this nice framework.<br />
There are two main ways in which real markets may deviate<br />
from the standard Black-Scholes model: i) the returns<br />
may not be normally distributed or ii) there may exist longmemory<br />
effects on the time series. In this Section we will<br />
discuss the possibility that asset prices may follow a non-<br />
Gaussian stable Lévy process, while in the next section we<br />
investigate whether financial data might exhibit long-term<br />
memory.<br />
Mandelbrot [22] in 1963 was perhaps the first person<br />
<strong>to</strong> challenge the paradigm that returns are normally distributed.<br />
He analyzed cot<strong>to</strong>n prices on various exchanges<br />
in the United States and found evidences that their distribution<br />
of returns decays as a power law and hence much slower<br />
than a Gaussian. <strong>An</strong> example of this ‘fat tail’ behavior can<br />
be seen in Fig. 8, where I plot the distribution for the returns<br />
of the Ibovespa index. In this figure, it is also shown a Gaussian<br />
distribution with the variance of the data, which appears<br />
as a parabola in the linear-log scale of the graph. One clearly<br />
sees that the empirical distribution does indeed have ‘fatter<br />
tails’ when compared with the Gaussian distribution.<br />
The Gaussian distribution is special for two main reasons.<br />
The first one is the Central Limit Theorem [21] that<br />
states that the sum of infinitely many independent random<br />
variables (with finite variance) will converge <strong>to</strong> a Gaussian<br />
variable. The second one is the fact that it is a stable distribution,<br />
in the sense that the sum of two independent Gaussian<br />
random variables is also a Gaussian variable. It is thus<br />
natural <strong>to</strong> ask whether there are other stable distributions.<br />
The French mathematician Paul Lévy showed that there is<br />
indeed a whole family of stable distributions of which the<br />
Gaussian is but one particular case. In what follows, I will
Brazilian Journal of Physics, vol. 34, no. 3B, September, 2004 1057<br />
first introduce the so-called Lévy stable distributions and<br />
then briefly discuss their possible applications <strong>to</strong> financial<br />
data.<br />
10<br />
from which the pdf of X can be obtained by calculating the<br />
inverse Fourier transform. Note that the pdf of the sum of<br />
N i.i.d. random variables will in general be quite different<br />
from the pdf of the individual variables. There is however<br />
a special class of distribution, the stable distributions, for<br />
which the pdf of the sum has the same functional form of<br />
the individual pdf’s.<br />
p(r)<br />
1<br />
Definition 9 A probability distribution p(x) is stable if for<br />
each N ≥ 2 there exist numbers a N > 0 and b N , such that,<br />
if X 1 , ..., X N are i.i.d. random variables with distribution<br />
p(x), then<br />
0.1<br />
-0.2 -0.1 0 0.1 0.2<br />
r<br />
Figure 8. Distribution of the daily Ibovespa returns (open circles).<br />
The solid line correspond <strong>to</strong> a Gaussian distribution with the same<br />
variance as that of the empirical distribution.<br />
6.1 The stable Lévy distributions<br />
Let X be a random variable with probability density function<br />
(pdf) given by p(x). We recall that the characteristic<br />
function ϕ(z) of a random variable X is the Fourier transform<br />
of its pdf p(x):<br />
ϕ(z) =<br />
∫ ∞<br />
−∞<br />
p(x)e izx dx. (121)<br />
Now let X 1 and X 2 be two independent random variables<br />
with pdf’s p 1 (x 1 ) and p 2 (x 2 ). Since X 1 and X 2 are independent,<br />
the pdf of the sum X = X 1 +X 2 is the convolution<br />
of the original pdf’s:<br />
p(x) =<br />
∫ ∞<br />
−∞<br />
p 1 (s)p 2 (x − s)ds.<br />
Let now ϕ(z, 2) denote the characteristic function of X.<br />
In view of the convolution theorem which states that the<br />
Fourier transform of the convolution is the product of the<br />
Fourier transforms, it then follows that<br />
ϕ(z, 2) = ϕ 1 (z)ϕ 2 (z). (122)<br />
Suppose furthermore that X 1 and X 2 are identically distributed,<br />
that is,<br />
X 1<br />
d<br />
= X2 , (123)<br />
or alternatively<br />
ϕ 1 (z) = ϕ 2 (z) = ϕ(z). (124)<br />
(Recall that the symbol d = denotes equality in the distribution<br />
sense.) From (122) and (124) it then follows that<br />
ϕ(z, 2) = [ϕ(z)] 2 .<br />
In general, if X = ∑ N<br />
i=1 X i, where the X i ’s are independent<br />
and identically distributed (i.i.d.) random variables,<br />
then<br />
ϕ(z, N) = [ϕ(z)] N , (125)<br />
X 1 + ... + X N<br />
d<br />
= an X i + b N . (126)<br />
In other words, a distribution is stable if its form is invariant<br />
under addition, up <strong>to</strong> a rescaling of the variable by<br />
a translation and a dilation. More precisely, if p(x, N) denotes<br />
the probability density of X = ∑ N<br />
i=1 X i, where the<br />
X i ’s are i.i.d. variables with a stable distribution p(x), then<br />
(126) implies that<br />
p(x, N) = 1 ( ) x − bN<br />
p<br />
. (127)<br />
a N a N<br />
Stability of probability distributions has a nice interpretation<br />
from an economic standpoint. To see this, suppose that the<br />
variables X i represent daily increments of a given financial<br />
asset. Stability then means preservation of the distribution<br />
under time aggregation, which is a rather natural property <strong>to</strong><br />
expect from financial data.<br />
As already mentioned, the Gaussian distribution is stable.<br />
To see this, recall that the Fourier transform of a Gaussian<br />
is a Gaussian and that the product of Gaussians is again<br />
a Gaussian, so that from (125) it follows that the characteristic<br />
function ϕ(z, N) will indeed be that of a Gaussian variable.<br />
More precisely, we have that the characteristic function<br />
of a normal variable N (0, σ) is ϕ(z) = e −(σ2 /2)z 2 ,<br />
which inserted in<strong>to</strong> (125) immediately yields ϕ(z, N) =<br />
e −(Nσ2 /2)z 2 . Thus, the sum of N i.i.d. normal variables is<br />
normally distributed with standard deviation √ Nσ, that is,<br />
X d = N (0, √ Nσ), which in turn implies that<br />
p(x, N) = √ 1 ( ) x<br />
p √ . (128)<br />
N N<br />
Thus, in the case of the Gaussian distribution we have a N =<br />
1/ √ N and b N = 0.<br />
The class of stable distributions is rather small and was<br />
completely determined by the mathematicians P. Lévy and<br />
A. Ya. Khintchine in the 1920’s. Here we shall restrict ourselves<br />
<strong>to</strong> the subclass of symmetric distribution. In this case,<br />
the characteristic function is given by<br />
ϕ α (z) = e −a|z|α , (129)<br />
where 0 < α ≤ 2 and a > 0. The parameter α is called the<br />
stability exponent and a is a scale fac<strong>to</strong>r. Taking the inverse<br />
Fourier transform of ϕ α (z) we obtain the corresponding pdf<br />
p α (x):
1058 Giovani L. Vasconcelos<br />
p α (x) = 1 ∫ ∞<br />
ϕ α (z)e −izx dz = 1 2π −∞ π<br />
⌈<br />
∫ ∞<br />
0<br />
e −azα cos(zx)dz. (130)<br />
Unfortunately, however, only for two particular values of α<br />
can the integral above be explicitly calculated:<br />
• α = 1 (Lorentzian or Cauchy distribution):<br />
p(x) = 2a<br />
π<br />
• α = 2 (Gaussian distribution):<br />
1<br />
x 2 + 4a 2 .<br />
p(x) = 1<br />
8πa e−x2 /4a .<br />
Note also that Lévy distributions are not defined for<br />
α > 2, because in this case the function obtained from (130)<br />
is not everywhere positive.<br />
Although, for arbitrary α the pdf p α (x) cannot be found<br />
in closed form, its asymp<strong>to</strong>tic behavior for large x can be<br />
easily calculated from (130). Here one finds [5] that<br />
where<br />
p α (x) ≈<br />
C α<br />
, |x| → ∞, (131)<br />
|x|<br />
1+α<br />
C α = a π Γ(1 + α) sin πα 2 . (132)<br />
We thus see that the Lévy distribution with α < 2 has the<br />
interesting property that it shows scaling behavior for large<br />
x, i.e., p(x) decays as a power-law.<br />
<strong>An</strong>other important scaling relation for the Lévy distribution<br />
can be obtained, as follows. First note that for symmetric<br />
stable distribution we necessarily have b N = 0. Now<br />
using (125) and (129), we easily find that the dilation fac<strong>to</strong>r<br />
a N in (127) is<br />
a N = N 1/α , (133)<br />
so that (127) becomes<br />
p α (x, N) = p (<br />
α N 1/α x )<br />
, (134)<br />
N 1/α<br />
which implies that<br />
p(0, N) = p(0) . (135)<br />
N<br />
1/α<br />
One can then use this scaling relation <strong>to</strong> estimate the index α<br />
of the Lévy distribution: in a log-log plot of p(0, N) against<br />
N, the slope of a linear fit gives precisely 1/α; see Sec. 6.3<br />
below.<br />
The power-law decay of Lévy distributions implies, of<br />
course, the absence of a characteristic scale. The downside<br />
of this is that all Lévy distributions have infinite variance!<br />
In fact, all moments of order higher than 1 are infinite, since<br />
E[|x| n ] diverges for n ≥ α, as can be readily shown from<br />
(131). Processes with infinite variance are not physically<br />
plausible, so several prescriptions <strong>to</strong> truncate the Lévy distribution<br />
at some large scale has been proposed, as discussed<br />
next.<br />
6.2 Truncated Lévy distributions<br />
To circumvent the problem of infinite variance in Lévy distributions,<br />
several truncation prescriptions have been proposed<br />
in the literature. In a general they can be written as<br />
p(x) = p α (x)Φ(x), (136)<br />
where Φ(x) is a cut-off function <strong>to</strong> be chosen in such way<br />
that the variance of the truncated distribution is finite. For<br />
example, two possible choices that have been used <strong>to</strong> model<br />
the distributions of financial asset prices are given below<br />
• Abruptly truncated Lévy distribution (ATLD):<br />
Φ(x) = Θ(x c − |x|),<br />
where Θ(x) is the Heaviside function and x c is some cut-off<br />
length scale.<br />
• Exponentially truncated Lévy distribution (ETLD):<br />
Φ(x) = Ae −λ|x| ,<br />
where λ > 0 and A is a normalization fac<strong>to</strong>r.<br />
Other variants of truncated Lévy distributions that have<br />
also been considered in the literature are the gradually truncated<br />
Lévy distribution [23] and the exponentially damped<br />
Lévy distributions [24].<br />
Since a truncated Lévy distribution has finite variance,<br />
then by the central limit theorem the distribution of the sum<br />
X = X 1 + ... + X N of N i.i.d variables with such a distribution<br />
will converge <strong>to</strong> a Gaussian distribution for large<br />
N. However, this convergence is usually very slow—for financial<br />
data it is typically in the order of tens of days; see<br />
below. For shorter time scales, non-Gaussian behavior may<br />
thus be of practical relevance.<br />
6.3 Lévy distributions in Finance<br />
Lévy distribution have been used, for example, by Mantegna<br />
& Stanley [9] <strong>to</strong> model the distribution of changes in<br />
the s<strong>to</strong>ck index S&P500 of the American S<strong>to</strong>ck Exchange.<br />
They analyzed high-frequency data (one-minute quotes of<br />
the S&P500) over the period from January 1984 <strong>to</strong> December<br />
1989. From the original time series Y (t) of the index<br />
values, they first generated time series corresponding <strong>to</strong> index<br />
changes during intervals of N minutes:<br />
Z N (t) ≡ Y (t + N) − Y (t). (137)
Brazilian Journal of Physics, vol. 34, no. 3B, September, 2004 1059<br />
They then computed the empirical pdf p(z, N) and analyzed<br />
the scaling of p(0, N) with N. In a log-log plot p(0, N)<br />
showed a linear behavior, as predicted by (135), with a slope<br />
corresponding <strong>to</strong> α = 1.4 for 30 < N < 1000 minutes [9].<br />
For N > 10 4 the slope of p(0, N) approaches −0.5, indicating<br />
convergence <strong>to</strong> a Gaussian behavior. In the Lévy<br />
regime (i.e., small N), however, the tail of their empirical<br />
pdf decays slower than Gaussian but faster than a pure Lévy<br />
distribution with the exponent α found from above scaling<br />
argument. These facts thus suggest that a truncated Lévy<br />
distribution would perhaps be more appropriate for modeling<br />
the actual distribution. Indeed, Bouchaud and Potters<br />
[10] found that the probability of 15-minute changes of the<br />
S&P500 index is well described by a ETLD with α = 1.5.<br />
The ETLD has also been applied by Miranda & Riera<br />
[25] <strong>to</strong> study the daily returns of Ibovespa index of the São<br />
Paulo S<strong>to</strong>ck Exchange in the period 1986-2000. From the<br />
daily closing values Y (t) of the Ibovespa, they first calculated<br />
the time series for the returns in intervals of N days<br />
for all a > 0. A sample path of a FBM is therefore a fractal<br />
curve with fractal dimension D = 1/H. The parameter<br />
H is called the self-similarity exponent or the Hurst<br />
exponent. For H = 1/2 the process W H (t) corresponds<br />
<strong>to</strong> the usual Brownian motion, in which case the increments<br />
X t = W H (t+1)−W H (t) are statistically independent, corresponding<br />
<strong>to</strong> white noise. On the other hand, for H ≠ 1/2<br />
the increments X t , known as fractional white noise, display<br />
long-range correlation in the sense that<br />
E[X t+h X t ] ≃ 2H(2H − 1)h 2H−2 for h → ∞, (142)<br />
as one can easily verify from (139) and (140). Thus, if<br />
1/2 < H < 1 the increments of the FBM are positively<br />
correlated and we say that the process W H (t) exhibits persistence.<br />
Likewise, for 0 < H < 1/2 the increments are<br />
negatively correlated and the FBM is said <strong>to</strong> show antipersistence.<br />
Sample FBM paths with H = 0.2, 0.5, and 0.8 are<br />
shown in Fig. 9.<br />
r N (t) = log Y (t + N) − log Y (t), (138)<br />
and then computed the corresponding pdf’s for p(r, N).<br />
From the scaling of p(0, N) they found α ≃ 1.6 − 1.7 for<br />
N < 20 days, whereas for larger N a Gaussian-like behavior<br />
(i.e., α = 0.5) was observed.<br />
Many other applications of Lévy processes in Finance<br />
have been discussed in the literature [26]. For example, a<br />
model for option pricing has recently been considered where<br />
the price of the underlying asset is assumed <strong>to</strong> follow a truncated<br />
Lévy process [27]. More recently, there have accumulated<br />
evidences [28, 29, 30] that in certain cases financial<br />
data may be better described by exponential distributions,<br />
rather than by Lévy or Gaussian distributions.<br />
6<br />
4<br />
2<br />
0<br />
-2<br />
H=0.8<br />
H=0.5<br />
H=0.2<br />
7 Beyond the Standard Model of Finance<br />
II: Long-Range Correlations<br />
In this section, we discuss the possibility that asset prices<br />
might exhibit long-range correlations and thus may need <strong>to</strong><br />
be described in terms of long-memory processes, such as the<br />
fractional Brownian motion.<br />
7.1 Fractional Brownian motion<br />
The fractional Brownian motion (FBM) is a Gaussian process<br />
{W H (t), t > 0} with zero mean and stationary increments,<br />
whose variance and covariance are given by<br />
E[W 2 H(t)] = t 2H , (139)<br />
E[W H (s)W H (t)] = 1 (<br />
s 2H + t 2H − |t − s| 2H) , (140)<br />
2<br />
where 0 < H < 1. The FBM W H (t) is a self-similar process,<br />
in the sense that<br />
W H (at) d = a H W H (t), (141)<br />
0 2000 4000 6000 8000<br />
Figure 9. Sample paths of fractional Brownian motion.<br />
Several estima<strong>to</strong>rs for the exponent H have been discussed<br />
in the literature; see, e.g., Ref. [31] for a comparison<br />
among some of them. One general methodology consists<br />
in estimating how the ‘amount of fluctuation’ within a time<br />
window of size τ scales with τ. Specific methods, such as<br />
the Hurst rescaled range (R/S) analysis [32] or the Detrendend<br />
Fluctuation <strong>An</strong>alysis [33, 34], differ basically on the<br />
choice of the fluctuation measure. Here I shall discuss only<br />
the DFA that has proven <strong>to</strong> be a more reliable estima<strong>to</strong>r for<br />
H than the Hurst R/S analysis [35].<br />
7.2 Detrended fluctuation analysis<br />
Suppose we have a time series r(t), t = 1, ..., T , corresponding<br />
<strong>to</strong>, say, daily returns of a financial asset. To implement<br />
the DFA, we first integrate the original time series<br />
r(t) <strong>to</strong> obtain the cumulative time series X(t):<br />
X(t) =<br />
t∑<br />
(r(t ′ ) − r), t = 1, ..., T, (143)<br />
t ′ =1
1060 Giovani L. Vasconcelos<br />
where<br />
r = 1 T<br />
T∑<br />
r(t ′ ). (144)<br />
t ′ =1<br />
Next we break up X(t) in<strong>to</strong> N non-overlapping time intervals,<br />
I n , of equal size τ, where n = 0, 1, ..., N − 1 and N<br />
corresponds <strong>to</strong> the integer part of T/τ. We then introduce<br />
the local trend function Y τ (t) defined by<br />
Y τ (t) = a n + b n t for t ∈ I n , (145)<br />
where the coefficients a n and b n represent the least-square<br />
linear fit of X(t) in the interval I n . Finally, we compute the<br />
rescaled fluctuation function F (τ) defined as [35]<br />
F (τ) = 1 √ 1 ∑Nτ<br />
[X(t) − Y τ (t)] 2 , (146)<br />
S nτ<br />
t=1<br />
where S is the data standard deviation<br />
S = √ 1 T∑<br />
(r t − r) 2 . (147)<br />
T<br />
t=1<br />
The Hurst exponent H is then obtained from the scaling behavior<br />
of F (τ):<br />
F (τ) = Cτ H , (148)<br />
where C is a constant independent of the time lag τ.<br />
In a double-logarithmic plot the relationship (148) yields<br />
a straight line whose slope is precisely the exponent H, and<br />
so a linear regression of the empirical F (τ) will immediately<br />
give H. One practical problem with this method, however,<br />
is that the values obtained for H are somewhat dependent<br />
on the choice of the interval within which <strong>to</strong> perform<br />
the linear fit [35, 36]. It is possible <strong>to</strong> avoid part of this difficulty<br />
by relying on the fact that for the fractional Brownian<br />
motion, the fluctuation function F (τ) can be computed exactly<br />
[31]:<br />
F H (τ) = C H τ H , (149)<br />
where<br />
[<br />
2<br />
C H =<br />
2H + 1 + 1<br />
H + 2 − 2 ] 1/2<br />
. (150)<br />
H + 1<br />
In (149) we have added a subscript H <strong>to</strong> the function F <strong>to</strong><br />
denote explicitly that it refers <strong>to</strong> W H (t). Equation (149)<br />
with (150) now gives a one-parameter estima<strong>to</strong>r for the exponent<br />
H: one has simply <strong>to</strong> adjust H so as <strong>to</strong> obtain the<br />
best agreement between the theoretical curve predicted by<br />
F H (τ) and the empirical data for F (τ).<br />
7.3 Fractional Brownian motion in Finance<br />
The idea of using the FMB for modeling asset price dynamics<br />
dates back <strong>to</strong> the work of Mandelbrot & van Ness<br />
[37]. Since then, the Hurst exponent has been calculated<br />
(using different estima<strong>to</strong>rs) for many financial time series,<br />
such as s<strong>to</strong>ck prices, s<strong>to</strong>ck indexes and currency exchange<br />
rates [38, 39, 40, 41, 35]. In many cases [38] an exponent<br />
H > 1/2 has been found, indicating the existence of longrange<br />
correlation (persistence) in the data. It is <strong>to</strong> be noted,<br />
however, that the values of H computed using the traditional<br />
R/S-analysis, such as those quoted in [38], should be viewed<br />
with some caution, for this method has been shown [35] <strong>to</strong><br />
overestimate the value of H. In this sense, the DFA appears<br />
<strong>to</strong> give a more reliable estimates for H.<br />
<strong>An</strong> example of the DFA applied <strong>to</strong> the returns of the<br />
Ibovespa s<strong>to</strong>ck index is shown in Fig. 10 (upper curve). In<br />
this figure the upper straight line corresponds <strong>to</strong> the theoretical<br />
curve F H (τ) given in (149) with H = 0.6, and one<br />
sees an excellent agreement with the empirical data up <strong>to</strong><br />
τ ≃ 130 days. The fact that H > 0.5 thus indicates persistence<br />
in the Ibovespa returns. For τ > 130 the data deviate<br />
from the initial scaling behavior and cross over <strong>to</strong> a regime<br />
with a slope closer <strong>to</strong> 1/2, meaning that the Ibovespa looses<br />
its ‘memory’ after a period of about 6 months. Also shown<br />
in Fig. 10 is the corresponding F (τ) calculated for the shuffled<br />
Ibovespa returns. In this case we obtain an almost perfect<br />
scaling with H = 1/2, as expected, since the shuffling<br />
procedure tends <strong>to</strong> destroys any previously existing correlation.<br />
F(τ)<br />
10 1<br />
10 0<br />
ibovespa<br />
shuffled data<br />
H=0.6<br />
H=0.5<br />
10 1 10 2 10 3 10 4<br />
τ<br />
Figure 10. Fluctuation function F (τ) as a function of τ for the returns<br />
of the Ibovespa index (upper curve) and for the shuffled data<br />
(lower curve). The upper (lower) straight line gives the theoretical<br />
curve F H(τ) for H = 0.6 (H = 1/2).<br />
As already mentioned, the Hurst exponent has been<br />
calculated for many financial time series. In the case of<br />
s<strong>to</strong>ck indexes, the following interesting picture appears <strong>to</strong> be<br />
emerging from recent studies [40, 41, 35]: large and more<br />
developed markets, such as the New York and the London<br />
S<strong>to</strong>ck Exchanges, usually have H equal <strong>to</strong> (or slightly less<br />
than) 1/2, whereas less developed markets show a tendency<br />
<strong>to</strong> have H > 1/2. In other words, large markets seem indeed<br />
<strong>to</strong> be ‘efficient’ in the sense that H ≃ 1/2, whereas<br />
less developed markets tend <strong>to</strong> exhibit long-range correlation.<br />
A possible interpretation for this finding is that smaller<br />
markets are conceivably more prone <strong>to</strong> ‘correlated fluctuations’<br />
and perhaps more susceptible <strong>to</strong> being pushed around<br />
by aggressive inves<strong>to</strong>rs, which may explain in part a Hurst<br />
exponent greater than 1/2.
Brazilian Journal of Physics, vol. 34, no. 3B, September, 2004 1061<br />
It should also be pointed out that a considerable timevariability<br />
of the exponent H for s<strong>to</strong>ck indexes has been<br />
found [41, 35], indicating that the data in such cases cannot<br />
be modeled in terms of stationary s<strong>to</strong>chastic processes.<br />
(A time-varying H has also been observed in other financial<br />
data, such as, currency exchange rate [39].) In such cases,<br />
the stationarity assumption is only a rather crude approximation<br />
[35]. Furthermore, the time dependence of the Hurst<br />
exponent is an indication that the underlying process might<br />
be multifractal rather than monofractal; see below.<br />
H<br />
0.9<br />
0.8<br />
0.7<br />
0.6<br />
0.5<br />
0.4<br />
0.3<br />
1968 1972 1976 1980 1984 1988 1992 1996 2000<br />
t<br />
Figure 11. The Hurst exponent H for the Ibovespa as a function of<br />
time. Here H was computed in two-year time intervals, with the<br />
variable t denoting the origin of each such interval.<br />
A time-varying Hurst exponent has been observed for<br />
the Brazilian s<strong>to</strong>ck market. This case is of particular interest<br />
because in the recent past Brazil was plagued by runaway<br />
inflation and endured several ill-fated economic plans<br />
designed <strong>to</strong> control it. To analyze the effect of inflation and<br />
the economic plans, Costa and Vasconcelos [35] calculated a<br />
time-varying Hurst exponent for the Ibovespa returns, computed<br />
in three-year time windows for the period 1968–2001.<br />
A similar analysis but with two-year time windows is shown<br />
in Fig. 11. One sees from this figure that during the 1970’s<br />
and 1980’s the curve H(t) stays well above 1/2, the only exception<br />
<strong>to</strong> this trend occurring around the year 1986 when<br />
H dips momentarily <strong>to</strong>wards 1/2—an effect caused by the<br />
launch of the Cruzado economic Plan in February 1986 [35].<br />
In the early 1990’s, after the launching of the Collor Plan, we<br />
observe a dramatic decline in the curve H(t) <strong>to</strong>wards 1/2,<br />
after which it remained (within some fluctuation) around<br />
1/2. This fact has led Costa and Vasconcelos [35] <strong>to</strong> conclude<br />
that the opening and consequent modernization of the<br />
Brazilian economy that begun with the Collor Plan resulted<br />
in a more efficient s<strong>to</strong>ck market, in the sense that H ≃ 0.5<br />
after 1990. In Fig. 11, one clearly sees that after the launching<br />
of a new major economic plan, such as the Cruzado Plan<br />
in 1986 and the Collor Plan in 1990, the Hurst exponent decreases.<br />
This effect has, of course, a simple economic interpretation:<br />
a Government intervention on the market is usually<br />
designed <strong>to</strong> introduce “anti-persistent effects,” which in<br />
turn leads <strong>to</strong> a momentary reduction of H. Note also that<br />
only after 1990 does the curves H(t) goes below 1/2. This<br />
finding confirms the scenario described above that more developed<br />
markets (as Brazil became after 1990) tend <strong>to</strong> have<br />
H < ∼ 1/2.<br />
7.4 Option pricing under the FBM assumption<br />
We have seen above that often times asset prices have a<br />
Hurst exponent different from 1/2. In such cases, the standard<br />
Black-Scholes model does not apply, since it assumes<br />
that returns follow a Brownian motion (H = 0.5). A more<br />
appropriate model for the return dynamics would be the<br />
fractional Brownian motion (FBM). Indeed, a ‘fractional<br />
Black-Scholes model’ has been formulated, in which it is assumed<br />
that the s<strong>to</strong>ck price S follows a geometric fractional<br />
Brownian motion given by<br />
dS = µSdt + σSdW H , (151)<br />
where W H (t) is the standard FBM. The fractional s<strong>to</strong>chastic<br />
differential equation above is shorthand for the integral<br />
equation<br />
S(t) = S(0)+µ<br />
∫ t<br />
0<br />
S(t ′ )dt ′ +σ<br />
∫ t<br />
0<br />
S(t ′ )dW H (t ′ ). (152)<br />
To make mathematical sense of this equation is, of course,<br />
necessary <strong>to</strong> define s<strong>to</strong>chastic integrals with respect <strong>to</strong><br />
W H (t). Here it suffices <strong>to</strong> say that a fractional Itô calculus<br />
can indeed be rigorously defined [42] that shares (in an<br />
appropriate sense) many of the properties of the usual Itô<br />
calculus. In the context of this fractional Itô calculus is possible<br />
<strong>to</strong> prove that the solution <strong>to</strong> (151) is given by<br />
{<br />
S(t) = S(0) exp µt − 1 }<br />
2 σ2 t 2H + σW H (t) . (153)<br />
Compare this expression with (53).<br />
One can show [42] that the fractional Black-Scholes<br />
model is complete and arbitrage-free. To price derivatives<br />
with this model, one can apply the same ∆-hedging argument<br />
used before, which now leads <strong>to</strong> the ‘fractional Black-<br />
Scholes equation.’ The result is summarized in the following<br />
theorem.<br />
Theorem 4 In the fractional Black-Scholes model, the<br />
price F (S, t) of a European contingent claim with payoff<br />
Φ(S(T )) is given by the solution <strong>to</strong> the following boundaryvalue<br />
problem<br />
∂F<br />
∂t + Hσ2 t 2H−2 S 2 ∂2 F ∂F<br />
+ rS − rF = 0,<br />
∂S2 ∂S<br />
(154)<br />
F (T, S) = Φ(S). (155)
1062 Giovani L. Vasconcelos<br />
[Compare with (88).]<br />
For the case of a European call option the solution <strong>to</strong><br />
the problem above can be found in closed form. Alternatively,<br />
one can obtain the option pricing formula directly<br />
from the equivalent martingale measure, without having <strong>to</strong><br />
solve the above PDE. The final result for this ‘fractional<br />
Black-Scholes formula’ is given below [43].<br />
Theorem 5 In the fractional Black-Scholes model, the price<br />
of a European call option with strike price K and maturity<br />
T is given by<br />
C(S, t) = SN(d 1 ) − Ke −r(T −t) N(d 2 ), (156)<br />
where<br />
d 1 = ln ( )<br />
S<br />
K + r(T − t) +<br />
1<br />
2 σ2 (T 2H − t 2H )<br />
σ √ ,(157)<br />
T 2H − t 2H (158)<br />
d 2 = ln ( )<br />
S<br />
K + r(T − t) −<br />
1<br />
2 σ2 (T 2H − t 2H )<br />
σ √ .(159)<br />
T 2H − t 2H<br />
[Compare with (84).]<br />
The fractional Black-Scholes formula has been applied<br />
<strong>to</strong> price some options traded on the Brazilian market [44].<br />
Here, however, the option prices obtained with the formula<br />
above resulted considerably higher than those from the usual<br />
Black-Scholes formula. The practical relevance of the fractional<br />
Black-Scholes model <strong>to</strong> real markets thus needs <strong>to</strong> be<br />
investigated further.<br />
7.5 Multifractality in Finance<br />
The fact that the Hurst exponents of financial data often display<br />
considerable variability in time indicates, as already<br />
mentioned, that such time series cannot be satisfac<strong>to</strong>rily<br />
modeled in terms of a fractional Brownian motion, which is<br />
characterized by a constant H and would thus capture only<br />
a sort of average behavior of the actual price dynamics [35].<br />
In such cases, it would be more appropriate <strong>to</strong> model the<br />
data as a multifractal process.<br />
The notion of a multifractal was first introduced in the<br />
context of dynamical systems <strong>to</strong> describe physical processes<br />
taking place on a fractal support [45]. A rigorous exposition<br />
of multifractal measures is beyond the scope of the present<br />
notes, and so we will content ourselves with a rather intuitive<br />
description of multifractality. The basic idea here is<br />
that a monofractal process, such as the FBM, is characterized<br />
by a single exponent H, whereas for a multifractal a<br />
whole family (spectrum) of exponents is necessary, one for<br />
each moment of the distribution.<br />
We have seen above that the FBM is a Gaussian process<br />
whose standard deviation scales with time as<br />
√<br />
E[W 2 H (t)] = tH . (160)<br />
If we now introduce the generalized Hurst exponents H q as<br />
the corresponding scaling exponent for the 2q-th moment,<br />
that is,<br />
{ [ ]} 1/2q<br />
E W 2q<br />
H (t) = Cq t H q<br />
, (161)<br />
where C q is a constant, it then immediately follows from<br />
property (19) of the Gaussian distribution that<br />
H q = H. (162)<br />
That is, all higher-order Hurst exponents of the FBM are<br />
equal <strong>to</strong> H itself and hence the FBM is said <strong>to</strong> be a<br />
monofractal. Our working definition of a multifractal will<br />
then be a process for which the generalized Hurst exponents<br />
H q vary with q, or alternatively, that the quantity qH q does<br />
not scale linearly with q.<br />
In general, any method used <strong>to</strong> calculate the Hurst exponent<br />
H (see Sec. 7.1) can be adapted <strong>to</strong> obtain the generalized<br />
exponents H q . For example, the multifractal generalization<br />
of the DFA consists in calculating the qth-order<br />
fluctuation function F q (τ),<br />
{<br />
}<br />
Nτ<br />
1/2q<br />
1 ∑<br />
F q (τ) = |X(t) − Y τ (t)| 2q . (163)<br />
Nτ<br />
t=1<br />
In complete analogy with (148), the exponents H q are then<br />
obtained from the scaling<br />
F q (τ) = C q τ H q<br />
. (164)<br />
[We remark parenthetically that the multifractal DFA defined<br />
above is slightly different from the formulation introduced<br />
in Ref. [46], but such minor distinctions do not matter<br />
in practice.]<br />
As an illustration of the multifractal DFA, we have applied<br />
this method <strong>to</strong> the Ibovespa returns. For each q we<br />
computed the function F q (τ) defined in (164), plotted it in<br />
a double-logarithmic scale, and obtained the generalized exponent<br />
H q from the slope of the curve. In Fig. 12 it is plotted<br />
the resulting quantity qH q as a function of q. In this figure<br />
we clearly see that qH q deviates from the linear behavior expected<br />
for a monofractal, thus indicating that the time series<br />
of Ibovespa returns does indeed display multifractal behavior.<br />
Evidences of multifractal behavior have been seen in<br />
several other s<strong>to</strong>ck indexes [41].<br />
Multifractality has also been observed in many time series<br />
for currency exchange rates, and this has motivated the<br />
suggestion that there might perhaps be a formal analogy between<br />
turbulent flows and foreign currency exchange markets;<br />
see Ref. [11] for references <strong>to</strong> the original literature. In<br />
turbulence [47], there is an energy cascade from the large<br />
scales (where energy is fed in<strong>to</strong> the system) down <strong>to</strong> the<br />
small scales (where energy is dissipated by viscosity). In<br />
currency markets the analog would be a kind of information<br />
cascade in time from long-term inves<strong>to</strong>rs (that lake a longer<br />
view of the market) <strong>to</strong> short-term inves<strong>to</strong>rs (that watch the<br />
market very frequently) [11].
Brazilian Journal of Physics, vol. 34, no. 3B, September, 2004 1063<br />
3<br />
A<br />
Some Basic Definitions from Probability<br />
Theory<br />
A.1 Probability space<br />
qH q<br />
2<br />
1<br />
0<br />
0 1 2 3 4 5 6<br />
q<br />
Figure 12. The generalized Hurst exponents H q as a function of q<br />
for the Ibovespa. The dashed line indicates the linear behavior of a<br />
monofractal FBM with H = 0.6.<br />
In probability theory one usually imagines performing an<br />
experiment in which chance intervenes. The occurrence or<br />
nonoccurrence of such an experiment is called an outcome<br />
ω. The set of all possible elementary outcomes is denoted<br />
by Ω.<br />
<strong>An</strong> event A is a set of outcomes, i.e., a subset of Ω. We<br />
are interested in attributing a probability <strong>to</strong> events in Ω. If Ω<br />
is finite or countable, we could introduce a probability P (ω)<br />
for each individual outcome ω and then define the probability<br />
P (A) of an event A as the sum of the probabilities of all<br />
outcomes that make up the event A:<br />
P (A) = ∑ ω∈A<br />
P (ω).<br />
8 Conclusions<br />
In these notes, I tried <strong>to</strong> present a basic introduction <strong>to</strong> an interdisciplinary<br />
area that has become known, at least among<br />
physicists working on the field, as <strong>Econophysics</strong>. I started<br />
out by giving some basic notions about financial derivatives<br />
and illustrated how <strong>to</strong> price them with a simple binomial<br />
model. After this motivational introduction, I offered a concise<br />
description of Brownian motion and s<strong>to</strong>chastic calculus,<br />
which provide the necessary mathematical <strong>to</strong>ols <strong>to</strong> describe<br />
financial asset prices in continuous time. I then proceeded<br />
<strong>to</strong> discuss the Standard Model of Finance (SMF), namely,<br />
the Black-Scholes model for pricing financial derivatives.<br />
The formulation of the Efficient Market Hypothesis, which<br />
lies at the heart of the SMF, in terms of martingales and its<br />
consequences for pricing derivatives were also discussed.<br />
Finally, I briefly reviewed some recent work done mostly,<br />
but not exclusively, by physicists that have produced evidences<br />
that the SMF may not fully describe real markets. In<br />
this context, some possible extensions of the Black-Scholes<br />
model were considered.<br />
I should like <strong>to</strong> conclude by mentioning that other alternatives<br />
approaches <strong>to</strong> the problem of pricing financial<br />
derivatives have been proposed by physicists, using methods<br />
originally developed <strong>to</strong> treat physical problems. For instance,<br />
the option pricing problem was recently discussed<br />
in the context of the so-called non-extensive statistical mechanics<br />
[48]. A “Hamil<strong>to</strong>nian formulation” for this problem<br />
was also given in which the resulting “generalized Black-<br />
Scholes” equation is formally solved in terms of path integrals<br />
[49]. We refer the reader <strong>to</strong> Ref. [11] for a brief review<br />
of these and other recent developments in <strong>Econophysics</strong>.<br />
Acknowledgments<br />
I am grateful <strong>to</strong> Rogério L. Costa for many useful discussions<br />
and for providing Fig. 12. Financial support from<br />
the Brazilian agencies CNPq and FINEP and from the special<br />
research programs PRONEX is acknowledged.<br />
This procedure, however, will not work when Ω is uncountable,<br />
i.e., Ω is a continuous space such as R, since in this<br />
case the probability of any particular outcome is zero. Furthermore,<br />
a typical event will have uncountably many (i.e.<br />
a continuum of) outcomes. Hence the formula above is not<br />
applicable. That’s why we need the notion of a probability<br />
measure <strong>to</strong> be defined shortly.<br />
To do this, first we need <strong>to</strong> specify the class of ‘observable<br />
events’, i.e., the subsets of Ω <strong>to</strong> which a probability<br />
can be associated. If Ω is finite or countable, a partition of Ω<br />
would be the natural candidate. (Recall that a partition {A i }<br />
of a set Ω is a collection of disjoint subsets, i.e., A i ⊂ Ω and<br />
A i ∩ A j = ∅ for i ≠ j, whose union covers the whole set<br />
Ω, i.e., ⋃ i A i = Ω.) In the case of a continuous space this<br />
is not possible and a different class of subsets is in order.<br />
To be useful, such a class must be closed under the various<br />
set operations, such as union, intersection, complementarity,<br />
etc. This is done through the concept of a σ-algebra.<br />
Definition 10 A family F of subsets of Ω is a σ-algebra on<br />
Ω if the following conditions are fulfilled:<br />
1. ∅ ∈ F and Ω ∈ F<br />
2. A ∈ F =⇒ A c ∈ F, where A c = Ω \ A is the<br />
complement of A in Ω<br />
3. A 1 , A 2 , ... ∈ F =⇒<br />
∞⋃<br />
A i ∈ F<br />
i=1<br />
The par (Ω, F) is called a measurable space.<br />
The elements A ⊂ F of the σ-algebra F are called measurable<br />
sets or simply events. The idea here is that for a<br />
given set A ∈ F it is possible <strong>to</strong> ascertain whether any outcome<br />
ω belongs or not <strong>to</strong> A, and in this sense the event A is<br />
observable.<br />
The smallest σ-algebra consists of the empty set ∅ and<br />
the set Ω itself, i.e., F min = {∅, Ω}. The largest σ-algebra,
1064 Giovani L. Vasconcelos<br />
on the other hand, is made up of all subsets of Ω, which<br />
is known as the power set of Ω and denoted by 2 Ω , hence<br />
F max = 2 Ω . Intermediate σ-algebras can be generated in<br />
the following way. Start with a given family U of subsets of<br />
Ω and form the intersection of all σ-algebras that contain U:<br />
F U = ⋂ {F | F ⊃ U}. (165)<br />
In other words, F U is the smallest algebra that contains U as<br />
is called the algebra generated by U.<br />
We can now attribute a ‘probability of occurrence’ <strong>to</strong><br />
events A ∈ F via a probability measure on (Ω, F).<br />
Definition 11 A probability measure P on the measurable<br />
space (Ω, F) is a function P : F → [0, 1] such that<br />
1. P (∅) = 0 and P (Ω) = 1<br />
2. If A 1 , A 2 , ... ∈ F is a disjoint collection of elements<br />
of F, i.e., A i UA j = ∅ if i ≠ j, then P (U ∞ i=1 A i) =<br />
∑ ∞<br />
i=1 P (A i)<br />
The triple (Ω, F, P ) is called a probability space.<br />
A.2 Random variables<br />
Intuitively, a random variable X is a function that attributes<br />
<strong>to</strong> each outcome ω a real number x, i.e., X(ω) = x. We<br />
usually think of X as a random number whose value is determined<br />
by the outcome ω. A more formal definition is<br />
given in terms of measurable functions.<br />
Definition 12 Let (Ω, F, P ) be a probability space. A function<br />
f : Ω → R is measurable with respect <strong>to</strong> the σ-algebra<br />
F, or more compactly, F-measurable, if<br />
f −1 (U) ≡ {ω ∈ Ω|f(ω) ∈ U} ∈ F,<br />
for all open sets U ∈ R.<br />
The definition above means that for any given interval<br />
(a, b) ⊂ R there is a meaningful event A in Ω. In an abuse<br />
of language we usually refer <strong>to</strong> this event as A = {a < f <<br />
b}.<br />
Definition 13 A random variable X on a probability space<br />
(Ω, F, P ) is a F-measurable function.<br />
A random variable X naturally generates a σ-algebra.<br />
This is the algebra generated by all the sets X −1 (U), U ⊂<br />
R open, and is denoted F X . We think of F X as representing<br />
the ‘information’ generated by the random variable X. The<br />
σ-algebra F X contains the essential information about the<br />
structure of the random variable X; it contains all sets of the<br />
form {ω|a < X(ω) < b}.<br />
We also recall the definition of the probability distribution<br />
F (x) of a random variable X:<br />
F (x) = P (X ≤ x), for x ∈ R. (166)<br />
Random variables can be either discrete, if the only assume<br />
a finite or countably number of values x 1 , x 2 , ..., or continuous.<br />
Most continuous distributions of interest have a density<br />
f(x), i.e., a function f(x) such that<br />
F (x) =<br />
∫ x<br />
−∞<br />
f(x)dx. (167)<br />
This allows us <strong>to</strong> compute the probability of a given event<br />
A = {a ≤ X ≤ b} explicitly through the formula<br />
P (A) =<br />
∫ b<br />
A.3 S<strong>to</strong>chastic processes<br />
a<br />
f(x)dx. (168)<br />
Intuitively, a s<strong>to</strong>chastic process represents a dynamical system<br />
which evolve probabilistically in time. A formal definition<br />
is given below.<br />
Definition 14 A s<strong>to</strong>chastic process is a collection of random<br />
variables<br />
{X t } t∈T<br />
,<br />
defined on some probability space (Ω, F, P ) and<br />
parametrized by the variable t.<br />
We usually think of the label t as being time, so that X t<br />
would represent the (random) value of the quantity X, say,<br />
the price of a risky asset or the position of a Brownian particle,<br />
at time t. For most of the cases, we consider T <strong>to</strong> be the<br />
halfline [0, ∞). In this case we have a continuous-time process.<br />
Eventually, we shall also consider discrete-time processes,<br />
in which case the variable t assumes (non-negative)<br />
integer values, i.e., T = {0, 1, 2, ...}.<br />
It is perhaps worth emphasizing that a s<strong>to</strong>chastic process<br />
is a function of two variables. For a fixed time t, X t<br />
is a function of the random variable ω, i.e., X t = X t (ω).<br />
For a fixed outcome ω ∈ Ω, it is a function of time,<br />
X t = X t (ω), t ∈ T . This function of time is called a<br />
realization, path, or trajec<strong>to</strong>ry of the s<strong>to</strong>chastic process X t .<br />
Note, in particular, that in this context an outcome corresponds<br />
an entire realization or trajec<strong>to</strong>ry of the s<strong>to</strong>chastic<br />
process X.<br />
A s<strong>to</strong>chastic process is usually described in terms of<br />
the distributions it induces. The finite-dimensional distributions<br />
of the s<strong>to</strong>chastic process X t are the joint probability<br />
distributions p(x 1 , t 1 ; ..., x n , t n ) of the random variables<br />
X t1 , ..., X tn , for all possible choices of times t 1 , ..., t n ∈ T<br />
and every n ≥ 1. The finite-dimensional distributions determine<br />
many (but not all) relevant properties of a s<strong>to</strong>chastic<br />
process. A special class of s<strong>to</strong>chastic processes are the stationary<br />
ones.<br />
Definition 15 A s<strong>to</strong>chastic process is said <strong>to</strong> be stationary<br />
if all its finite-dimensional distributions are invariant under<br />
a time translation, that is,<br />
p(x 1 , t 1 + τ; ..., x n , t n + τ) = p(x 1 , t 1 ; ..., x n , t n ),<br />
for any τ > 0.<br />
<strong>An</strong>other important class of s<strong>to</strong>chastic process are Gaussian<br />
processes, where all finite-dimensional distributions are<br />
(multivariate) Gaussians.
Brazilian Journal of Physics, vol. 34, no. 3B, September, 2004 1065<br />
References<br />
[1] J. C. Hull, Options, Futures, and Other Derivatives, 3rd ed.,<br />
Prentice-Hall, Upper Saddle River, NJ, 1997.<br />
[2] D. Duffie, Dynamic Asset Pricing, 3rd ed., Prince<strong>to</strong>n University<br />
Press, Prince<strong>to</strong>n, NJ, 2001.<br />
[3] J. E. Ingersoll, Theory of Financial Decision Making, Rowman<br />
& Littlefield, Savage, MD, 1987.<br />
[4] T. Bjork, Arbitrage Theory in Continuous Time, Oxford<br />
Univ. Press, New York, 1998.<br />
[5] A. N. Shiryaev, Essentials of S<strong>to</strong>chastic Finance: Facts, Models,<br />
Theory, World Scientific, Singapore, 1999.<br />
[6] P. Wilmott, J. Dewynne, and S. Howison, The Mathematics<br />
of Financial Derivatives (A Student <strong>Introduction</strong>), Cambridge<br />
Univ. Press, Cambridge, 1996.<br />
[7] T. Mikosch, Elementary S<strong>to</strong>chastic Calculus: with Finance in<br />
View, World Scientific, 1998.<br />
[8] B. Øksendal, S<strong>to</strong>chastic Differential Equations: an <strong>Introduction</strong><br />
with Applications, 5th ed., Springer, Berlin, 1998.<br />
[9] R. Mantegna and H. E. Stanley, <strong>An</strong> <strong>Introduction</strong> <strong>to</strong> <strong>Econophysics</strong>,<br />
Cambridge Univ. Press, Cambridge, 2000.<br />
[10] J.-P. Bouchaud and M. Potters, Theory of Financial Risks:<br />
From Statistical Physics <strong>to</strong> Risk Management, Cambridge<br />
Univ. Press, Cambridge, 2000.<br />
[11] J. Voit, The Statistical Mechanics of Financial Markets,<br />
Springer, Berlin, 2003.<br />
[12] F. Black and M. Scholes, J. Polit. Econ. 81, 637 (1973)<br />
[13] R. C. Mer<strong>to</strong>n, Bell J. Econ. Manag. Sci. 4, 141 (1973)<br />
[14] Bachelier, La Thóerie de la Spéculation [Ph.D. thesis in<br />
mathematics], <strong>An</strong>n. Sci. Ecole Norm. Super., Sér. 3, 17, 21<br />
(1900). Translated in: P. H. Cootner (ed.), The Random Character<br />
of S<strong>to</strong>ck Market Prices, MIT Press, Cambridge, MA,<br />
1988.<br />
[15] F. Reif, Fundamentals of Statistical and Thermal Physics,<br />
McGraw-Hill, Tokyo, 1965.<br />
[16] A. Einstein, <strong>An</strong>n. Physik (Leipzig) 17, 549 (1905)<br />
[17] N. Wiener, J. Math. Phys. Math. 2, 131 (1923).<br />
[18] K. Itô, Proc. Japan Acad. 22, 32 (1946);<br />
Mem. Amer. Math. Soc. 4, 1 (1951).<br />
[19] C. W. Gardiner, Handbook of S<strong>to</strong>chastic Methods: for<br />
Physics, Chemistry, and the Natural Sciences, 2nd ed.,<br />
Springer, Berlin, 1985.<br />
[20] A. G. Malliaris and W. A. Brock, S<strong>to</strong>chastic Methods in Economics<br />
and Finance, North-Holland, Amsterdam, 1982.<br />
[21] P. Billingsley, Probability and Measure, 3rd ed., Wiley, New<br />
York, 1995.<br />
[22] B. Mandelbrot, J. Business 40, 394 (1963).<br />
[23] H. M. Gupta and J. R. Campanha, Physica A 268, 231 (1999).<br />
[24] R. Matsushita, P. Rathie, S. da Silva, Physica A 326, 544<br />
(2003).<br />
[25] L. C. Miranda and R. Riera, Physica A 297, 509-520 (2001).<br />
[26] W. Schoutens, Lévy Processes in Finance: Pricing Financial<br />
Derivatives, Wiley, 2003.<br />
[27] A. Matacz, Int. J. Theor. Appl. Financ. 3, 143-160 (2000).<br />
[28] J. L. McCauley and G. H. Gunaratne, Physica A 329, 178-198<br />
(2003).<br />
[29] A. C. Silva, R. E. Prange, and V. M. Yakovenko, condmat/0401225,<br />
2004.<br />
[30] K. Matia, M. Pal, H. E. Stanley, and H. Salunkay, Europhys.<br />
Lett. 66, 909-914 (2004).<br />
[31] M. S. Taqqu, V. Teverovsky, W. Willinger, Fractals 3 (1995)<br />
785.<br />
[32] H. E. Hurst, Trans. Am. Soc. Civ. Eng. 116 (1951) 770; H.<br />
E. Hurst, R. P. Black, and Y. M. Simaika, Long-Term S<strong>to</strong>rage:<br />
<strong>An</strong> Experimental Study, Constable, London, 1965.<br />
[33] C.-K Peng, S. V. Buldyrev, S. Havlin, M. Simons, H. E. Stanley,<br />
A. L. Goldberger, Phys. Rev. E 49 (1994) 1685.<br />
[34] J. G. Moreira, J. Kamphorst Leal da Silva, S. Oliffson Kamphorst,<br />
J. Phys. A 27 (1994) 8079.<br />
[35] R. L. Costa and G. L. Vasconcelos, Physica A 329, 231<br />
(2003).<br />
[36] K. Hu, P. Ch. Ivanov, Z. Chen, P. Carpena, H. E. Stanley,<br />
Phys. Rev. E 64 (2001) 011114.<br />
[37] B. Mandelbrot and J. W. van Ness, SIAM Review 10, 422-<br />
437 (1968).<br />
[38] E. E. Peters, Fractal Market <strong>An</strong>alysis: Applying Chaos Theory<br />
<strong>to</strong> Investment and Economics, Wiley, New York, 1994.<br />
[39] N. Vandewalle, M. Ausloos, Physica A 246 (1997) 454.<br />
[40] P. Grau-Carles, Physica A 287 (2000) 396.<br />
[41] T. Di Matteo, T. Aste, M. M. Dacorogna, Physica A 324, 183<br />
(2003); Cond-Mat preprint 0302434, 2003.<br />
[42] Y. Hu and B. Øksendal, “Fractional white noise calculus and<br />
applications <strong>to</strong> Finance,” Preprint University of Oslo (2000).<br />
[43] C. Necula, “Option pricing in a fractional Brownian motion<br />
environment,” Preprint Academy of Economic Studies,<br />
Bucharest (Romenia), 2002.<br />
[44] D. O. Cajueiro and J. J. Barbachan, “Volatility estimation and<br />
option pricing with the fractional Brownian motion,” preprint,<br />
2003.<br />
[45] E. Ott, Chaos in Dynamical Systems, Cambridge University<br />
Press, Cambridge, 1993.<br />
[46] J. W. Kantelhardt, S. A. Zschiegner, E. Koscielny-Bunde,<br />
A. Bunde, S. Havlin, and H. E. Stanley, Phys. Rev. E (2001).<br />
[47] L. Landau and E.M. Lipschitz, Fluid Mechanics, Pergamon<br />
Press, Oxford, 1987.<br />
[48] R. Osorio, L. Borland, and C. Tsallis, in Nonextensive<br />
Entropy: Interdisciplinary Applications, C. Tsallis and<br />
M. Gell-Mann (eds.), Oxford Press, 2004; L. Borland,<br />
Phys. Rev. Lett. 89, 098701 (2002).<br />
[49] H. Kleinert, Physica A 312, 217 (2002).