

2002 - OPEC
2002 - OPEC
2002 - OPEC

You also want an ePaper? Increase the reach of your titles
YUMPU automatically turns print PDFs into web optimized ePapers that Google loves.
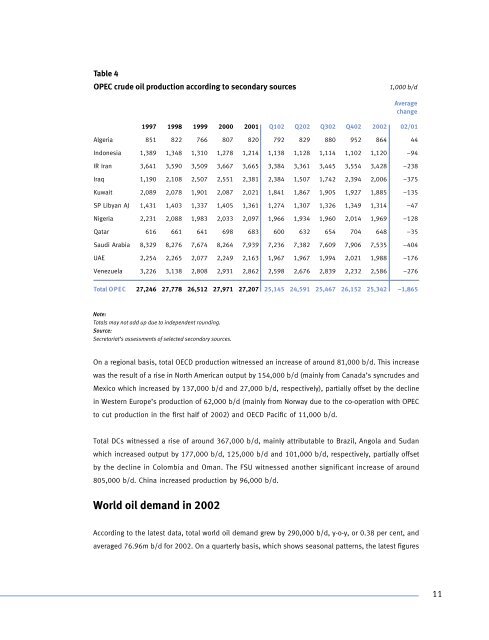
Table 4<br />
<strong>OPEC</strong> crude oil production according to secondary sources<br />
Note:<br />
Totals may not add up due to independent rounding.<br />
Source:<br />
Secretariat’s assessments of selected secondary sources.<br />
1,000 b/d<br />
Average<br />
change<br />
1997 1998 1999 2000 2001 Q102 Q202 Q302 Q402 <strong>2002</strong> 02/01<br />
Algeria 851 822 766 807 820 792 829 880 952 864 44<br />
Indonesia 1,389 1,348 1,310 1,278 1,214 1,138 1,128 1,114 1,102 1,120 –94<br />
IR Iran 3,641 3,590 3,509 3,667 3,665 3,384 3,361 3,445 3,554 3,428 –238<br />
Iraq 1,190 2,108 2,507 2,551 2,381 2,384 1,507 1,742 2,394 2,006 –375<br />
Kuwait 2,089 2,078 1,901 2,087 2,021 1,841 1,867 1,905 1,927 1,885 –135<br />
SP Libyan AJ 1,431 1,403 1,337 1,405 1,361 1,274 1,307 1,326 1,349 1,314 –47<br />
Nigeria 2,231 2,088 1,983 2,033 2,097 1,966 1,934 1,960 2,014 1,969 –128<br />
Qatar 616 661 641 698 683 600 632 654 704 648 –35<br />
Saudi Arabia 8,329 8,276 7,674 8,264 7,939 7,236 7,382 7,609 7,906 7,535 –404<br />
UAE 2,254 2,265 2,077 2,249 2,163 1,967 1,967 1,994 2,021 1,988 –176<br />
Venezuela 3,226 3,138 2,808 2,931 2,862 2,598 2,676 2,839 2,232 2,586 –276<br />
Total O P E C 27,246 27,778 26,512 27,971 27,207 25,145 24,591 25,467 26,152 25,342 –1,865<br />
On a regional basis, total OECD production witnessed an increase of around 81,000 b/d. This increase<br />
was the result of a rise in North American output by 154,000 b/d (mainly from Canada’s syncrudes and<br />
Mexico which increased by 137,000 b/d and 27,000 b/d, respectively), partially offset by the decline<br />
in Western Europe’s production of 62,000 b/d (mainly from Norway due to the co-operation with <strong>OPEC</strong><br />
to cut production in the first half of <strong>2002</strong>) and OECD Pacific of 11,000 b/d.<br />
Total DCs witnessed a rise of around 367,000 b/d, mainly attributable to Brazil, Angola and Sudan<br />
which increased output by 177,000 b/d, 125,000 b/d and 101,000 b/d, respectively, partially offset<br />
by the decline in Colombia and Oman. The FSU witnessed another significant increase of around<br />
805,000 b/d. China increased production by 96,000 b/d.<br />
World oil demand in <strong>2002</strong><br />
According to the latest data, total world oil demand grew by 290,000 b/d, y-o-y, or 0.38 per cent, and<br />
averaged 76.96m b/d for <strong>2002</strong>. On a quarterly basis, which shows seasonal patterns, the latest figures<br />
11


