

2002 - OPEC
2002 - OPEC
2002 - OPEC

Create successful ePaper yourself
Turn your PDF publications into a flip-book with our unique Google optimized e-Paper software.
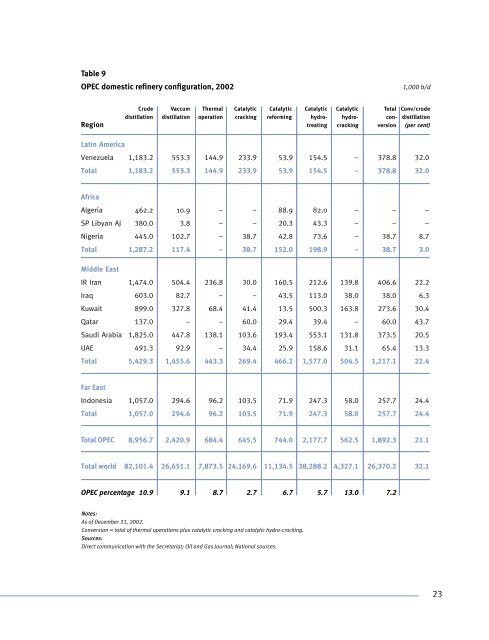
Table 9<br />
<strong>OPEC</strong> domestic refinery configuration, <strong>2002</strong><br />
Crude Vaccum Thermal Catalytic Catalytic Catalytic Catalytic Total Conv/crude<br />
distillation distillation operation cracking reforming hydro- hydro- con- distillation<br />
Region treating cracking version (per cent)<br />
Latin America<br />
Venezuela 1,183.2 553.3 144.9 233.9 53.9 154.5 – 378.8 32.0<br />
Total 1,183.2 553.3 144.9 233.9 53.9 154.5 – 378.8 32.0<br />
Africa<br />
Algeria 462.2 10.9 – – 88.9 82.0 – – –<br />
SP Libyan AJ 380.0 3.8 – – 20.3 43.3 – – –<br />
Nigeria 445.0 102.7 – 38.7 42.8 73.6 – 38.7 8.7<br />
Total 1,287.2 117.4 – 38.7 152.0 198.9 – 38.7 3.0<br />
Middle East<br />
IR Iran 1,474.0 504.4 236.8 30.0 160.5 212.6 139.8 406.6 22.2<br />
Iraq 603.0 82.7 – – 43.5 113.0 38.0 38.0 6.3<br />
Kuwait 899.0 327.8 68.4 41.4 13.5 500.3 163.8 273.6 30.4<br />
Qatar 137.0 – – 60.0 29.4 39.4 – 60.0 43.7<br />
Saudi Arabia 1,825.0 447.8 138.1 103.6 193.4 553.1 131.8 373.5 20.5<br />
UAE 491.3 92.9 – 34.4 25.9 158.6 31.1 65.4 13.3<br />
Total 5,429.3 1,455.6 443.3 269.4 466.2 1,577.0 504.5 1,217.1 22.4<br />
Far East<br />
Indonesia 1,057.0 294.6 96.2 103.5 71.9 247.3 58.0 257.7 24.4<br />
Total 1,057.0 294.6 96.2 103.5 71.9 247.3 58.0 257.7 24.4<br />
Total <strong>OPEC</strong> 8,956.7 2,420.9 684.4 645.5 744.0 2,177.7 562.5 1,892.3 21.1<br />
Total world 82,101.4 26,651.1 7,873.5 24,169.6 11,134.5 38,288.2 4,327.1 26,370.2 32.1<br />
<strong>OPEC</strong> percentage 10.9 9.1 8.7 2.7 6.7 5.7 13.0 7.2<br />
Notes:<br />
As of December 31, <strong>2002</strong>.<br />
Conversion = total of thermal operations plus catalytic cracking and catalytic hydro-cracking.<br />
Sources:<br />
Direct communication with the Secretariat; Oil and Gas Journal; National sources.<br />
1,000 b/d<br />
23


