

2002 - OPEC
2002 - OPEC
2002 - OPEC

You also want an ePaper? Increase the reach of your titles
YUMPU automatically turns print PDFs into web optimized ePapers that Google loves.
24<br />
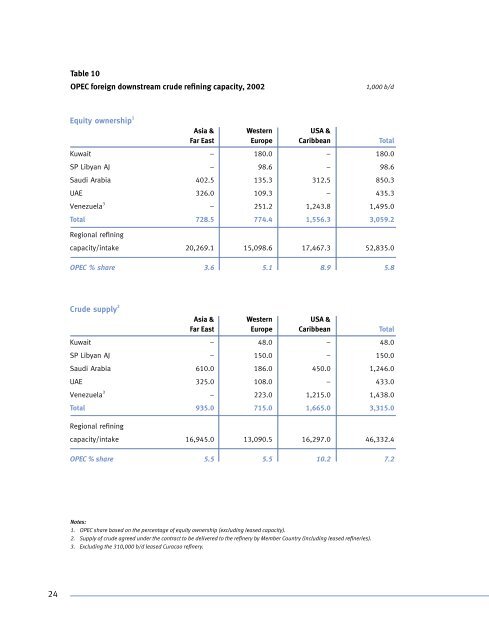
Table 10<br />
<strong>OPEC</strong> foreign downstream crude refining capacity, <strong>2002</strong> 1,000 b/d<br />
Equity ownership 1<br />
Asia & Western USA &<br />
Far East Europe Caribbean Total<br />
Kuwait – 180.0 – 180.0<br />
SP Libyan AJ – 98.6 – 98.6<br />
Saudi Arabia 402.5 135.3 312.5 850.3<br />
UAE 326.0 109.3 – 435.3<br />
Venezuela 3 – 251.2 1,243.8 1,495.0<br />
Total 728.5 774.4 1,556.3 3,059.2<br />
Regional refining<br />
capacity/intake 20,269.1 15,098.6 17,467.3 52,835.0<br />
<strong>OPEC</strong> % share 3.6 5.1 8.9 5.8<br />
Crude supply 2<br />
Asia & Western USA &<br />
Far East Europe Caribbean Total<br />
Kuwait – 48.0 – 48.0<br />
SP Libyan AJ – 150.0 – 150.0<br />
Saudi Arabia 610.0 186.0 450.0 1,246.0<br />
UAE 325.0 108.0 – 433.0<br />
Venezuela 3 – 223.0 1,215.0 1,438.0<br />
Total 935.0 715.0 1,665.0 3,315.0<br />
Regional refining<br />
capacity/intake 16,945.0 13,090.5 16,297.0 46,332.4<br />
<strong>OPEC</strong> % share 5.5 5.5 10.2 7.2<br />
Notes:<br />
1. <strong>OPEC</strong> share based on the percentage of equity ownership (excluding leased capacity).<br />
2. Supply of crude agreed under the contract to be delivered to the refinery by Member Country (including leased refineries).<br />
3. Excluding the 310,000 b/d leased Curacao refinery.


