2012 Comprehensive Annual Financial Report - City of Oklahoma City
2012 Comprehensive Annual Financial Report - City of Oklahoma City
2012 Comprehensive Annual Financial Report - City of Oklahoma City

Create successful ePaper yourself
Turn your PDF publications into a flip-book with our unique Google optimized e-Paper software.
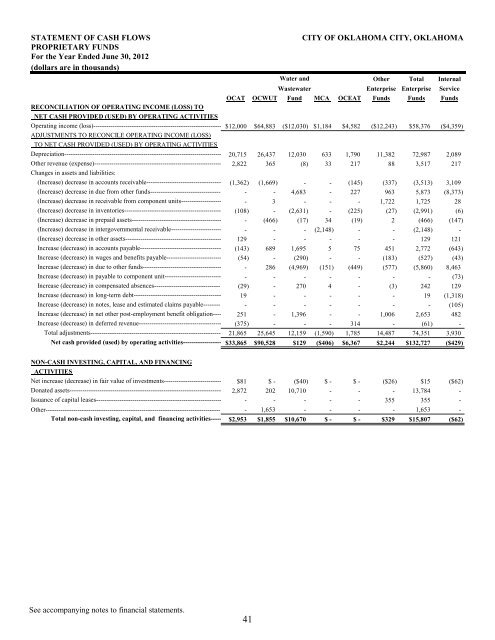
STATEMENT OF CASH FLOWS<br />
CITY OF OKLAHOMA CITY, OKLAHOMA<br />
PROPRIETARY FUNDS<br />
For the Year Ended June 30, <strong>2012</strong><br />
(dollars are in thousands)<br />
Water and Other Total Internal<br />
Wastewater Enterprise Enterprise Service<br />
OCAT OCWUT Fund MCA OCEAT Funds Funds Funds<br />
RECONCILIATION OF OPERATING INCOME (LOSS) TO<br />
NET CASH PROVIDED (USED) BY OPERATING ACTIVITIES<br />
Operating income (loss)------------------------------------------------------------ $12,000 $64,883 ($12,030) $1,184 $4,582 ($12,243) $58,376 ($4,359)<br />
ADJUSTMENTS TO RECONCILE OPERATING INCOME (LOSS)<br />
TO NET CASH PROVIDED (USED) BY OPERATING ACTIVITIES<br />
Depreciation-------------------------------------------------------------------------- 20,715 26,437 12,030 633 1,790 11,382 72,987 2,089<br />
Other revenue (expense)------------------------------------------------------------ 2,822 365 (8) 33 217 88 3,517 217<br />
Changes in assets and liabilities:<br />
(Increase) decrease in accounts receivable----------------------------------- (1,362) (1,669) - - (145) (337) (3,513) 3,109<br />
(Increase) decrease in due from other funds--------------------------------- - - 4,683 - 227 963 5,873 (8,373)<br />
(Increase) decrease in receivable from component units------------------- - 3 - - - 1,722 1,725 28<br />
(Increase) decrease in inventories---------------------------------------------- (108) - (2,631) - (225) (27) (2,991) (6)<br />
(Increase) decrease in prepaid assets------------------------------------------ - (466) (17) 34 (19) 2 (466) (147)<br />
(Increase) decrease in intergovernmental receivable------------------------ - - - (2,148) - - (2,148) -<br />
(Increase) decrease in other assets--------------------------------------------- 129 - - - - - 129 121<br />
Increase (decrease) in accounts payable-------------------------------------- (143) 689 1,695 5 75 451 2,772 (643)<br />
Increase (decrease) in wages and benefits payable-------------------------- (54) - (290) - - (183) (527) (43)<br />
Increase (decrease) in due to other funds------------------------------------- - 286 (4,969) (151) (449) (577) (5,860) 8,463<br />
Increase (decrease) in payable to component unit--------------------------- - - - - - - - (73)<br />
Increase (decrease) in compensated absences------------------------------- (29) - 270 4 - (3) 242 129<br />
Increase (decrease) in long-term debt----------------------------------------- 19 - - - - - 19 (1,318)<br />
Increase (decrease) in notes, lease and estimated claims payable-------- - - - - - - - (105)<br />
Increase (decrease) in net other post-employment benefit obligation---- 251 - 1,396 - - 1,006 2,653 482<br />
Increase (decrease) in deferred revenue--------------------------------------- (375) - - - 314 - (61) -<br />
Total adjustments------------------------------------------------------------- 21,865 25,645 12,159 (1,590) 1,785 14,487 74,351 3,930<br />
Net cash provided (used) by operating activities------------------ $33,865 $90,528 $129 ($406) $6,367 $2,244 $132,727 ($429)<br />
NON-CASH INVESTING, CAPITAL, AND FINANCING<br />
ACTIVITIES<br />
Net increase (decrease) in fair value <strong>of</strong> investments--------------------------- $81 $ - ($40) $ - $ - ($26) $15 ($62)<br />
Donated assets----------------------------------------------------------------------- 2,872 202 10,710 - - - 13,784 -<br />
Issuance <strong>of</strong> capital leases----------------------------------------------------------- - - - - - 355 355 -<br />
Other---------------------------------------------------------------------------------- - 1,653 - - - - 1,653 -<br />
Total non-cash investing, capital, and financing activities----- $2,953 $1,855 $10,670 $ - $ - $329 $15,807 ($62)<br />
cash 0 0 0 0 0 0 0 0<br />
operating activities 0 0 0 0 0 0 0 0<br />
cash beg to py end 0 0 0 0 0 0 0 0<br />
See accompanying notes to financial statements.<br />
41