Immigration Shaping America - Population Reference Bureau
Immigration Shaping America - Population Reference Bureau
Immigration Shaping America - Population Reference Bureau

Create successful ePaper yourself
Turn your PDF publications into a flip-book with our unique Google optimized e-Paper software.
<strong>Population</strong><br />
Vol. 58, No. 2<br />
June 2003<br />
BULLETIN<br />
A publication of the <strong>Population</strong> <strong>Reference</strong> <strong>Bureau</strong><br />
<strong>Immigration</strong>: <strong>Shaping</strong><br />
and Reshaping <strong>America</strong><br />
by Philip Martin and Elizabeth Midgley<br />
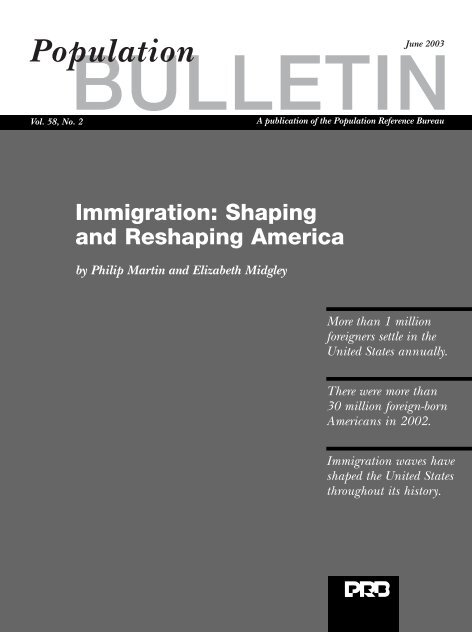
More than 1 million<br />
foreigners settle in the<br />
United States annually.<br />
There were more than<br />
30 million foreign-born<br />
<strong>America</strong>ns in 2002.<br />
<strong>Immigration</strong> waves have<br />
shaped the United States<br />
throughout its history.
<strong>Population</strong> <strong>Reference</strong> <strong>Bureau</strong> (PRB)<br />
Founded in 1929, the <strong>Population</strong> <strong>Reference</strong> <strong>Bureau</strong> is the leader in providing timely and<br />
objective information on U.S. and international population trends and their implications.<br />
PRB informs policymakers, educators, the media, and concerned citizens working in the<br />
public interest around the world through a broad range of activities, including publications,<br />
information services, seminars and workshops, and technical support. Our efforts are supported<br />
by government contracts, foundation grants, individual and corporate contributions,<br />
and the sale of publications. PRB is governed by a Board of Trustees representing diverse<br />
community and professional interests.<br />
Officers<br />
Michael P. Bentzen, Chairman of the Board,<br />
Partner, Hughes and Bentzen, PLLC, Washington, D.C.<br />
Patricia Gober, Vice Chairwoman of the Board,<br />
Professor of Geography, Arizona State University, Tempe<br />
James E. Scott, Acting President,<br />
<strong>Population</strong> <strong>Reference</strong> <strong>Bureau</strong>, Washington, D.C.<br />
Jodie T. Allen, Secretary of the Board,<br />
Managing Editor, U.S. News & World Report, Washington, D.C.<br />
Richard F. Hokenson, Treasurer of the Board,<br />
Director, Hokenson and Company, Lawrenceville, New Jersey<br />
Trustees<br />
Patty Perkins Andringa, Consultant and Facilitator, Bethesda, Maryland<br />
Suzanne M. Bianchi, Professor of Sociology and Director of the <strong>Population</strong> Research Center, University of<br />
Maryland, College Park<br />
Pape Syr Diagne, Senior Advisor/Consultant, Centre for African Family Studies, Nairobi, Kenya<br />
Bert T. Edwards, Executive Director, Office of Historical Trust Accounting, Office of the Secretary, U.S.<br />
Department of the Interior, Washington, D.C.<br />
James H. Johnson Jr., William Rand Kenan Jr. Distinguished Professor and Director, Urban Investment<br />
Strategies Center, University of North Carolina, Chapel Hill<br />
Terry D. Peigh, Executive Vice President and Director of Corporate Operations, Foote, Cone & Belding,<br />
Chicago, Illinois<br />
Francis L. Price, Chairman and CEO, Q3 Industries and Interact Performance Systems, Columbus, Ohio<br />
Douglas Richardson, Executive Director, Association of <strong>America</strong>n Geographers, Washington, D.C.<br />
Gary B. Schermerhorn, Managing Director of Technology, Goldman, Sachs & Company, New York<br />
Barbara Boyle Torrey, Independent Writer and Consultant, Washington, D.C.<br />
Leela Visaria, Professor, Gujarat Institute of Development Research, Ahmedabad, India<br />
Montague Yudelman, Senior Fellow, World Wildlife Fund, Washington, D.C.<br />
Mildred Marcy, Chairwoman Emerita<br />
Editor: Mary Mederios Kent<br />
Production/Design: Tara Hall<br />
The <strong>Population</strong> Bulletin is published four times a year and distributed to members of the <strong>Population</strong><br />
<strong>Reference</strong> <strong>Bureau</strong>. <strong>Population</strong> Bulletins are also available for $7 (discounts for bulk orders).<br />
To become a PRB member or to order PRB materials, contact PRB, 1875 Connecticut Ave.,<br />
NW, Suite 520, Washington, DC 20009-5728; Tel.: 800-877-9881; Fax: 202-328-3937;<br />
E-mail: popref@prb.org; Website: www.prb.org.<br />
The suggested citation, if you quote from this publication, is: Philip Martin and Elizabeth Midgley,<br />
“<strong>Immigration</strong>: <strong>Shaping</strong> and Reshaping <strong>America</strong>,” <strong>Population</strong> Bulletin 58, no. 2 (Washington,<br />
DC: <strong>Population</strong> <strong>Reference</strong> <strong>Bureau</strong>, 2003). For permission to reproduce portions from the <strong>Population</strong><br />
Bulletin, write to PRB, Attn: Permissions.<br />
© 2003 by the <strong>Population</strong> <strong>Reference</strong> <strong>Bureau</strong><br />
ISSN 0032-468X<br />
Printed on recycled paper
<strong>Population</strong><br />
Vol. 58, No. 2<br />
June 2003<br />
BULLETIN<br />
A publication of the <strong>Population</strong> <strong>Reference</strong> <strong>Bureau</strong><br />
<strong>Immigration</strong>: <strong>Shaping</strong> and<br />
Reshaping <strong>America</strong><br />
Introduction . . . . . . . . . . . . . . . . . . . . . . . . . . . . . . . . . . . . . . . . . . . . . . . . . . . . . . 3<br />
<strong>Immigration</strong> Patterns and Policies . . . . . . . . . . . . . . . . . . . . . . . . . . . . . . . . . 5<br />
Figure 1. U.S. Immigrants by Region of Birth, 1960s to 1990s . . . . . . . . . . . . . 4<br />
Table 1. Foreigners Entering and Exiting the United States,<br />
Fiscal Year 2001 . . . . . . . . . . . . . . . . . . . . . . . . . . . . . . . . . . . . . . . . . . . . . . . . 5<br />
Box 1. Immigrants, Refugees, Nonimmigrants, and Unauthorized Aliens . . . 6<br />
Public Opinion . . . . . . . . . . . . . . . . . . . . . . . . . . . . . . . . . . . . . . . . . . . . . . . . . . . 10<br />
Four Waves of <strong>Immigration</strong> . . . . . . . . . . . . . . . . . . . . . . . . . . . . . . . . . . . . . . . 11<br />
Figure 2. <strong>Immigration</strong> to the United States, 1820 to 2001 . . . . . . . . . . . . . . . 12<br />
U.S. <strong>Immigration</strong> Policies. . . . . . . . . . . . . . . . . . . . . . . . . . . . . . . . . . . . . . . . . 14<br />
Table 2. Numerical Limits for Immigrants, Fiscal Year 2001. . . . . . . . . . . . . . 18<br />
<strong>Immigration</strong> and U.S. <strong>Population</strong>. . . . . . . . . . . . . . . . . . . . . . . . . . . . . . . . . . 20<br />
Table 3. U.S.-Born and Foreign-Born <strong>Population</strong>, 1980 to 2000. . . . . . . . . . . 20<br />
Box 2. The Foreign-Born <strong>Population</strong> . . . . . . . . . . . . . . . . . . . . . . . . . . . . . . . . 21<br />
Figure 3. U.S. <strong>Population</strong> by Race and Ethnic Group, 1970, 2000,<br />
and 2050 . . . . . . . . . . . . . . . . . . . . . . . . . . . . . . . . . . . . . . . . . . . . . . . . . . . . 22<br />
Economic Effects . . . . . . . . . . . . . . . . . . . . . . . . . . . . . . . . . . . . . . . . . . . . . . . . 23<br />
Figure 4. 2002 Educational Levels of U.S.-Born <strong>America</strong>ns and<br />
Foreign-Born <strong>America</strong>ns Who Arrived in or After 1990 . . . . . . . . . . . . . . 24<br />
Box 3. <strong>Immigration</strong> Trade-Offs . . . . . . . . . . . . . . . . . . . . . . . . . . . . . . . . . . . . . 25<br />
Migration From Mexico and NAFTA . . . . . . . . . . . . . . . . . . . . . . . . . . . . . . . 29<br />
Figure 5. The Long-Term Fiscal Impact of One Immigrant: 1996 . . . . . . . . . 30<br />
Figure 6. Mexico-U.S. Migration With and Without NAFTA . . . . . . . . . . . . . . 32<br />
Naturalization and Politics . . . . . . . . . . . . . . . . . . . . . . . . . . . . . . . . . . . . . . . 33<br />
Figure 7. Foreign-Born Entering Between 1980 and 1989 Who<br />
Became U.S. Citizens by 2002, by Region of Birth. . . . . . . . . . . . . . . . . . . 34<br />
Immigrants in <strong>America</strong>n Society . . . . . . . . . . . . . . . . . . . . . . . . . . . . . . . . . . 35<br />
Box 4. ‘Melting-Pot’ vs. ‘Salad-Bowl,’ or Integration vs. Pluralism . . . . . . . . . 36<br />
Table 4. Language Spoken at Home, 2000 . . . . . . . . . . . . . . . . . . . . . . . . . . . . 37<br />
Continued on page 2<br />
3
An Unfinished Nation . . . . . . . . . . . . . . . . . . . . . . . . . . . . . . . . . . . . . . . . . . . . 39<br />
<strong>Reference</strong>s . . . . . . . . . . . . . . . . . . . . . . . . . . . . . . . . . . . . . . . . . . . . . . . . . . . . . . 41<br />
Suggested Resources . . . . . . . . . . . . . . . . . . . . . . . . . . . . . . . . . . . . . . . . . . . . 44<br />
About the Authors<br />
Philip Martin is professor of agricultural economics at the University of California–Davis,<br />
chair of the University of California’s Comparative <strong>Immigration</strong> and Integration Program, and<br />
editor of Migration News, a monthly summary of current migration developments. He studied<br />
labor economics and agricultural economics at the University of Wisconsin–Madison, where he<br />
earned his Ph.D. in 1975. Martin has published extensively on farm labor, labor migration,<br />
economic development, and immigration issues. He has testified before the U.S. Congress and<br />
state and local agencies and was awarded the Distinguished Public Service Award by<br />
UC–Davis in 1994 for providing assistance to other countries.<br />
Elizabeth Midgley is a long-time observer and analyst of U.S. immigration trends and policy<br />
formation. She is president of Working English, a foundation that helps newcomers learn<br />
English. She was involved with immigration issues while she was a producer for CBS News<br />
from 1970 to 1988.<br />
The authors would like to acknowledge the valuable contributions of Michael Hoefer, Jeffrey<br />
Passel, and Karen Woodrow-Lafield, who reviewed the manuscript.<br />
4<br />
© 2003 by the <strong>Population</strong> <strong>Reference</strong> <strong>Bureau</strong>
<strong>Immigration</strong>: <strong>Shaping</strong><br />
and Reshaping <strong>America</strong><br />
by Philip Martin and Elizabeth Midgley<br />
About 95,000 foreigners a day<br />
arrive in the United States, but<br />
most do not intend to stay long.<br />
More than 90,000 are nonimmigrant<br />
tourists, business people, students, and<br />
workers who are welcomed at airports<br />
and border crossings. About 3,000 are<br />
immigrants or refugees who have been<br />
invited to become permanent residents<br />
of the United States, and more<br />
than 1,000 are unauthorized foreigners,<br />
usually Mexicans, who evade border<br />
controls, enter the United States,<br />
and settle. 1<br />
Is the arrival of so many foreigners<br />
to be welcomed or feared? There<br />
is no single answer, which helps to<br />
explain why <strong>America</strong>ns are ambivalent<br />
about immigration. The United<br />
States has always celebrated its immigrant<br />
heritage, and <strong>America</strong>n leaders<br />
often recount the story of renewal<br />
and rebirth brought by newcomers<br />
from abroad. Yet <strong>America</strong>ns have<br />
worried since the days of the founders<br />
about potential economic, political,<br />
and cultural change caused by<br />
immigration.<br />
Since Sept. 11, 2001, there is deepening<br />
concern about another aspect<br />
of immigration: that some foreigners<br />
may harm <strong>America</strong>ns. In the aftermath<br />
of the terrorist attacks, the U.S.<br />
government took steps to identify<br />
potential terrorists in the United<br />
States and prevent others from entering.<br />
Political leaders stated clearly that<br />
they did not want to shut the door to<br />
immigrants and legitimate visitors, but<br />
Photo removed for copyright reasons.<br />
Our history and traditions suggest that, within a few<br />
decades, most of today’s immigrants will be an integral<br />
part of the ever-changing <strong>America</strong>n community.<br />
they did want to keep out terrorists<br />
and those who support them. Today,<br />
the United States is grappling with the<br />
right balance between welcoming foreigners<br />
and protecting <strong>America</strong>ns.<br />
For the nation’s first 100 years, the<br />
United States facilitated immigration,<br />
welcoming foreigners who could help<br />
to settle a vast country. Beginning in<br />
the 1880s, the United States began<br />
to bar certain types of foreigners—<br />
including prostitutes, low-skilled contract<br />
workers, and Chinese—ushering<br />
in the phase of qualitative restrictions<br />
on immigration. In the 1920s, the<br />
United States developed the current<br />
qualitative and quantitative restric-<br />
5
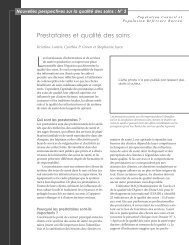
Figure 1<br />
U.S. Immigrants by Region of Birth, 1960s to 1990s<br />
Immigrants in millions<br />
6<br />
3.2<br />
38%<br />
11%<br />
40%<br />
11%<br />
1960–1969<br />
Latin <strong>America</strong><br />
Asia<br />
Europe<br />
Canada and other<br />
4.3<br />
41%<br />
35%<br />
20%<br />
5%<br />
1970–1979<br />
6.3<br />
42%<br />
43%<br />
11%<br />
5%<br />
1980–1989<br />
9.8<br />
51%<br />
30%<br />
13%<br />
6%<br />
1990–1999<br />
Note: The total for 1990 to 1999 includes 2.2 million immigrants who were legalized in 1987 and<br />
1988 and granted immigrant status in the early 1990s. The sum of the percentages may exceed 100<br />
because of rounding.<br />
Source: <strong>Immigration</strong> and Naturalization Service, Statistical Yearbook of the <strong>Immigration</strong><br />
and Naturalization Service, 1970 to 2001, selected years.<br />
tions on foreigners wishing to immigrate.<br />
A major policy change in 1965<br />
switched priority for entry from people<br />
with particular national origins<br />
to those with relatives in the United<br />
States and foreigners whom U.S.<br />
employers wanted to hire. The result<br />
was a shift from mostly European<br />
to mostly Latin <strong>America</strong>n and Asian<br />
immigrants.<br />
There are few limits on nonimmigrant<br />
visitors, and their numbers grew<br />
rapidly in the 1990s, as more tourists<br />
and business visitors streamed into the<br />
country and as more foreign students<br />
and foreign workers arrived. Illegal<br />
immigration also rose in the 1990s,<br />
making immigration a contentious<br />
public policy issue in the 21st century.<br />
<strong>Immigration</strong> and the integration of<br />
foreigners are much-debated issues;<br />
the debate is framed by the extreme<br />
views of those who advocate “no<br />
immigrants” and those who advocate<br />
“no borders.” The Federation for<br />
<strong>America</strong>n <strong>Immigration</strong> Reform<br />
(FAIR), for example, charges that<br />
immigrants contribute to population<br />
growth and environmental degradation,<br />
displace low-skilled <strong>America</strong>n<br />
workers, depress wages, and threaten<br />
the cultural bonds that hold <strong>America</strong>ns<br />
together. Consequently, FAIR<br />
calls for a sharp reduction in immigration—from<br />
1 million a year to perhaps<br />
300,000 a year—which FAIR<br />
feels would have the added benefit of<br />
allowing recent arrivals and <strong>America</strong>ns<br />
time to adjust to one another.<br />
At the other extreme, The Wall<br />
Street Journal, the leading U.S. newspaper<br />
for the business world, advocated<br />
a five-word constitutional amendment—“There<br />
shall be open borders”—in<br />
a 1990 editorial. After the<br />
Sept. 11 attacks, the Journal still advocated<br />
high levels of immigration,<br />
chiefly for their economic benefits:<br />
More people mean more consumers<br />
and more workers, which helps the<br />
economy grow. 2 Groups such as the<br />
Organization of Chinese <strong>America</strong>ns<br />
and the Emerald Isle <strong>Immigration</strong><br />
Center favor immigration from particular<br />
countries or regions. The<br />
Catholic Church and some other religious<br />
organizations oppose immigration<br />
controls because they believe<br />
that national borders artificially divide<br />
humanity. 3 Other groups support<br />
continued immigration because they<br />
think it is a defining part of the <strong>America</strong>n<br />
national identity.<br />
The United States is a nation of<br />
immigrants. U.S. presidents frequently<br />
remind <strong>America</strong>ns that,<br />
except for <strong>America</strong>n Indians, they or<br />
their forebears left other countries to<br />
begin anew in the United States, and<br />
that immigration permits individuals<br />
to better their lives while strengthening<br />
the United States. Yet immigration<br />
also brings many changes that<br />
raise fundamental questions for<br />
<strong>America</strong>ns. Who are we? What kind<br />
of a society have we built, and whom<br />
shall we welcome to it? What should<br />
we do to encourage the integration<br />
of newcomers? How should we deal<br />
with those who arrive uninvited?
This <strong>Population</strong> Bulletin examines<br />
current immigration patterns and<br />
policies in the United States, reviews<br />
the peaks and troughs of immigration<br />
flows, and provides a historical perspective<br />
on contemporary trends.<br />
U.S. immigration policy will continue<br />
to change in response to immigration<br />
flows and their impacts on <strong>America</strong>ns.<br />
Resolving the fundamental economic,<br />
social, and political issues raised by<br />
immigration requires weighing the<br />
choices or trade-offs between widely<br />
shared but competing goals in <strong>America</strong>n<br />
society.<br />
<strong>Immigration</strong><br />
Patterns and<br />
Policies<br />
More than 9 million foreigners were<br />
admitted as legal immigrants to the<br />
United States between 1991 and<br />
2000, an average of 900,000 a year.<br />
The volume of immigration flows<br />
has been increasing since the 1950s.<br />
The average annual inflow was about<br />
320,000 immigrants in the 1960s,<br />
430,000 in the 1970s, and 630,000<br />
in the 1980s. The origins of immigrants<br />
have also been changing. During<br />
the 1960s, 40 percent of legal<br />
immigrants were from Europe. In<br />
the 1990s, less than 13 percent of<br />
immigrants were from Europe, while<br />
51 percent were from Latin <strong>America</strong><br />
and another 30 percent were from<br />
Asia (see Figure 1).<br />
More than half of the people<br />
“admitted” as legal permanent residents,<br />
or immigrants, each year are<br />
already living in the United States<br />
under a temporary visa or some other<br />
legal status or are undocumented<br />
aliens. Changes in immigration law<br />
can skew the immigration statistics for<br />
certain years. For example, more than<br />
1.8 million people were granted<br />
immigrant status in 1991, although<br />
many had lived in the United States<br />
for years—1991 marked their change<br />
to legal immigrant status under legalization<br />
programs of 1987 and 1988.<br />
Table 1<br />
Foreigners Entering and Exiting the United States,<br />
Fiscal Year 2001<br />
Category<br />
Number of people<br />
Immigrants 1,064,318<br />
Family-sponsored 675,178<br />
Immediate relatives of U.S. citizens 443,035<br />
Other family-sponsored immigrants 232,143<br />
Employment-based 179,195<br />
Refugees and aslyees 108,506<br />
Diversity immigrants 42,015<br />
Other immigrants 59,424<br />
Emigrants (estimated) -220,000<br />
Nonimmigrants (legal admissions) 32,824,088<br />
Visitors for pleasure/business 29,419,601<br />
Foreign students 688,970<br />
Temporary foreign workers 990,708<br />
Illegal immigrants (estimated) 350,000 to 500,000<br />
Apprehensions 1,387,486<br />
Deportations -176,984<br />
Illegal immigrants living in United States,<br />
2000 estimate 7 million to 9 million<br />
Note: The fiscal year runs from Oct. 1, 2000, to Sept. 30, 2001. Foreigners may be counted more<br />
than once in the same year under nonimmigrant admissions, apprehensions, and deportations.<br />
Sources: <strong>Immigration</strong> and Naturalization Service, 2001 Statistical Yearbook of the Immmigration<br />
and Naturalization Service (2003); and J.S. Passel, “Projections of the U.S. <strong>Population</strong><br />
and Labor Force by Generation and Educational Attainment: 2000–2050” (2003).<br />
In Fiscal Year (FY) 2001, just over<br />
1 million immigrants were admitted<br />
legally “through the front door,” and<br />
more than one-half were already living<br />
in the United States when they<br />
gained immigrant status. (The fiscal<br />
year runs from Oct. 1 to Sept. 30.)<br />
There are four types of front-door<br />
immigrants. The largest category<br />
consists of relatives of U.S. residents.<br />
In FY2001, 63 percent of immigrants<br />
were granted entry because family<br />
members residing in the United<br />
States petitioned the U.S. government<br />
to admit them (see Table 1).<br />
Spouses, children, and parents of<br />
U.S. citizens may enter the United<br />
States without limit, and 443,000 did<br />
so in FY2001. But noncitizens and<br />
U.S. citizens sponsoring their brothers<br />
and sisters for immigrant visas<br />
may wait a long time for their relatives.<br />
In fall 2002, Mexican permanent<br />
residents could expect to wait<br />
seven years for their spouses and chil-<br />
7
dren to be granted immigrant visas,<br />
and U.S. citizens from the Philippines<br />
sponsoring brothers and sisters<br />
could expect to wait 21 years. 4<br />
The second-largest category comprises<br />
foreigners (and their family<br />
members) who were admitted for<br />
economic or employment reasons.<br />
Employment-based immigration<br />
includes multinational executives,<br />
workers holding professional or<br />
advanced degrees, clergy, and<br />
wealthy investors, as well as lowskilled<br />
and unskilled workers and<br />
priority workers with “extraordinary<br />
ability” in the arts or sciences. In<br />
1990, some U.S. businesses and<br />
other groups feared a shortage of<br />
skilled labor. Congress, in the <strong>Immigration</strong><br />
Act of 1990, raised the<br />
annual limit on the number of<br />
employment-preference immigrants<br />
from 54,000 to 140,000 a year; this<br />
limit may be exceeded if slots are left<br />
from a previous year. In FY2001,<br />
nearly 180,000 employment-based<br />
immigrants were admitted.<br />
There are several categories of<br />
employment-based visas, but the<br />
largest group (about 22 percent of<br />
the total) consists of foreigners with<br />
at least a bachelor’s degree and<br />
other skilled workers that U.S.<br />
employers request to fill jobs that<br />
they say cannot be filled with U.S.<br />
workers. About 85 percent of the<br />
“principals” who receive employment-based<br />
visas are already in the<br />
United States under temporary<br />
worker or other nonimmigrant status,<br />
and then adjust to resident<br />
immigrant status. 5 The process of<br />
testing the U.S. labor market for U.S.<br />
workers—labor certification—is not<br />
always closely supervised, however,<br />
and is subject to abuse. 6<br />
The third immigrant category is<br />
refugees and asylees: 10 percent of<br />
immigrants in 2001 were foreigners<br />
who were granted the right to live in<br />
8<br />
Box 1<br />
Immigrants, Refugees, Nonimmigrants, and Unauthorized Aliens<br />
The laws of the United States define all<br />
people within its borders as either U.S.<br />
citizens or aliens. Aliens may be immigrants,<br />
refugees or asylees, nonimmigrants,<br />
or unauthorized foreigners.<br />
Immigrants are citizens of other<br />
countries who have been granted visas<br />
that allow them to live and work permanently<br />
in the United States and,<br />
generally after five years, to become<br />
citizens. Immigrant visas used to be<br />
green, and immigrants are still often<br />
referred to as “green card holders.” In<br />
the past, most immigrant visas were<br />
issued to foreigners at U.S. consulates<br />
in their home countries. This changed<br />
in the 1990s, and today most immigrant<br />
visas are issued by the government<br />
inside the United States.<br />
Refugees are citizens of other countries<br />
who seek admission to the United<br />
States because they fear persecution in<br />
their home countries based on their<br />
race, religion, nationality, membership<br />
in a particular social group, or political<br />
opinion. The number admitted every<br />
year—80,000 in fiscal year (FY) 2001—<br />
is determined annually by the president<br />
in consultation with Congress, but the<br />
number approved for admission varies.<br />
Asylees arrive in the United States<br />
and then request safe haven. Like<br />
refugees, asylees request to stay out<br />
of fear of persecution in their home<br />
countries. There is no maximum<br />
number; in FY2001, 59,369 people<br />
requested asylum. There was a backlog<br />
of 304,000 asylum applications as of<br />
Sept. 30, 2002. Most asylum applications<br />
are rejected, but foreigners<br />
accepted for asylum or refugee status<br />
are allowed to live permanently in the<br />
United States.<br />
Nonimmigrants are people who<br />
are granted temporary entry into the<br />
United States for a specific purpose,<br />
such as visiting, working, or studying. In<br />
FY2001, 32.8 million nonimmigrants<br />
were admitted; 90 percent were temporary<br />
visitors for pleasure (tourists) or<br />
business. Nonimmigrants who enter and<br />
leave the United States several times are<br />
counted each time, but Canadian visitors<br />
and Mexicans with border-crossing
the United States because of a wellfounded<br />
fear of persecution in their<br />
home countries (see Box 1). About<br />
26 percent of the refugees who<br />
arrived between FY1999 and FY2001<br />
were from Ukraine and other countries<br />
of the former Soviet Union, 21<br />
percent were from Cuba, and 18 percent<br />
were from Bosnia-Herzegovina.<br />
The fourth major immigrant<br />
group is the diversity category, which<br />
was created to introduce more variety<br />
into the stream of immigrants to the<br />
United States. Nationals of countries<br />
that sent fewer than 50,000 immigrants<br />
in the previous five years, and<br />
who meet specific educational and<br />
other criteria, may apply for one of<br />
50,000 diversity visas. The applicants<br />
are chosen by lottery from between 9<br />
million and 12 million applicants<br />
annually. Many applicants are found<br />
to be unqualified: Only 42,015 diversity<br />
immigrants were admitted in<br />
2001. 7 Because many Asians and<br />
Latin <strong>America</strong>ns are admitted in<br />
other categories, most diversity visas<br />
go to people from such African<br />
and European countries as Ghana,<br />
Nigeria, Poland, and Ukraine.<br />
The diversity program addressed<br />
an unintended consequence of the<br />
1965 amendments to U.S. immigration<br />
law. Giving priority to family unification<br />
meant that, after 1965, U.S.<br />
immigration policy favored people<br />
who already had ties to U.S. residents.<br />
These laws strengthened existing networks<br />
and perpetuated this chain<br />
migration. Immigrants from countries<br />
that had not recently been sending<br />
immigrants, such as Ireland, found it<br />
difficult to establish the family and<br />
business networks needed to set chain<br />
migration in motion. During the first<br />
three years of the program, 40 percent<br />
of diversity visas were reserved<br />
for Irish immigrants. The “other<br />
immigrants” category also includes<br />
Cubans and Central <strong>America</strong>ns<br />
After 1965, U.S.<br />
immigration<br />
policy favored<br />
people with<br />
close relatives<br />
in the United<br />
States.<br />
cards that allow shopping visits are not<br />
included in these admissions data.<br />
The United States has 25 types of<br />
nonimmigrant visas. These include A-1<br />
visas for ambassadors, B-2 visas for<br />
tourists, J visas for students, P-1 visas<br />
for foreign sports stars who play on<br />
U.S. teams, and TN visas for Canadians<br />
and Mexicans entering the United<br />
States to work under the North <strong>America</strong>n<br />
Free Trade Agreement (NAFTA).<br />
Some foreigners are able to visit the<br />
United States without a visa. The Visa<br />
Waiver Pilot Program permits visitors<br />
from 27 countries, mostly in Europe,<br />
to enter without visas if they have<br />
round-trip tickets.<br />
Unauthorized, undocumented, or<br />
illegal immigrants are foreigners in the<br />
United States without valid visas. There<br />
were between 7 million and 9 million<br />
unauthorized foreigners in the United<br />
States in 2000, according to recent estimates.<br />
The <strong>Immigration</strong> and Naturalization<br />
Service (INS) estimated there<br />
were about 3.5 million unauthorized<br />
foreigners in 1990, suggesting the<br />
number at least doubled over the<br />
decade. About 70 percent of the unauthorized<br />
foreigners were Mexicans.<br />
An additional 600,000 to 1.7 million<br />
foreigners were quasi-legal residents in<br />
2000. Many of the quasi-legal foreigners<br />
are asylum-seekers waiting their<br />
aslyum status to be determined; others<br />
hold temporary protected status while<br />
they wait for legal documentation or a<br />
hearing.<br />
<strong>Reference</strong>s<br />
<strong>Immigration</strong> and Naturalization Service<br />
(INS), “Executive Summary: Estimates of<br />
the Unauthorized Immigrant <strong>Population</strong><br />
Residing in the United States 1990–2000”<br />
(January 2003), accessed online at<br />
www.immigration.gov/graphics/shared/<br />
aboutus/statistics/2000ExecSumm.pdf, on<br />
April 23, 2003; INS, 2001 Statistical Yearbook<br />
of the <strong>Immigration</strong> and Naturalization Service<br />
(Washington, DC: INS, 2003); and Jeffrey S.<br />
Passel, “Projections of the U.S. <strong>Population</strong><br />
and Labor Force by Generation and Educational<br />
Attainment: 2000-2050” (Washington,<br />
DC: The Urban Institute, 2003).<br />
9
10<br />
already in the United States who can<br />
petition for immigrant visas if they<br />
can demonstrate that they would suffer<br />
extreme hardship if they were<br />
sent back home.<br />
Once they reach the United States,<br />
immigrants normally stay. The U.S.<br />
<strong>Immigration</strong> and Naturalization Service<br />
(INS) estimated that between 1901<br />
and 1990, the number of people<br />
emigrating from the United States<br />
was equivalent to about 31 percent<br />
of the number immigrating. Emigration<br />
peaked during the Great Depression<br />
of the 1930s, when more people<br />
moved out of the United States than<br />
moved in. Emigration during the<br />
1980s was estimated to be 1.6 million,<br />
equivalent to about 22 percent of<br />
immigration. 8 The U.S. Census <strong>Bureau</strong><br />
estimates that 220,000 foreign-born<br />
residents emigrate each year.<br />
Nonimmigrants are people who<br />
come to the United States to visit,<br />
work, or study. The United States<br />
is eager to attract most types of nonimmigrants—airlines<br />
and hotels advertise<br />
for foreign tourists, for example—<br />
so there are few quantitative limits<br />
on most categories of nonimmigrants.<br />
The number of nonimmigrants tripled<br />
in the past 20 years, primarily<br />
because of the growing number of<br />
tourists and business visitors.<br />
Foreigners also arrive to work temporarily<br />
in the United States, and<br />
their presence is more controversial.<br />
The statistics are somewhat confusing:<br />
A foreign worker who enters<br />
more than once during a year is double-counted<br />
because the statistics<br />
record admissions rather than people.<br />
There were almost 1 million<br />
admissions of temporary foreign<br />
workers in FY2001; 40 percent were<br />
professionals coming to the United<br />
States with H-1B visas to fill jobs that<br />
require at least a bachelor’s degree.<br />
Workers with H-1B visas are allowed<br />
to bring their families with them and<br />
to adjust to immigrant status if they<br />
can find a U.S. employer to sponsor<br />
them during the six years they can<br />
remain in the United States. In<br />
FY2001, nearly half of the H-1B workers<br />
were from India, and most were<br />
employed in computer-related jobs.<br />
During the dot-com boom of the<br />
1990s, the annual limit of 65,000<br />
H-1B visas was reached well before<br />
the end of each year, and computer<br />
firms twice persuaded Congress to<br />
raise the annual limit to 195,000. 9<br />
The expanding H-1B program led<br />
to debates over U.S. employer preferences,<br />
foreign workers, and U.S. education.<br />
Those in favor of expanding<br />
H-1B admissions argued that U.S.<br />
employers needed easy access to the<br />
“best and brightest” of the world’s<br />
workers and that the U.S. government<br />
should not erect barriers<br />
between U.S. employers and the foreign<br />
workers they need. Employers<br />
argued that foreign students dominate<br />
graduate school programs in<br />
math, science, and engineering and<br />
that it should be expected that U.S.<br />
employers would want to hire the<br />
best graduates of U.S. universities.<br />
Critics countered that there is no<br />
shortage of U.S. workers interested<br />
in computer science and similar jobs,<br />
only a shortage of U.S. workers willing<br />
to work long hours for low wages and<br />
short careers in fast-changing industries.<br />
The critics point out that most<br />
students graduating from U.S. universities<br />
with bachelor’s degrees in<br />
science and math are U.S. citizens,<br />
but most do not pursue advanced<br />
degrees because the extra earnings<br />
and opportunities seem insufficient<br />
to warrant the time, effort, and expense<br />
of graduate school. Critics of<br />
the H-1B program emphasize that<br />
high-tech firms interview and hire<br />
fewer than 2 percent of job applicants,<br />
suggesting no shortage of potential<br />
employees. A 1996 report on the H-1B<br />
program by the U.S. Department of<br />
Labor’s inspector general concluded<br />
that the program should be abolished<br />
because most U.S. employers use it as<br />
a “probationary employment tryout<br />
program for illegal aliens, foreign students,<br />
and foreign visitors,” so that the<br />
program winds up legalizing foreigners<br />
whom the sponsoring employer<br />
has already hired. 10<br />
Foreign students make up another<br />
important category of nonimmi-
grants. Some 688,790 foreigners with<br />
student visas entered the United<br />
States in FY2001; some were counted<br />
more than once as they traveled<br />
abroad and back.<br />
The Institute of International Education<br />
(IIE) reported that a record<br />
582,996 foreign students were enrolled<br />
in U.S. colleges and universities during<br />
the 2001-2002 academic year. The<br />
largest number were from India,<br />
which sent 66,836 students, followed<br />
by China with 63,211. Korea, Japan,<br />
Taiwan, and Canada were also leading<br />
sources of international students. Foreign<br />
students account for a larger<br />
share of the student body at costly private<br />
universities than at less expensive<br />
public ones. Most students pay their<br />
own expenses. The IIE reports that<br />
foreign students contribute about $12<br />
billion annually to the U.S. economy. 11<br />
Foreign students made up 23 percent<br />
of the students at Columbia University<br />
in 2001; 20 percent of students<br />
at the University of Southern California;<br />
and 15 percent of students at New<br />
York University. More than 16,000 foreign<br />
students were enrolled in these<br />
three private universities in 2001.<br />
Foreign students became more<br />
controversial after the Sept. 11, 2001,<br />
terrorist attacks: One of the alleged<br />
hijackers had entered the United<br />
States with a student visa to study<br />
English at a language school but<br />
never showed up for classes; two others<br />
attended a Florida flight training<br />
school. In an effort to track foreign<br />
students, the federal government<br />
launched the Student Exchange and<br />
Visitor Information System (SEVIS)<br />
in 2002. Colleges must report data on<br />
foreign students so that the government<br />
is aware of foreigners who were<br />
admitted to the United States as students<br />
but did not enroll in classes.<br />
Foreigners in the United States<br />
legally are immigrants or nonimmigrants.<br />
Unauthorized foreigners, also<br />
referred to as illegal aliens, deportable<br />
aliens, or undocumented workers, are<br />
persons in the United States in violation<br />
of U.S. immigration laws. An<br />
estimated 350,000 to 500,000 illegal<br />
aliens settle in the United States each<br />
Photo removed for copyright reasons.<br />
The H-1B visa program has brought in thousands of foreigners for temporary<br />
jobs in high-tech industries; many of those workers find permanent<br />
employment and settle in the United States with their families.<br />
year; many more stay for a while and<br />
leave within the same year. The INS<br />
apprehended 1.4 million in FY2001,<br />
95 percent of whom were Mexicans<br />
caught just inside the U.S. border.<br />
The same person may be caught several<br />
times, and each apprehension is<br />
counted separately.<br />
In the mid-1990s, the INS shifted<br />
the focus of its border enforcement<br />
strategy from attempting to apprehend<br />
unauthorized aliens living in<br />
the United States to deterring their<br />
entry “through the back door” by<br />
adding agents, fences, lights, and<br />
cameras in the urban areas where<br />
most illegal entry attempts are made.<br />
In such areas as San Diego–Tijuana<br />
and El Paso–Juarez, apprehensions<br />
have fallen sharply. However, many<br />
migrants have turned to smugglers to<br />
help them enter illegally through the<br />
deserts and mountains of Arizona.<br />
The smugglers, known as polleros or<br />
coyotes, typically lead groups of 20 to<br />
40 migrants across the border. They<br />
sometimes abandon those who cannot<br />
keep up or fail to provide water or<br />
make transportation arrangements<br />
for the migrants once they are in the<br />
United States. For the past several<br />
years, an average of one migrant a day<br />
has died attempting illegal entry. 12<br />
11
Terrorism<br />
and a weak<br />
economy<br />
have made<br />
<strong>America</strong>ns more<br />
restrictionist in<br />
the early 21st<br />
century.<br />
12<br />
Many foreigners enter the United<br />
States as tourists or students and then<br />
remain, or they may enter clandestinely<br />
and stay as unauthorized foreigners.<br />
Some of the unauthorized<br />
foreigners in the United States are<br />
waiting for immigrant visas. In October<br />
2002, 1 million applications were<br />
pending for foreigners in the United<br />
States seeking to adjust their status to<br />
that of immigrant. A foreigner who<br />
is found to have been in the United<br />
States unlawfully for more than a year<br />
may be barred from legal re-entry for<br />
10 years. Thus, unauthorized foreigners<br />
waiting for immigrant visas walk a<br />
tightrope, hoping to the receive immigrant<br />
visas before they are detected,<br />
removed, and barred from legal reentry<br />
for 10 years.<br />
If unauthorized foreigners are<br />
apprehended inside the United States,<br />
the government attempts to remove<br />
them voluntarily or to deport them<br />
to their countries of origin. In 2001,<br />
some 176,984 foreigners were deported<br />
or “removed” formally from<br />
the United States; 80 percent of them<br />
were from Mexico. Mexicans apprehended<br />
inside the United States who<br />
choose to be returned “voluntarily”<br />
to Mexico are fingerprinted, photographed,<br />
and taken across the<br />
border, but usually they will not be<br />
prosecuted if they are apprehended<br />
again in the United States. An unauthorized<br />
foreigner who is removed<br />
or deported, however, must appear<br />
before an immigration judge who<br />
decides the foreigner’s fate after listening<br />
to the immigration service argue<br />
why the foreigner should be deported<br />
and the foreigner argue why he or<br />
she should be allowed to remain. Deported<br />
foreigners can be prosecuted<br />
if they re-enter the United States.<br />
Public Opinion<br />
Many <strong>America</strong>ns worry that immigration<br />
is increasing the size and changing<br />
the characteristics of the population.<br />
Public opinion surveys conducted<br />
between 1965 and 1993 consistently<br />
showed that a majority of <strong>America</strong>ns<br />
wanted both legal and illegal immigration<br />
reduced, and fewer than 10 percent<br />
of those surveyed favored<br />
increased immigration. 13<br />
But public opinion often changes<br />
with economic circumstances. During<br />
the late 1990s, when the economy<br />
expanded and unemployment rates<br />
were low, public opinion became<br />
more tolerant toward immigration.<br />
A 1997 poll, for example, found that<br />
fewer than 50 percent of <strong>America</strong>ns<br />
wanted immigration reduced or<br />
stopped, but 63 percent were concerned<br />
about immigrants taking jobs<br />
from <strong>America</strong>ns or causing racial<br />
conflict, and 79 percent were concerned<br />
that immigrants were overburdening<br />
the welfare system and<br />
pushing up taxes. 14<br />
A January 1999 poll conducted by<br />
the Public Policy Institute of California<br />
found that opinion shifted as the<br />
economy boomed: 52 percent of Californians<br />
considered Mexican immigrants<br />
a benefit to the state because of<br />
their hard work and job skills, while<br />
only 36 percent described them as a<br />
burden because of their use of public<br />
services and schools. 15<br />
Terrorism and a weakening economy<br />
made <strong>America</strong>ns more restrictionist<br />
at the start of the 21st century.<br />
A Fox News opinion poll in November<br />
2001 found that 65 percent of<br />
<strong>America</strong>ns favored stopping all immigration<br />
during the war on terror, and<br />
a January 2002 Gallup poll reported<br />
that 58 percent of <strong>America</strong>ns thought<br />
immigration levels should be<br />
decreased, up from 45 percent in January<br />
2001. 16 A Los Angeles Times article,<br />
however, pointed out that “the<br />
most significant development in the<br />
national immigration debate is what<br />
hasn’t happened [since Sept. 11]: No<br />
lawmaker of influence has moved to<br />
reverse the country’s generous immigration<br />
policy, which for more than<br />
three decades has facilitated the<br />
largest sustained wave of immigration<br />
in U.S. history.” 17 Most <strong>America</strong>ns<br />
seemed to agree with INS Commissioner<br />
James W. Ziglar, who said repeatedly:<br />
“These [hijackers] weren’t<br />
immigrants. They were terrorists.”
There is often a difference between<br />
elite and mass opinion: Support for<br />
immigration rises with income and<br />
education. In a 2002 poll, 55 percent<br />
of the public said legal immigration<br />
should be reduced, compared with 18<br />
percent of opinion leaders. 18 Many<br />
politicians and researchers dismiss<br />
public concerns about immigration<br />
by pointing out that, throughout U.S.<br />
history, fears that the United States<br />
was accepting too many and the<br />
wrong kinds of immigrants proved<br />
unfounded. Benjamin Franklin, for<br />
example, worried that German immigrants<br />
arriving in the late 1700s could<br />
not be assimilated. Why, he asked,<br />
should “Pennsylvania, founded by the<br />
English, become a colony of aliens,<br />
who will shortly be so numerous as to<br />
Germanize us, instead of our Anglifying<br />
them?” 19 Less than two centuries<br />
later, a descendent of those immigrants,<br />
Dwight Eisenhower, was elected<br />
president of the United States. At the<br />
end of the 20th century, some immigrants<br />
who adopted U.S. citizenship<br />
have been entrusted with high-level<br />
public office, including former U.S.<br />
Secretary of State Madeleine Albright<br />
(born in Prague) and former Chairman<br />
of the Joint Chiefs of Staff General<br />
John M. Shalikashvili (born in<br />
Warsaw).<br />
<strong>America</strong> continues to celebrate<br />
its immigrant heritage with mass<br />
naturalization ceremonies on July 4,<br />
ceremonies designed to associate<br />
immigration with the founding of<br />
the United States. Politicians remind<br />
<strong>America</strong>ns that they share an immigrant<br />
legacy. In light of this revered<br />
immigrant heritage, those who want<br />
to restrict immigration may be considered<br />
un-<strong>America</strong>n. They often<br />
justify their position with the following<br />
arguments:<br />
■ <strong>Immigration</strong> adds to U.S. population<br />
growth and, therefore, to environmental<br />
problems related to<br />
population growth.<br />
■ Immigrants depress wages and<br />
working conditions in the labor<br />
markets where immigrants are concentrated,<br />
and they compete with<br />
native-born residents for some jobs.<br />
■<br />
■<br />
Immigrant workers are willing to<br />
work at low wages, which discourages<br />
businesses from modernizing<br />
and impedes U.S. competitiveness<br />
in the world economy.<br />
The large numbers of Hispanic and<br />
Asian immigrants are changing the<br />
ethnic composition of the U.S.<br />
population and raising difficult<br />
questions for <strong>America</strong>ns. Should<br />
public schools support retention<br />
of immigrants’ language and culture?<br />
Should minority immigrants<br />
be given preference in university<br />
admissions, job opportunities, and<br />
business contracts?<br />
These concerns demonstrate the<br />
link between attitudes toward immigration<br />
and questions about the<br />
social and economic integration of<br />
immigrants. The fortunes of immigrants,<br />
and their effect on the economy,<br />
the political system, schools,<br />
and society affect attitudes toward<br />
additional immigration.<br />
Four Waves of<br />
<strong>Immigration</strong><br />
After the Europeans arrived in the<br />
New World, three processes—colonization,<br />
coercion, and immigration—<br />
superimposed a new population on<br />
the native people of North <strong>America</strong>.<br />
In the 17th and 18th centuries, English<br />
colonists established the framework<br />
of the society that became the<br />
United States. They built communities<br />
at Jamestown and Plymouth, seized<br />
control from the Dutch in New York,<br />
and overran various French and Spanish<br />
settlements. These colonists established<br />
English as the public language<br />
and England’s common law as the<br />
model for the U.S. legal system.<br />
Two types of coercion also contributed<br />
to the peopling of <strong>America</strong>:<br />
the importation of African slaves (who<br />
made up 19 percent of the U.S. population<br />
in 1790), and the incorporation<br />
of <strong>America</strong>n Indian, Spanish, French,<br />
Mexican, and other populations<br />
through political deals, war settlements,<br />
or purchase of territory as the<br />
13
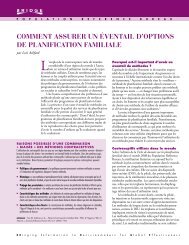
Figure 2<br />
<strong>Immigration</strong> to the United States, 1820 to 2001<br />
<strong>Immigration</strong><br />
phase:<br />
Frontier<br />
expansion Industrialization <strong>Immigration</strong> pause Post-1965<br />
immigration<br />
1,800<br />
Major sending<br />
regions:<br />
Northern<br />
and<br />
Western<br />
Europe<br />
Southern and<br />
Eastern Europe<br />
Western Europe<br />
Asia and<br />
Latin<br />
<strong>America</strong><br />
1,600<br />
1,400<br />
1,200<br />
IRCA<br />
legalization<br />
1,000<br />
800<br />
600<br />
400<br />
Immigrants<br />
(thousands)<br />
200<br />
Immigrants<br />
(thousands)<br />
0<br />
1820 1840 1860 1880 1900 1920 1940 1960 1980 2001<br />
Note: IRCA refers to the amnesty provisions of the <strong>Immigration</strong> Reform and Control Act of 1986, under which<br />
2.7 million unauthorized foreign residents obtained legal immigrant status.<br />
Sources: <strong>Immigration</strong> and Naturalization Service, 2001 Statistical Yearbook of the <strong>Immigration</strong> and Naturalization<br />
Service (2003): table 1.<br />
14<br />
United States expanded westward.<br />
The Louisiana Purchase of 1803<br />
made <strong>America</strong>ns out of the French<br />
residents living in that territory. Mexicans<br />
in California, New Mexico, and<br />
Texas became <strong>America</strong>ns in 1848, as<br />
a result of the Mexican War. In 1898,<br />
the United States acquired Puerto<br />
Rico in the settlement of the Spanish-<br />
<strong>America</strong>n War; Puerto Ricans became<br />
U.S. citizens in 1917.<br />
The third and largest source of<br />
<strong>America</strong>ns was immigration. In 1789,<br />
after the former British colonies<br />
had become one country, the word<br />
“immigrant” entered the language<br />
to denote a person who voluntarily<br />
moves from his or her own country<br />
to another established nation. Immigrants<br />
and their descendants, along<br />
with the colonials, the slaves, the<br />
<strong>America</strong>n Indians, and their descendants,<br />
are the <strong>America</strong>n people of<br />
today.<br />
The flow of immigrants has fluctuated<br />
with economic conditions in the<br />
United States and abroad and with<br />
U.S. immigration policies. For these<br />
reasons, the tally of annual arrivals<br />
has peaks and troughs. The four<br />
major peaks are referred to as the<br />
four major waves of immigration.<br />
First Wave: Before 1820<br />
The first wave of immigrants arrived<br />
before entries began to be recorded in<br />
1820. The English made up 60 percent<br />
of the population in 1790, but there<br />
were also Scots, Scots-Irish, Germans,<br />
and people from the Netherlands,<br />
France, and Spain. These migrants<br />
were motivated by a mixture of religious,<br />
political, and economic factors.<br />
German sectarians sought religious<br />
freedom in Pennsylvania; Spaniards<br />
looked for Christian converts in<br />
Florida and the southwest; and the<br />
Puritans in Massachusetts sought to<br />
establish a community restricted to<br />
members of their faith. Religious freedom<br />
was made possible by political<br />
and economic freedom: the absence
of coercion by overlords and the<br />
chance to prosper in a new land.<br />
These early immigrants took big<br />
risks. Starvation, disease, and shipwreck<br />
probably killed more than one<br />
in 10 of those who set sail for <strong>America</strong>.<br />
While African slaves were transported<br />
to <strong>America</strong> under horrific conditions<br />
and considerable loss of life, historians<br />
estimate that immigrants died at an<br />
even higher rate than slaves en route<br />
to the New World. Slaves often had<br />
more food and protection than ordinary<br />
passengers because the death of a<br />
slave was a business loss for the owners<br />
who had arranged their passage. 20 The<br />
cost of travel was equivalent to four to<br />
six months of a laborer’s wages in England,<br />
and many potential immigrants<br />
indentured themselves to employers in<br />
the United States who would pay for<br />
their passage. Indentured workers<br />
were legally bound to work for as long<br />
as five years for the employer who paid<br />
their passage. One-third of immigrants<br />
arriving in 1776 had become indentured<br />
to secure passage.<br />
Second Wave: 1820 to 1860<br />
The second wave of immigrants, who<br />
arrived between 1820 and 1860, fit well<br />
with <strong>America</strong>ns’ eagerness for people<br />
to help push back the frontier. Peasants<br />
displaced from agriculture and<br />
artisans made jobless by the Industrial<br />
Revolution were desperate to escape<br />
from Europe. New arrivals sent what<br />
came to be called “<strong>America</strong>n letters”<br />
back to Europe, encouraging friends<br />
and relatives to join them. Steamship<br />
and railroad companies sent agents<br />
around Europe recruiting customers.<br />
Between 1820 and 1840, more than<br />
750,000 German, British, and Irish<br />
immigrants arrived; another 4.3 million<br />
came from those countries during<br />
the next 20 years (see Figure 2). About<br />
40 percent of these second-wave immigrants<br />
were Irish escaping extreme<br />
poverty and famine in their home<br />
country. Roman Catholics predominated<br />
in the second wave, and by 1850<br />
the Roman Catholic Church was the<br />
largest denomination in the United<br />
States, though Protestants of various<br />
denominations outnumbered Catholics.<br />
Third Wave: 1880 to 1914<br />
The third wave of immigration started<br />
in 1880, when almost 460,000 immigrants<br />
arrived, and ended with the outbreak<br />
of war in Europe in 1914, when<br />
1.2 million immigrants entered. During<br />
the third wave, over 20 million<br />
southern and eastern Europeans came,<br />
mostly to the eastern and midwestern<br />
states. Several hundred thousand Chinese,<br />
Japanese, and other Asian laborers<br />
settled in the western states.<br />
The shift in national origins can<br />
be seen by comparing the homelands<br />
of the immigrants who entered during<br />
1882 and 1907, two peak immigration<br />
years. Of those arriving in<br />
1882, 87 percent came from northern<br />
and Western Europe, and 13 percent<br />
came from southern and eastern<br />
Europe. Only 19 percent of immigrants<br />
arriving in 1907 were from<br />
northern and Western Europe, while<br />
81 percent were from southern and<br />
eastern Europe. The immigrants who<br />
arrived in 1907 also included the first<br />
large numbers of people of Jewish<br />
and Eastern Orthodox religions.<br />
By the early 1900s, the frontier was<br />
closed, and most newcomers found<br />
factory jobs in eastern and midwestern<br />
cities. More than 1 million immigrants<br />
arrived annually in six of the first 14<br />
years of the 20th century. By 1910, foreign-born<br />
residents accounted for<br />
nearly 15 percent of the U.S. population<br />
and about 24 percent of the U.S.<br />
labor force; immigrants made up<br />
more than half of all operatives in<br />
mining, steel, and meatpacking. Foreign-born<br />
men made up more than<br />
half of the work force in New York,<br />
Chicago, and Detroit. 21<br />
<strong>Immigration</strong> Pause: 1915 to<br />
1964<br />
<strong>Immigration</strong> ceased as World War I<br />
erupted in Europe. When immigrants<br />
began to arrive again after the war, in<br />
the 1920s, their entry was curtailed by<br />
the introduction of numerical limits,<br />
or “quotas.” Then the severe economic<br />
depression of the 1930s discouraged<br />
foreigners moving to the<br />
United States. As Adolf Hitler’s Nazi<br />
regime displaced and threatened Jews<br />
15
16<br />
Photo removed for copyright reasons.<br />
While immigration from Europe has waned,<br />
the 1990s saw a surge of refugees from Russia<br />
and other former Soviet republics.<br />
and political opponents in Europe<br />
and precipitated another world war,<br />
many called on Franklin D. Roosevelt’s<br />
administration to give more<br />
generous treatment to those fleeing<br />
Nazi-controlled areas. But the United<br />
States did not admit large numbers<br />
of refugees until after World War II.<br />
Including the refugee flows, an average<br />
of 250,000 immigrants entered<br />
each year through the 1950s.<br />
During the 1940s and 1950s, immigration<br />
from Mexico and other Western<br />
Hemisphere nations became<br />
increasingly important. In the 1940s,<br />
about one-third of the 1 million immigrants<br />
whose arrivals were recorded<br />
were from the Western Hemisphere.<br />
The Western Hemisphere share<br />
climbed to 40 percent in the 1950s.<br />
Legal immigrant admissions did not<br />
reflect the volume of Western Hemisphere<br />
immigration, because many<br />
migrants were unauthorized. Between<br />
1940 and 1960, for example, 360,000<br />
legal Mexican immigrants were admitted<br />
but, in 1954 alone, more than 1<br />
million Mexicans were apprehended<br />
and sent back as illegal entrants. Because<br />
relatively few of the unauthorized<br />
Mexicans became permanent<br />
settlers, the Mexican-origin population<br />
rose slowly.<br />
Fourth Wave: 1965 to Present<br />
Fourth-wave immigrants began arriving<br />
in the United States after 1965,<br />
when the preference system changed.<br />
Instead of giving priority to immigrants<br />
based on their national origins,<br />
with preference to those from<br />
northern and Western Europe, the<br />
new system gave priority to people<br />
with U.S. relatives and to a small<br />
number of people with outstanding<br />
accomplishments or special skills.<br />
These changes, coupled with prosperity<br />
in Europe, altered the composition<br />
of U.S. immigrants. During the<br />
1970s, the first decade the law was in<br />
effect, fewer than 20 percent of U.S.<br />
immigrants were Europeans.<br />
There are many similarities<br />
between immigration at the beginning<br />
of the 20th century and at the<br />
start of the 21st. The number of<br />
immigrants arriving annually during<br />
the peak years—more than 1 million—is<br />
about the same, although the<br />
foreign-born accounted for more of<br />
the U.S. population in 1900 (15 percent)<br />
than in 2000 (11 percent). During<br />
both periods, the economy was<br />
undergoing fundamental restructuring,<br />
from agriculture to industry in<br />
the early years of the 20th century<br />
and from services to information at<br />
start of the 21st century. Both waves<br />
brought people from countries that<br />
had not previously sent large numbers<br />
of immigrants, raising questions<br />
about language, religion, and culture.<br />
U.S. <strong>Immigration</strong><br />
Policies<br />
<strong>Immigration</strong> policies aim to determine<br />
how many, from where, and<br />
under what status immigrants arrive.<br />
These policies have gone through<br />
three major phases: laissez-faire,<br />
qualitative restrictions, and quantitative<br />
restrictions.
Laissez-Faire, 1780 to<br />
1875<br />
During its first hundred years, the<br />
United States had a laissez-faire policy<br />
toward immigration. Federal, state,<br />
and local governments; private employers;<br />
shipping companies and railroads;<br />
and churches were free to<br />
promote immigration to the United<br />
States. Some federal government<br />
policies indirectly encouraged immigration.<br />
Subsidizing railroad construction,<br />
for example, led to the<br />
recruitment of immigrant workers by<br />
private railroad companies. High tariffs<br />
kept out European goods and thus<br />
created a demand for more workers in<br />
<strong>America</strong>n factories. The federal government<br />
relied on immigrants to staff<br />
the army: Immigrants made up about<br />
one-third of the regular soldiers in the<br />
1840s, and an even higher proportion<br />
of many state militias. 22<br />
This need for labor, combined<br />
with the freedoms established in the<br />
United States, made the new nation a<br />
good place for newcomers. Fears that<br />
immigrants would alter the culture<br />
and customs of the United States<br />
were outweighed by the combination<br />
of people pushing out from an overcrowded<br />
Europe and the waiting<br />
opportunities of the New World.<br />
The Naturalization Act of 1790<br />
established the principle that an<br />
immigrant could acquire citizenship<br />
after several years of residence in the<br />
United States. No fees or admissions<br />
tests were imposed on immigrants<br />
but, after 1819, the federal government<br />
required ship captains to collect<br />
and report data on the immigrants<br />
they brought to the United States.<br />
The big influx of Roman Catholics<br />
from Ireland and Germany in the<br />
1840s set off the “Know Nothing”<br />
movement—the first organized antiforeign<br />
movement in the nation’s history,<br />
embodied in the <strong>America</strong>n Party.<br />
Groups of Protestant clergymen, journalists,<br />
and other opinion leaders<br />
formed the Order of the Star Spangled<br />
Banner within the party to urge<br />
reduced immigration from non-Anglo-<br />
Saxon countries. To maintain secrecy,<br />
members were instructed to answer<br />
any inquiries about the Order with<br />
the words “I know nothing about it.”<br />
The <strong>America</strong>n Party won 70 congressional<br />
seats in the federal election of<br />
1854, but the majority of congressmen<br />
did not respond to the flurry of antiimmigrant<br />
feeling and no restrictions<br />
were imposed. <strong>Immigration</strong> slowed<br />
before the Civil War and slavery<br />
replaced immigration as the major<br />
political issue of the day.<br />
Qualitative Restrictions,<br />
1875 to 1920<br />
After the Civil War, public attention<br />
turned again to immigration. The<br />
growing numbers of immigrants from<br />
eastern and southern Europe aroused<br />
concerns and fears among the overwhelmingly<br />
Protestant and rural<br />
<strong>America</strong>n populace. Writing in 1901,<br />
Woodrow Wilson, who was later<br />
elected president, shared the popular<br />
antagonism to the immigrants:<br />
“Immigrants poured in as before,<br />
but ... now there came multitudes of<br />
men of the lowest class from the south<br />
of Italy and men of the meanest sort<br />
out of Hungary and Poland, men out<br />
of the ranks where there was neither<br />
skill nor energy nor any initiative of<br />
quick intelligence; and they came in<br />
numbers which increased from year to<br />
year, as if the countries of the south of<br />
Europe were disburdening themselves<br />
of the more sordid and hapless elements<br />
of their population.” 23<br />
The fear of foreigners led to the<br />
imposition of qualitative restrictions<br />
aimed at barring certain types of<br />
immigrants. In 1875, convicts and<br />
prostitutes were barred. The <strong>Immigration</strong><br />
Act of 1882 added paupers and<br />
“mental defectives” to those who<br />
could not immigrate to the United<br />
States. And for the first time, it barred<br />
immigration from a particular country—China.<br />
The 1882 act barred Chinese<br />
immigration for 10 years, and<br />
the ban was renewed every decade<br />
until 1943.<br />
Beginning in 1897, Congress<br />
approved legislation stipulating that<br />
only people who could read and<br />
write would be admitted as immi-<br />
17
18<br />
<strong>Immigration</strong><br />
laws of the<br />
1920s favored<br />
immigrants<br />
from northern<br />
and Western<br />
Europe.<br />
grants. The aim was to reduce the<br />
number of immigrants, particularly<br />
peasants from southern and eastern<br />
Europe, where literacy was low.<br />
Three presidents vetoed such literacy<br />
tests. President Wilson’s third veto<br />
was overridden in 1917, and a law<br />
was passed requiring that future<br />
immigrants over age 16 know how to<br />
read in at least one language. The literacy<br />
test did not succeed in reducing<br />
immigration from eastern and<br />
southern Europe. In 1907, the U.S.<br />
House of Representatives commissioned<br />
a study that laid the foundation<br />
for using national origin as the<br />
chief criterion for selecting immigrants.<br />
The study concluded that<br />
immigrants from southern and eastern<br />
Europe had more “inborn<br />
socially inadequate qualities than<br />
northwestern Europeans.” 24<br />
Quantitative Restrictions<br />
Since 1921<br />
In 1921, Congress imposed restrictions<br />
on the number of immigrants<br />
allowed into the United States each<br />
year. In 1924, it set an annual limit<br />
of 150,000 immigrants, plus accompanying<br />
wives and children. The immigration<br />
legislation of the 1920s also<br />
established a quota system—using the<br />
national origins formula—that aimed<br />
to ensure the predominance of northern<br />
and Western Europeans in the<br />
U.S. ethnic makeup. The <strong>Immigration</strong><br />
Act of May 26, 1924, prescribed<br />
that, beginning in 1927, the maximum<br />
number of immigrants from any<br />
country would be “a number which<br />
bears the same ratio to 150,000 as the<br />
number of inhabitants in the United<br />
States in 1920 having that national<br />
origin bears to the number of white<br />
inhabitants of the United States.” 25<br />
Each country was guaranteed at least<br />
100 visas; 154,477 visas were available<br />
annually.<br />
The national-origins formula gave<br />
preference to immigrants from northern<br />
and Western Europe. During the<br />
1930s, 1940s, and 1950s, more than<br />
80 percent of all immigrant visas went<br />
to people from northern and Western<br />
European countries, 14 percent to<br />
eastern and southern Europeans, and<br />
4 percent to people from other Eastern<br />
Hemisphere countries. The limits<br />
specified in the 1924 act did not apply<br />
to immigration from Western Hemisphere<br />
countries such as Mexico. The<br />
rise of political and racial persecution<br />
in fascist Europe in the 1930s brought<br />
no change in <strong>America</strong>n immigration<br />
law. There was no special provision for<br />
refugees; all immigrant visa applicants<br />
were required to have a sponsor. Only<br />
about 250,000 of the Europeans<br />
attempting to escape persecution by<br />
the Nazis were admitted. 26 After the<br />
war, Congress passed the Displaced<br />
Persons Act of 1948, which allowed in<br />
more than 400,000 Europeans. Later,<br />
the Refugee Relief Act of 1953 permitted<br />
the admission of another 190,000.<br />
Also after World War II, President<br />
Harry S. Truman and some congressional<br />
reformers sought—unsuccessfully—to<br />
abolish the discriminatory<br />
national origins system. Congress<br />
passed the McCarran-Walter <strong>Immigration</strong><br />
and Nationality Act (INA) of<br />
1952 over Truman’s veto and left the<br />
quota system intact. In the early<br />
1960s, President John F. Kennedy<br />
also proposed eliminating preferences<br />
for immigrants from specific<br />
regions or countries and giving priority<br />
to close relatives of U.S. citizens<br />
and foreigners with special skills and<br />
abilities that would benefit the<br />
United States. Kennedy did not live<br />
to see his bill considered, but by 1965<br />
the momentum of the civil rights<br />
movement provided enough force to<br />
eliminate racial and ethnic discrimination<br />
in <strong>America</strong>n immigration law.<br />
Under the 1965 amendments to the<br />
INA, about 80 percent of the immigration<br />
slots were given to immigrants<br />
joining family members or<br />
relatives in the United States. No<br />
limit was placed on the number of<br />
immediate relatives who could move<br />
to the United States if their U.S. relatives<br />
were citizens. For the first time,<br />
Asians were treated like other immigrants<br />
and, also for the first time,<br />
limits were placed on immigration<br />
from the Western Hemisphere.
<strong>Immigration</strong> Reforms,<br />
1980 to 2002<br />
Until the 1980s, U.S. immigration law<br />
could be described as a complex system<br />
that changed once each generation.<br />
The accelerating pace of global<br />
change has affected migration patterns,<br />
however, and Congress responded with<br />
three major changes in immigration<br />
laws between 1980 and 1990, three<br />
more in 1996, and, since 2001, antiterrorism<br />
laws that affect immigration.<br />
The first change during the 1980s<br />
was the definition of refugees. From<br />
the 1950s until 1980, the United<br />
States defined refugees as persons<br />
fleeing communist dictatorships or<br />
political violence in the Middle East,<br />
and the U.S. government offered<br />
those who escaped the chance to settle<br />
in the United States. The United<br />
Nations, in the 1951 Refugee Convention,<br />
had defined a refugee differently,<br />
as a person living outside his or<br />
her country of citizenship who was<br />
unable or unwilling to return because<br />
of a well-founded fear of persecution<br />
because of race, religion, nationality,<br />
membership in a particular social<br />
group, or political opinion. 27 With the<br />
Refugee Act of 1980, the United States<br />
adopted the UN definition both to<br />
select refugees in refugee camps who<br />
wanted to resettle in the United States<br />
and to determine whether foreigners<br />
seeking asylum in the United States<br />
deserved refugee status.<br />
The number of refugees allowed to<br />
settle in the United States is set each<br />
year by the president, in consultation<br />
with Congress. During the 1990s, the<br />
number of authorized admissions fell<br />
from about 120,000 to 90,000, and<br />
then to 70,000 in 2002 and 2003. Most<br />
refugees are resettled in the United<br />
States with the help of nongovernmental<br />
organizations such as the <strong>Immigration</strong><br />
and Refugee Services of <strong>America</strong>,<br />
with the federal government reimbursing<br />
the organizations for the cash,<br />
medical assistance, and job and language<br />
training they provide to newly<br />
arrived refugees. 28<br />
The second major policy change<br />
involved illegal immigration. During<br />
the 1970s, Congress, federal commissions,<br />
and the press reported on the<br />
increasing number of foreigners,<br />
mostly Mexicans, who were entering<br />
the United States and staying without<br />
permission. In 1976, President Gerald<br />
Ford appointed an interagency task<br />
force to recommend steps to reduce<br />
illegal immigration. In 1978, Congress<br />
established the Select Commission on<br />
<strong>Immigration</strong> and Refugee Policy<br />
(SCIRP) to study the effects of illegal<br />
immigration on the U.S. economy and<br />
society. SCIRP concluded that illegal<br />
migrants adversely affected unskilled<br />
<strong>America</strong>n workers and undermined<br />
the rule of law and that the federal<br />
government should undertake new<br />
efforts to reduce such migration. 29<br />
The best way to deal with illegal immigrants<br />
who had put down roots, SCIRP<br />
said, was to legalize their status by<br />
granting them amnesty. The best way<br />
to discourage future illegal immigration<br />
was to impose penalties, or<br />
“employer sanctions,” on U.S. employers<br />
who hired illegal immigrants.<br />
The <strong>Immigration</strong> Reform and Control<br />
Act of 1986 (IRCA) embodied this<br />
historic bargain. It legalized 2.7 million<br />
unauthorized aliens and, for the first<br />
time, made it unlawful for U.S. employers<br />
to knowingly hire new workers without<br />
verifying their right to work in the<br />
United States. The legalization program<br />
succeeded in that most eligible<br />
aliens became legal immigrants. But<br />
legalization also proved to be an incentive<br />
for more illegal immigration, especially<br />
from Mexico, primarily because<br />
of the Special Agricultural Worker<br />
(SAW) program. The SAW program,<br />
through which 40 percent of the legalizations<br />
occurred, offered legalization<br />
to people who could prove they had<br />
worked for at least 90 days in agricultural<br />
jobs in the United States, but the<br />
program was riddled with fraud. 30 The<br />
employer sanctions part of IRCA also<br />
did not work as intended. The INS was<br />
slow to establish effective enforcement<br />
strategies, and unauthorized workers<br />
found ways to buy false documents to<br />
present to employers.<br />
By the late 1980s, the hope that illegal<br />
immigration had been reduced by<br />
IRCA, and the belief that immigration<br />
19
Table 2<br />
Numerical Limits for Immigrants, Fiscal Year 2001<br />
Preference categories<br />
Numerical limit<br />
Total 675,000<br />
Family-sponsored immigrants—worldwide limit 480,000<br />
Family-sponsored preferences 226,000<br />
First Unmarried sons and daughters of U.S. citizens and their children 23,400<br />
Second Spouses, children, and unmarried sons and daughters of permanent resident aliens 114,200<br />
Third Married sons and daughters of U.S. citizens* 23,400<br />
Fourth Brothers and sisters of U.S. citizens (age 21 or older)* 65,000<br />
Immediate relatives of adult U.S. citizens (spouses, children, and parents)<br />
and children born abroad to alien residents<br />
Unlimited<br />
Employment-based preferences* 140,000<br />
First Priority workers 40,040<br />
Second Professionals with advanced degrees or aliens of exceptional ability 40,040<br />
Third Skilled workers, professionals, needed unskilled workers 40,040<br />
Fourth Special immigrants (ministers, for example) 9,940<br />
Fifth Employment creation (“investors”) 9,940<br />
Diversity immigrants 55,000<br />
*Includes spouses and children.<br />
Notes: The fiscal year runs from Oct. 1, 2000, to Sept. 30, 2001. Immediate relatives may enter without limit, but the number is assumed to be no more than 254,000.<br />
With the 226,000 limit for preference categories, this produces a limit of 480,000 for family-sponsored immigrants. In some categories, visas not used in one year can be<br />
carried over to the next year(s).<br />
Source: <strong>Immigration</strong> and Naturalization Service, 2001 Statistical Yearbook of the <strong>Immigration</strong> and Naturalization Service (2003): A.1-3.<br />
20<br />
of skilled workers was vital to <strong>America</strong>n<br />
competitiveness in global markets, provided<br />
the basis for the <strong>Immigration</strong> Act<br />
of 1990. This law raised the annual<br />
ceiling on immigration and added new<br />
immigration slots, such as the diversity<br />
visas that increased immigration from<br />
Ireland and other countries that had<br />
sent few immigrants in recent times<br />
(see Table 2).<br />
<strong>Immigration</strong> Changes in 1996<br />
In the early 1990s, there was much<br />
debate about immigration, but little<br />
significant new legislation. But pressure<br />
for reform intensified, and 1996<br />
was a watershed year for immigration<br />
legislation, as Congress approved<br />
three major immigration-related laws:<br />
the Antiterrorism and Effective Death<br />
Penalty Act, the Personal Responsibility<br />
and Work Opportunity Reconciliation<br />
Act (PRWORA), and the Illegal<br />
<strong>Immigration</strong> Reform and Immigrant<br />
Responsibility Act (IIRIRA).<br />
These laws were motivated by concern<br />
about terrorism, especially the<br />
role that asylum applicants had in the<br />
1993 World Trade Center bombing;<br />
the desire to find savings to balance<br />
the federal budget and to end perceived<br />
abuses of the U.S. welfare system<br />
by immigrants; and frustration<br />
with continued illegal immigration.<br />
The 1996 antiterrorism law changed<br />
criminal law concerning foreigners,<br />
making it easier to detain without bail<br />
those aliens convicted of crimes committed<br />
in the United States and to<br />
deport them when they have served<br />
their sentences. The same law made<br />
it easier for the INS to exclude foreigners<br />
who arrive at airports without<br />
proper documents and seek asylum in<br />
the United States. Such foreigners can<br />
be subject to “expedited removal” and<br />
barred from legal re-entry if they cannot<br />
make a credible case that they<br />
face persecution at home.<br />
The new welfare law radically<br />
changed the way all low-income residents,<br />
especially new legal immigrants,<br />
receive benefits. Until 1997,<br />
when PRWORA came into force, legal
immigrants generally received the<br />
same benefits from the federal government<br />
as did citizens. PRWORA<br />
made most legal immigrants who<br />
entered the United States after Aug.<br />
22, 1996, ineligible for federal meanstested<br />
welfare benefits unless they<br />
were refugees, veterans of the U.S.<br />
Armed Services, or had worked at<br />
least 10 years in the United States.<br />
PRWORA was expected to save about<br />
$54 billion in its first six years, with<br />
45 percent of the savings coming<br />
from denying welfare benefits to<br />
legal immigrants. In 1998, however,<br />
Congress restored welfare eligibility<br />
for many legal immigrants who had<br />
lived in the United States on Aug. 22,<br />
1996. In 2000, Congress approved<br />
Food Stamp eligibility for immigrants<br />
who had lived in the United States at<br />
least five years.<br />
The third 1996 law, IIRIRA,<br />
included three sets of measures to<br />
reduce illegal immigration and further<br />
tighten the access of legal immigrants<br />
to welfare. First, it called for<br />
1,000 more border patrol agents each<br />
year for five years, bringing the total<br />
from 5,175 in 1996 to almost 10,000<br />
by 2000, and making the INS one of<br />
the fastest-growing federal agencies.<br />
Second, IIRIRA introduced a pilot<br />
telephone verification program to<br />
enable employers to verify the status<br />
of newly hired workers and social service<br />
agencies to determine the legal<br />
status of applicants for benefits. Social<br />
service agencies must verify the legal<br />
status of those applying for benefits,<br />
but employer participation in the verification<br />
program is voluntary.<br />
Third, in an attempt to make sure<br />
that future immigrants would not<br />
need public assistance, IIRIRA required<br />
U.S. residents who sponsor<br />
immigrants for admission to have<br />
higher incomes than were previously<br />
required and to sign legally binding<br />
pledges to support the immigrants<br />
they sponsor. Sponsors were required<br />
to have annual incomes at least 125<br />
percent of the poverty-line income for<br />
their own family as well as the relatives<br />
they sponsor. Under these rules,<br />
a couple sponsoring two parents for<br />
immigrant visas would have to show<br />
an income of at least $22,625 in 2002.<br />
During the late 1990s, Congress<br />
enacted legislation to regularize the<br />
status of hundreds of thousands of<br />
Central <strong>America</strong>ns who had come to<br />
the United States during the civil wars<br />
in their countries in the 1980s but<br />
had been refused asylum under existing<br />
laws. The Nicaraguan Adjustment<br />
and Central <strong>America</strong>n Relief Act of<br />
1997 (NACARA) allows Cubans and<br />
Central <strong>America</strong>ns already in the<br />
United States to petition for immigrant<br />
visas if they can demonstrate<br />
that they would suffer extreme hardship<br />
if they were sent back home. The<br />
Haitian Refugee <strong>Immigration</strong> Fairness<br />
Act of 1998 extended the same option<br />
to some Haitians in the United States.<br />
Responses to Terrorism, 2001<br />
to 2002<br />
On Sept. 11, 2001, 19 foreigners in<br />
the United States hijacked four commercial<br />
planes. Two of the hijacked<br />
planes were flown into the World<br />
Trade Center towers in New York City,<br />
a third slammed into the Pentagon,<br />
and the fourth crashed in Pennsylvania.<br />
More than 3,000 people were<br />
killed and thousands injured in the<br />
attacks, which also demolished the<br />
two World Trade Center towers. In<br />
the wake of these attacks, President<br />
George W. Bush declared war on terrorists<br />
and the countries that harbor<br />
them, and Congress enacted legislation<br />
to fight terrorism.<br />
The ability of the hijackers to plan<br />
and carry out their attack while living<br />
rather normal lives in U.S. communities<br />
demonstrated that the United<br />
States did not have effective systems<br />
for checking applicants for visas overseas,<br />
checking persons seeking entry<br />
to the United States against criminal<br />
databases, or tracking foreigners<br />
inside the country. Several of the<br />
hijackers had been able to obtain<br />
driver’s licenses and ID cards because<br />
states did not require proof that the<br />
applicant was in the United States<br />
legally. Although the hijackers entered<br />
the United States legally, they just as<br />
easily could have slipped into the<br />
21
22<br />
Table 3<br />
U.S.-Born and Foreign-Born<br />
<strong>Population</strong>, 1980 to 2000<br />
U.S.-born Foreign-born<br />
Number (millions)<br />
1980 212.4 14.1<br />
1990 228.9 19.8<br />
2000 250.3 31.1<br />
Percent change<br />
1980–1990 7.8 40.4<br />
1990–2000 9.3 57.1<br />
Source: U.S. Census <strong>Bureau</strong>, Statistical Abstract of the<br />
United States: 2000 (2002): 45.<br />
United States illegally across the Mexican<br />
or Canadian borders.<br />
Congress approved antiterrorism<br />
legislation that affected immigrants,<br />
such as the Uniting and Strengthening<br />
<strong>America</strong> by Providing Appropriate<br />
Tools Required to Intercept and Obstruct<br />
Terrorism (USA PATRIOT) Act<br />
of 2001, which expanded the government’s<br />
power to conduct electronic surveillance,<br />
detain foreigners without<br />
charges, and penetrate money-laundering<br />
banks. USA PATRIOT provided<br />
additional funds for border security<br />
and granted the U.S. Attorney General<br />
the power to detain any foreigner who<br />
the Attorney General certifies is a danger<br />
to national security. The federal<br />
government detained and held in<br />
secret some 1,200 foreigners in the<br />
aftermath of Sept. 11. None were found<br />
to have terrorist links, and most were<br />
deported for violating immigration laws.<br />
The Enhanced Border Security and<br />
Visa Entry Reform Act (EBSVERA) of<br />
2002 added 3,000 immigration inspectors<br />
and investigators, required universities<br />
to keep better track of foreign<br />
students, and enhanced the scrutiny<br />
of visa applications from applicants of<br />
countries deemed sponsors of terrorism.<br />
The Student Exchange and Visitor<br />
Information System (SEVIS) is<br />
designed to track students in the<br />
United States and to tighten requirements<br />
on the schools that admit foreign<br />
students for study in the United<br />
States. Visas to visit the United States<br />
are issued at U.S. consulates abroad,<br />
but the information submitted by<br />
applicants from most Middle Eastern<br />
countries must be sent to Washington,<br />
D.C., to be checked against databases<br />
operated by the Federal <strong>Bureau</strong> of<br />
Investigation and the Central Intelligence<br />
Agency.<br />
Perhaps the most important change<br />
after Sept. 11 was the abolition of the<br />
INS. There had been many calls in the<br />
late 1990s to reorganize and restructure<br />
the agency, which enforced immigration<br />
laws and provided immigration<br />
benefits, such as work authorization<br />
and naturalization, but demands for<br />
sweeping change for the INS intensified<br />
after the Sept. 11 attacks. In 2003,<br />
the INS was divided into several pieces<br />
that were moved to different sections<br />
of the new Department of Homeland<br />
Security (DHS). Most immigration and<br />
naturalization services now fall under<br />
the newly created <strong>Bureau</strong> of Citizenship<br />
and <strong>Immigration</strong> Services. The<br />
primary border control and enforcement<br />
functions were moved to a new<br />
Directorate of Border and Transportation<br />
Security within DHS. 31<br />
<strong>Immigration</strong> and<br />
U.S. <strong>Population</strong><br />
<strong>Immigration</strong> has a major effect on<br />
the size, distribution, and composition<br />
of the U.S. population. Because fertility<br />
and mortality have fallen to relatively<br />
low levels in the United States,<br />
immigration’s role in the growth of<br />
the national, state, and local populations<br />
has increased in recent decades.<br />
<strong>Immigration</strong> contributed one-third<br />
to one-half of the total population<br />
increase between 1990 and 2000; the<br />
foreign-born population increased by<br />
nearly 11 million during the 1990s,<br />
while the U.S.-born population grew<br />
by nearly 21 million (see Table 3). The<br />
increase in the number of foreignborn<br />
was unprecedented and somewhat<br />
unexpected. The 2000 Census<br />
count of U.S. residents was about 6<br />
million higher than expected largely<br />
because net migration was greater<br />
than had been projected.
Because immigrants have characteristics<br />
different from those of nativeborn<br />
<strong>America</strong>ns, they are making the<br />
<strong>America</strong>n populace more diverse (see<br />
Box 2). Until the 1990s, these effects<br />
were confined largely to the major<br />
immigration states: California, Florida,<br />
Illinois, New York, and Texas were<br />
home to 75 percent of immigrants<br />
in 1990. But the foreign-born began<br />
Box 2<br />
The Foreign-Born <strong>Population</strong><br />
The United States has always had a significant foreign-born<br />
population, but the number of foreign<br />
born reached an all-time high of 32.5 million in<br />
2002—equal to 11.5 percent of the U.S. population—according<br />
to the Current <strong>Population</strong> Survey<br />
(CPS). 1 During the peak years of immigration early<br />
in the 20th century, the number of foreign-born<br />
residents was lower, but they made up a larger share<br />
of U.S. residents. In 1910, for example, there were<br />
only 13.5 million foreign-born residents, but they<br />
represented 15 percent of all U.S. residents.<br />
Most foreign-born residents are fairly recent<br />
arrivals: About one-half of the 2002 foreign-born<br />
residents arrived in 1990 or later. They are highly<br />
concentrated in a few states. Nearly 60 percent<br />
lived in one of four states in 2002: California (with<br />
28 percent of the total), New York, Florida, or<br />
Texas. But the sharpest increases in foreign-born<br />
residents since 1990 were in other states, such as<br />
Nevada, where the foreign-born population rose<br />
from 105,000 to 386,000 between 1990 and 2002,<br />
and North Carolina, where it rose from 115,000<br />
to 381,000.<br />
Not all foreign-born residents are immigrants.<br />
Demographer Jeff Passel estimates that at least 3<br />
percent are nonimmigrants, including foreign students,<br />
diplomats, and temporary workers, and some<br />
will return to their countries of origin. Between 7<br />
million and 9 million are unauthorized foreigners,<br />
which means that only about 75 percent of all foreign-born<br />
residents are legal immigrants. One reason<br />
for the range in the estimate of unauthorized<br />
foreigners is that some demographers count foreigners<br />
with a quasi-legal status as unauthorized,<br />
and others treat them as authorized.<br />
More than one-half of the 2002 foreign-born<br />
residents were born in Latin <strong>America</strong>—with 30 percent<br />
from Mexico alone. Twenty-six percent were<br />
born in Asia, 14 percent in Europe, and 8 percent<br />
from Africa and other regions.<br />
Foreign-born residents age 18 or older are more<br />
likely than the U.S.-born to be in the U.S. work<br />
force, but they are younger, less educated, and have<br />
lower annual earnings. A recent analysis of the 2002<br />
CPS showed that the average age of a U.S.-born<br />
worker who worked full-time at least part of 2001<br />
was 41 years, and median earnings were $31,200. 2<br />
For foreign-born residents, the average age was 39<br />
years, and median earnings were $24,000. Foreignborn<br />
residents who arrived in 1990 or later—half of<br />
the total—were much younger and had much lower<br />
incomes: Their average age was 32 and median<br />
earnings $20,000. These low earnings reflect the<br />
fact that 34 percent of these recent arrivals were not<br />
high school graduates. By contrast, 16 percent of<br />
U.S.-born residents had not finished high school.<br />
Foreign-born residents were 14.5 percent of the<br />
121 million U.S. workers employed full-time for at<br />
least part of 2001. Immigrants were 44 percent of<br />
private household workers, 42 percent of those with<br />
nonmanagerial farming occupations, and 20 percent<br />
of operators, fabricators, and laborers.<br />
About 16 percent of foreign-born residents, and<br />
11 percent of U.S.-born residents, had incomes<br />
below the poverty line in 2002. By country of origin,<br />
about 26 percent of those born in the Dominican<br />
Republic were poor, as were 20 percent of those<br />
born in Mexico and Pakistan, and 20 percent of<br />
those born in Cuba and Honduras. About 24 percent<br />
of households headed by foreign-born residents<br />
obtained a means-tested federal benefit in<br />
2001, versus 16 percent of households headed by a<br />
U.S.-born resident: The most common benefit used<br />
by both groups was Medicaid. Country of origin<br />
data for welfare use track poverty data—59 percent<br />
of households headed by a person born in the<br />
Dominican Republic obtained a means-tested federal<br />
benefit in 2001, as did 36 percent of those<br />
headed by a person born in Mexico, 35 percent of<br />
those headed by a person born in Cuba, and 33<br />
percent of those headed by a person born in Haiti.<br />
Many foreign-born residents are in their prime<br />
childbearing years, so the percentage of births to<br />
foreign-born women is higher than their share of<br />
U.S. residents. In 2001, 22.5 percent of the 4 million<br />
births in the United States were to foreign-born<br />
women; 63 percent of births to Hispanics were to<br />
mothers born outside the United States. 3<br />
<strong>Reference</strong>s<br />
1. Dianne Schmidley, “The Foreign-Born <strong>Population</strong> in<br />
the United States: March 2002,” Current <strong>Population</strong><br />
Reports P20-539 (2003).<br />
2. Steven A. Camarota, “Immigrants in the United<br />
States—2002,” Backgrounder (Washington, DC: Center<br />
for <strong>Immigration</strong> Studies, November 2002).<br />
3. Joyce A. Martin et al., “Births: Final Data for 2001,”<br />
National Vital Statistics Report 51, no. 2 (2002): 45.<br />
23
Figure 3<br />
U.S. <strong>Population</strong> by Race and Ethnic Group, 1970, 2000, and 2050<br />
1970 2000 2050 (projection)<br />
Hispanic<br />
5%<br />
Asian/<br />
Pacific Islander<br />
Black<br />
11%<br />
1% <strong>America</strong>n<br />
Indian/other<br />
1%<br />
White,<br />
non-Hispanic<br />
83%<br />
Asian/<br />
Pacific Islander<br />
4%<br />
Hispanic<br />
13%<br />
Black<br />
13%<br />
White,<br />
non-Hispanic<br />
70%<br />
<strong>America</strong>n<br />
Indian/other<br />
1%<br />
Asian/<br />
Pacific Islander<br />
10%<br />
Hispanic<br />
25%<br />
Black<br />
13%<br />
<strong>America</strong>n<br />
Indian/other<br />
1%<br />
White,<br />
non-<br />
Hispanic<br />
52%<br />
U.S. population = 203 million U.S. population = 281 million U.S. population = 409 million<br />
Note: Numbers may not add to 100 due to rounding.<br />
Source: U.S. Census <strong>Bureau</strong>, “Table 1: United States—Race and Hispanic Origin, 1790 to 1990 (Sept. 13, 2002; www.census.gov/population/<br />
documentation/twps0056/tab01.xls, accessed May 5, 2003); and J. Passel, “Projections of the U.S. <strong>Population</strong> and Labor Force by Generation<br />
and Educational Attainment: 2000–2050” (2003).<br />
24<br />
moving into other states during the<br />
1990s. By 2000, these five states had<br />
only about 66 percent of the U.S.<br />
foreign-born population. States such<br />
as Arkansas, Colorado, Georgia,<br />
Nebraska, Nevada, North Carolina,<br />
Tennessee, and Utah saw the number<br />
of immigrants more than double in<br />
the 1990s, adding the workers many<br />
employers sought but posing challenges<br />
to these states to provide services<br />
to immigrants and their<br />
children. 32<br />
The United States had 281 million<br />
residents in 2000. There were 197 million<br />
white non-Hispanic residents representing<br />
nearly 70 percent of the total<br />
U.S. population; 35 million Hispanics<br />
and 35 million black non-Hispanics,<br />
accounting for 13 percent each; and<br />
10 million Asian and Pacific Islanders,<br />
making up 4 percent of the U.S. population.<br />
The 2.1 million non-Hispanic<br />
<strong>America</strong>n Indian and Alaska Natives<br />
and miscellaneous other racial categories<br />
made up less than 1 percent of<br />
the total.<br />
If current fertility, mortality, and<br />
immigration patterns continue, the<br />
U.S. population is projected to reach<br />
349 million in 2025 and 409 million<br />
in 2050. Under those assumptions,<br />
non-Hispanic whites will make up 52<br />
percent of the population in 2050;<br />
non-Hispanic blacks will make up 13<br />
percent; Hispanics, 25 percent; non-<br />
Hispanic Asians and Pacific Islanders,<br />
10 percent; and <strong>America</strong>n Indians,<br />
Alaska Natives, and others will account<br />
for less than 1 percent (see Figure 3).<br />
These projections assume an annual<br />
influx of about 1,250,000 immigrants<br />
and an exit of 330,000 foreign-born<br />
residents, for an annual net gain of<br />
920,000 legal and illegal immigrants<br />
between 2000 and 2050. 33<br />
The number of foreign-born residents<br />
(first-generation <strong>America</strong>ns) is<br />
projected to rise from 31 million in<br />
2000 to 48 million in 2025 and 60 million<br />
in 2050. The foreign-born share of<br />
the U.S. population is projected to rise<br />
from 11 percent to 15 percent between<br />
2000 and 2050. While the foreign-born<br />
share will likely reach its highest level<br />
in 150 years, the projected figure is<br />
roughly comparable to the levels<br />
between 1870 and 1910.<br />
The demographic effect of immigration<br />
reaches beyond the number of<br />
new foreign-born residents. As they<br />
have children, immigrants add further<br />
to population growth and change, so<br />
immigrants and their children, the
first- and second-generation <strong>America</strong>ns,<br />
are often combined to discuss<br />
the demographic impacts of immigration.<br />
In 2000, the foreign-born and<br />
their children made up 21 percent of<br />
the U.S. population. If net immigration<br />
averages 820,000 a year, first- and<br />
second-generation <strong>America</strong>ns are projected<br />
to represent one-third of the<br />
U.S. population by 2025. This is not<br />
particularly high by historical standards:<br />
Between 1900 and 1920, 33<br />
percent to 35 percent of the population<br />
were first- or second-generation<br />
<strong>America</strong>ns. 34<br />
Some analysts contend that immigration<br />
can “keep <strong>America</strong> young” or<br />
“save Social Security” by improving the<br />
ratio of contributors of tax dollars to<br />
recipients of public benefits. 35 Demographic<br />
analysis, however, reveals that<br />
current levels of immigration have a<br />
small effect on the median age of U.S.<br />
residents and on the dependency<br />
ratio—the number of working-age<br />
people relative to the number of children<br />
and elderly. The U.S. median age<br />
is projected to rise from 35.3 in 2000<br />
to 39.0 in 2050, assuming net immigration<br />
of 920,000 people annually. If<br />
there were no net immigration after<br />
2000, the U.S. median age would be<br />
42.8, almost four years older. 36<br />
Because most immigrants are<br />
Asians and Hispanics, immigration<br />
will slow the aging of the U.S. Hispanic<br />
and Asian populations, but it<br />
will have little effect on the non-<br />
Hispanic white or black populations.<br />
The median age for Hispanics and<br />
Asians would be about three years<br />
older in 2025 with no net immigration<br />
after 2000 than with additional immigration.<br />
With no additional immigration,<br />
non-Hispanic whites would have<br />
a median age of 43.4 years, compared<br />
with 42.2 years with immigration.<br />
How does immigration affect<br />
dependency, the degree to which<br />
working-age residents support children<br />
and the elderly? The U.S. social<br />
security system transfers funds from<br />
current workers to retired workers. Its<br />
ability to pay benefits depends on<br />
both demography—the number of<br />
workers and retirees—and economics—the<br />
earnings and taxes collected<br />
from workers and employers.<br />
<strong>Immigration</strong> increases the size of<br />
the U.S. labor force but has a relatively<br />
small effect on the dependency ratio.<br />
The U.S. labor force, which was 142<br />
million in 2000, is projected to be 152<br />
million in 2025 with no immigration<br />
after 2000, and 170 million with immigration.<br />
There were 4.1 workers for<br />
every person age 65 or older in 2000.<br />
This ratio would drop to 2.5 workers<br />
per elderly person by 2025 if net immigration<br />
ceased after 2000. Even with<br />
immigration, however, the ratio would<br />
drop substantially, to 2.8 by 2025. 37<br />
Immigrants are mostly young people<br />
who have children. Because immigrants<br />
have a higher fertility rate than<br />
the U.S.-born population, their presence<br />
decreases the ratio of workers to<br />
children under age 18. In 2000, there<br />
were 2.0 children per worker. Recent<br />
population projections show the ratio<br />
will be about the same in 2025, assuming<br />
current levels of immigration. With<br />
no further immigration, there would<br />
be more workers for each child, and<br />
the ratio would rise to 2.2 by 2025. 38<br />
The number of elderly in 2025<br />
would be similar with or without further<br />
immigration: slightly more than<br />
60 million. Consequently, immigration<br />
nudges the worker-elderly ratio a little<br />
higher, meaning that there are more<br />
people of working age per person age<br />
65 or older. <strong>Immigration</strong> has a more<br />
dramatic effect on the younger ages.<br />
<strong>Immigration</strong> after 2000 is projected to<br />
add about 15 million more children<br />
under age 18 than there would be<br />
without any post-2000 immigration (84<br />
million versus 69 million). Continued<br />
immigration will lower the worker-child<br />
ratio and increase the child component<br />
of the dependency ratio.<br />
Economic Effects<br />
Most immigrants come to the United<br />
States for higher wages and more<br />
opportunities, and their work has significant<br />
effects on the U.S. economy<br />
and labor market. Like U.S. citizens,<br />
most working-age immigrants seek<br />
<strong>Immigration</strong><br />
has a small<br />
effect on<br />
the U.S.<br />
median age.<br />
25
26<br />
Figure 4<br />
2002 Educational Levels of U.S.-<br />
Born <strong>America</strong>ns and Foreign-<br />
Born <strong>America</strong>ns Who Arrived in<br />
or After 1990<br />
Percent of people ages 25+<br />
8%<br />
16%<br />
61%<br />
16%<br />
U.S.-born<br />
Graduate/professional<br />
degree<br />
College degree<br />
High school/<br />
some college<br />
Less than<br />
high school<br />
11%<br />
19%<br />
36%<br />
34%<br />
Foreign-born<br />
Source: U.S. Census <strong>Bureau</strong>, Foreign-Born <strong>Population</strong><br />
of the United States, Current <strong>Population</strong> Survey–March<br />
2002, Detailed Tables PPL-162 (www.census.gov/<br />
population/socdemo/foreign/97/ppLtab1.txl,<br />
accessed March 10, 2003): table 2.5.<br />
jobs, earn wages, pay taxes, and consume<br />
public services. In 1997, the<br />
National Research Council (NRC)<br />
concluded that legal and illegal immigration<br />
add between $1 billion and<br />
$10 billion per year to the U.S. gross<br />
domestic product, largely because<br />
immigration holds down U.S. wages<br />
and thus prices and increases the efficiency<br />
of the economy. 39 <strong>Immigration</strong><br />
has a positive net economic effect, but<br />
it is a very small factor in an $8 trillion<br />
economy that normally expands by<br />
$300 billion a year. 40<br />
The NRC report emphasized that<br />
the most important economic issues<br />
are distributional. Who benefits and<br />
who suffers from immigration? In<br />
particular, how does the presence of<br />
new arrivals affect settled immigrants<br />
and <strong>America</strong>ns whose education and<br />
skills are similar to those of the new<br />
arrivals? How quickly do immigrants<br />
climb the <strong>America</strong>n job ladder? The<br />
NRC found that most of the economic<br />
benefits of immigration accrue to the<br />
immigrants themselves, to owners of<br />
capital, and to highly educated U.S.<br />
residents. The fact that highly educated<br />
U.S. residents benefit from<br />
immigration, and that immigrants,<br />
when ranked by years of education,<br />
are at the extremes of the distribution,<br />
means that immigration tends<br />
to increase inequality.<br />
Among those who arrived in 1990<br />
or later, 30 percent of the foreignborn<br />
population had an undergraduate<br />
degree or higher in 2002,<br />
compared with 24 percent of U.S.-<br />
born <strong>America</strong>ns ages 25 and older<br />
(see Figure 4). At the other end of<br />
the distribution, about 34 percent<br />
of the recently arrived foreign-born<br />
adults had not finished high school,<br />
versus 16 percent of the U.S.-born.<br />
Because education is the best predictor<br />
of a person’s earnings, these percentages<br />
help explain the growing<br />
inequality between foreign-born and<br />
U.S.-born <strong>America</strong>ns and within the<br />
foreign-born population.<br />
Labor Market Effects<br />
<strong>Immigration</strong> changes U.S. labor markets<br />
(see Box 3). In 1986, the President’s<br />
Council of Economic Advisers<br />
summarized the labor market effects<br />
of immigrants as follows: “Although<br />
immigrant workers increase output,<br />
their addition to the supply of labor ...<br />
[causes] wage rates in the immediately<br />
affected market [to be] bid<br />
down. ... Thus, native-born workers<br />
who compete with immigrants for jobs<br />
may experience reduced earnings or<br />
reduced employment.” 41<br />
Research interest and policy concerns<br />
focus on how immigrants affect<br />
those in the bottom half of the labor<br />
market. Governments have long protected<br />
vulnerable low-wage workers by<br />
establishing minimum wages and regulating<br />
hours of work; there are also<br />
education and training programs to<br />
help workers improve their job skills<br />
and thus their earnings. The 1960s<br />
War on Poverty and civil rights movement<br />
reinforced the U.S. commitment
Box 3<br />
<strong>Immigration</strong> Trade-Offs<br />
<strong>Immigration</strong> is often characterized as either good or<br />
bad for the country, but few public policy choices are<br />
contests between good and bad. They are instead arguments<br />
about which of two goods deserves higher priority.<br />
For example, adjusting interest rates upward can<br />
lead to lower inflation, which is a desirable result, but<br />
away from fuller employment, a competing good. Similarly,<br />
reducing trade barriers can stimulate exports,<br />
which can help some employers and workers, but<br />
increase imports, which can lead to the failure of other<br />
businesses and the loss of jobs. There is no easy way to<br />
balance the trade-offs between competing outcomes.<br />
Decisions on the three basic immigration questions<br />
entail making such trade-offs:<br />
• How many immigrants should be allowed to enter?<br />
• From which countries should they come?<br />
• How should the government enforce immigration<br />
rules?<br />
Agriculture, a sector that has employed large<br />
numbers of Mexicans for the past 60 years, affords an<br />
example of the trade-offs. <strong>America</strong>ns want to pay low<br />
prices for food. They also want farm workers, like<br />
other U.S. workers, to have decent wages and working<br />
conditions. To achieve both goals, Congress permitted<br />
Mexican workers to enter the United States<br />
and provide low-cost labor on farms. Congress then<br />
tried to alleviate the poverty of farm workers and<br />
their children by providing special education, health,<br />
and housing programs. But these special programs<br />
have not prevented farm workers from being among<br />
the poorest <strong>America</strong>n workers. 1 There are trade-offs<br />
between these competing goods—inexpensive food<br />
and decent farm wages.<br />
If the United States wants both cheap food and<br />
decent farm wages—competing desirable goods—it is<br />
useful to determine precisely what the trade-offs are<br />
between them. According to the Consumer Expenditure<br />
Survey, there were 110 million “consumer units”<br />
in 2001, with an average of 2.5 people, 1.4 earners,<br />
and 1.9 vehicles. The average U.S. household had a<br />
pre-tax income of $47,500 and spent $39,500 in 2001. 2<br />
These household expenditures included $5,200<br />
for food (14 percent of total expenditures). 3 Expenditures<br />
on fresh fruits and vegetables, which are<br />
labor-intensive, totaled $322 a year or $6.20 a week.<br />
In contrast, the average household spent $6.70 weekly<br />
on alcoholic beverages.<br />
Farmers received about 18 percent of the retail<br />
price of fresh fruits and vegetables in 2001, so $322<br />
from the consumer means that the farmer received<br />
$56. Less than one-third of the $56 would go to<br />
farm worker wages and benefits. Consumers who<br />
pay $1 for a pound of apples or a head of lettuce<br />
are giving about 18 cents to the farmer and 6 cents<br />
to the farm worker.<br />
About two-thirds of the 2.5 million U.S. farm<br />
workers were born abroad. It is hard to determine<br />
how much wages would rise if foreign workers were<br />
not available, but in 1966, one year after the end of<br />
the bracero program, the then-fledgling United Farm<br />
Workers union won a 40 percent wage increase for<br />
grape harvesters. 4 Average earnings were $7.56 an<br />
hour for U.S. field and livestock workers in 2000,<br />
according to a U.S. Department of Agriculture survey<br />
of farm employers. A 40 percent increase would raise<br />
them to $10.58 an hour. If this wage increase were<br />
passed fully to consumers, the 6-cent farm labor cost<br />
of a pound of apples or a head of lettuce would rise<br />
to between 7 and 9 cents, and the retail price would<br />
rise by 2 to 3 cents. 5<br />
For a typical household, a 40 percent increase in<br />
farm labor costs translates into a 2 percent to 3 percent<br />
increase in retail prices (0.175 x 0.33 = 6 percent,<br />
farm labor costs rise 40 percent, and 0.4 x 6 =<br />
2.4 percent), so total spending on fruits and vegetables<br />
would rise by $8, from $322 a year to $330 a<br />
year. Earnings for a typical seasonal farm worker<br />
could rise from $8,000 to $11,200 a year.<br />
Are the savings on fresh produce provided by lowcost<br />
immigrant labor worthwhile? The migrants are<br />
better off, earning 5 to 10 times more in the United<br />
States than they would at home. U.S. farmers and their<br />
bankers are also better off, enjoying higher profits and<br />
therefore higher land prices. U.S. and foreign consumers<br />
of U.S. commodities pay less for fresh produce.<br />
The critical question is whether these benefits are<br />
more valuable than having farm work performed and<br />
rewarded like other work in <strong>America</strong>. The way this<br />
question is answered is a major determinant of U.S.<br />
immigration policy, especially with respect to Mexico.<br />
<strong>Reference</strong>s<br />
1. The evolution and effectiveness of these programs is<br />
examined in Philip L. Martin and David Martin, The Endless<br />
Quest: Helping <strong>America</strong>’s Farm Workers (Boulder, CO:<br />
Westview Press, 1993).<br />
2. <strong>Bureau</strong> of Labor Statistics (BLS), Consumer Expenditures in<br />
2001, customized tables, accessed online at www.bls.gov/<br />
cex/#data, on April 21, 2003.<br />
3. BLS, Consumer Expenditures in 2001, Report 966, accessed<br />
online at www.bls.gov/cex/csxann01.pdf, on April 21, 2003.<br />
4. Philip Martin, Promises to Keep: Collective Bargaining in California<br />
Agriculture (Ames, IA: Iowa State University Press,<br />
1996).<br />
5. Philip Martin, Promise Unfulfilled: Unions, <strong>Immigration</strong>, and<br />
Farm Workers (Ithaca, NY: Cornell University Press, 2003);<br />
and National Agricultural Statistics Service, Farm Labor<br />
(2000) accessed online at http://jan.mannlib.cornell.edu/<br />
reports/nassr/other/pfl-bb/2000/fmla1100.pdf, on May<br />
14, 2003: 15.<br />
27
28<br />
to improving conditions at the bottom<br />
of the labor market through<br />
employment and training programs<br />
for less-skilled workers and affirmative<br />
action for workers from groups that<br />
suffered discrimination in the past.<br />
Economists and other social scientists<br />
have used three kinds of studies<br />
to examine the labor market effects<br />
of immigrants in detail: case studies,<br />
econometric studies, and economic<br />
mobility or integration studies.<br />
Case Studies<br />
Case studies examine a particular<br />
industry or occupation. Many of the<br />
first immigration studies were case<br />
studies that were undertaken after<br />
U.S. workers went on strike and were<br />
replaced by immigrants. When farm<br />
workers in Southern California went<br />
on strike for a wage increase in 1982,<br />
for example, many lost their jobs. The<br />
unionized workers were displaced in a<br />
competition between employers. The<br />
unionized harvesting association lost<br />
business to farm labor contractors<br />
(FLCs) who hired nonunion and<br />
often unauthorized workers. The<br />
harvesting association went out of<br />
business, and the union workers lost<br />
their jobs. 42<br />
Case studies have shown that immigration<br />
can displace established<br />
workers and depress wages by adding<br />
vulnerable workers to the labor<br />
supply. This scenario conforms to<br />
accepted labor market theory, but the<br />
actual effects on wages and employment<br />
are indirect and hard to measure.<br />
43 Once employers begin hiring<br />
newly arrived workers through FLCs,<br />
for example, hiring and supervision<br />
can change. Local workers may not<br />
learn about job vacancies if the FLCs<br />
find additional workers by asking<br />
current employees to bring in their<br />
friends and relatives. Such network<br />
hiring helps explain why many garment<br />
shops in New York or Los Angeles<br />
have Mexican, Chinese, or Thai<br />
seamstresses, but not a mixture of the<br />
three. Network hiring also explains<br />
how the owners of office buildings<br />
in Los Angeles in the 1980s came to<br />
replace unionized U.S.-born black janitors<br />
with immigrants hired by cleaning<br />
contractors.<br />
Econometric Studies<br />
Econometric studies consider how<br />
immigration, wages, and employment<br />
interact in a city labor market, or they<br />
compare labor markets among cities.<br />
They begin with the assumption that,<br />
if immigrants depress wages or displace<br />
workers, then the more immigrants<br />
there are in a city, the greater<br />
the observed wage depression or job<br />
displacement will be. Econometric<br />
studies might study the influence of<br />
immigration on the wages and unemployment<br />
rates of blacks, Hispanics,<br />
and women in Los Angeles by comparing<br />
them with similar groups in<br />
Atlanta, which has a relatively small<br />
immigrant population.<br />
In the 1980s, to the surprise of<br />
economists, such studies found few<br />
wage or labor market effects related<br />
to immigration. In 1990, economist<br />
George Borjas summarized the research<br />
literature by saying that “modern<br />
econometrics cannot detect a<br />
single shred of evidence that immigrants<br />
have a sizable adverse impact<br />
on the earnings and employment<br />
opportunities of natives in the United<br />
States.” 44 One well-known econometric<br />
study concluded, for example, that<br />
the 1980 influx of Cuban immigrants<br />
to Miami in the Mariel boatlift had<br />
no measurable negative effect on the<br />
wages and employment of local workers.<br />
During the four months of the<br />
boatlift, Miami’s labor force increased<br />
by 7 percent, but there were no significant<br />
differences between wage and<br />
job opportunities for native-born<br />
workers in Miami and in other U.S.<br />
cities. 45 The evidence suggested that<br />
the immigrants generated enough<br />
economic activity to offset any negative<br />
effects their presence might have<br />
on the wages or job prospects of local<br />
workers.<br />
As more data became available<br />
in the 1990s, however, researchers<br />
were able to measure some of the<br />
labor market and wage effects of<br />
immigration that economic theory<br />
predicted. The most important new
evidence involved studies of migration<br />
patterns within the United States,<br />
which found that workers who had to<br />
compete with immigrants were moving<br />
away from the cities that were<br />
attracting the most immigrants, presumably<br />
to avoid competing with<br />
them in the labor market. The effects<br />
of immigration on wages and unemployment<br />
in Los Angeles or Houston<br />
were thus dispersed throughout the<br />
United States in a process that<br />
demographer William Frey called<br />
“the new white flight.” 46<br />
Econometric studies have also<br />
begun to acknowledge that the effects<br />
of immigration have been hard to<br />
measure because a large majority of<br />
workers are not vying for the types of<br />
unskilled jobs usually held by newly<br />
arrived immigrants. The wages of government<br />
employees, for example, are<br />
set at federal or state levels, and the<br />
earnings of many union workers are<br />
determined by national or regional<br />
collective bargaining agreements.<br />
Comparing the earnings of blacks<br />
and Hispanic immigrants may not<br />
be meaningful if a disproportionate<br />
share of the black workers are employed<br />
by the government or under<br />
union contracts. If workers who compete<br />
with unskilled immigrants move<br />
away and the workers who do not<br />
compete remain, the effect of immigrants<br />
may not be detected in the<br />
city’s labor market. 47<br />
Econometric studies have found<br />
that the labor-market effects of<br />
unskilled immigrants are probably<br />
small but that they may be significant<br />
in particular industries and areas, such<br />
as the garment or meatpacking industries.<br />
Agriculture is probably the U.S.<br />
industry most dependent on unauthorized<br />
workers. In the late 1990s, almost<br />
50 percent of the 2.5 million U.S. farm<br />
workers were unauthorized foreigners,<br />
despite the legalization of more than 1<br />
million illegal farm workers in 1987<br />
and 1988. Many who were legalized<br />
moved on to nonfarm jobs, which created<br />
a vacuum that drew in more<br />
unauthorized workers and helped<br />
keep wages and benefits for farm workers<br />
among the lowest in <strong>America</strong>.<br />
Economic Mobility Studies<br />
Economic mobility, or integration,<br />
studies investigate how immigrants<br />
and their children are faring in the<br />
United States. The starting point for<br />
these studies is the fact that “immigrants<br />
on average earn less than<br />
native workers [and] this gap ... has<br />
widened recently ... [as] the skills<br />
[years of education] of immigrants<br />
have declined relative to those of the<br />
native-born.” 48 The average educational<br />
level of immigrants has been<br />
rising, but the educational level of<br />
U.S.-born residents has risen faster,<br />
which explains the widening education<br />
gap and, by extension, the growing<br />
income inequality between<br />
foreign-born and U.S.-born <strong>America</strong>ns<br />
and within the foreign-born<br />
population.<br />
One of the most important issues<br />
for society and the economy is<br />
whether those who immigrate to the<br />
United States are so energetic and<br />
ambitious that their earnings will<br />
quickly catch up to and even surpass<br />
those of their native-born counterparts.<br />
Economist Barry Chiswick conducted<br />
research in the 1970s that<br />
found just such a catch-up pattern for<br />
immigrants who arrived in the 1950s<br />
and 1960s. The immigrant men<br />
Chiswick studied initially earned 10<br />
percent less than did similar U.S.-born<br />
men. But the drive and ambition that<br />
prompted them to migrate enabled<br />
the migrants to close the earnings gap<br />
after an average of 13 years in the<br />
United States and to earn 6 percent<br />
more than similar U.S.-born men after<br />
23 years. 49 The immigrants’ motivation<br />
and ambition, it seemed, could<br />
expand the U.S. economy and raise<br />
average earnings.<br />
Borjas, however, contended that<br />
Chiswick’s study captured a unique set<br />
of circumstances: the influx of highly<br />
skilled Asian immigrants after 1965<br />
policy changes and a booming U.S.<br />
economy. In 1970, the average immigrant<br />
earned 1 percent more than the<br />
average U.S.-born worker. However,<br />
the earnings of Mexican and Central<br />
<strong>America</strong>n immigrants, among others,<br />
did not catch up to the U.S.-born aver-<br />
29
30<br />
Do immigrants<br />
pay their<br />
way in the<br />
U.S. economy?<br />
The answer<br />
is complex.<br />
age. During the 1970s and 1980s, the<br />
proportion of Mexicans and Central<br />
<strong>America</strong>ns among immigrants rose,<br />
and so did the earnings gap. Mexican<br />
and Central <strong>America</strong>n immigrant men<br />
had 25 percent to 40 percent lower<br />
earnings than similar U.S.-born men<br />
in 1970, and 50 percent lower earnings<br />
in 1990. Instead of catching up to<br />
<strong>America</strong>ns in earnings, Borjas concluded,<br />
immigrants could add to the<br />
low-income population. 50<br />
Entrepreneurship<br />
Economists tend to look at U.S. earnings<br />
to measure economic integration,<br />
but other social scientists may<br />
emphasize other factors, such as the<br />
success of immigrants in starting<br />
their own businesses. Immigrantowned<br />
businesses are highly visible<br />
in many cities, where immigrants’<br />
restaurants, dry-cleaning and tailoring<br />
establishments, and small stores<br />
are patronized by immigrants and<br />
natives alike. Immigrant entrepreneurs<br />
exemplify the energy that newcomers<br />
add to the U.S. economy<br />
while helping to revitalize cities. 51<br />
Is self-employment a sign of immigrant<br />
success or does it reflect difficulties<br />
finding “regular” employment? In<br />
an industrial economy, moving from<br />
self-employment to a paid job usually<br />
brings better pay and benefits. Selfemployed<br />
farmers may leave the land<br />
to seek employment in cities, for example.<br />
Self-employment is usually<br />
countercyclical: It increases during<br />
recessions and declines when the economy<br />
is booming. When rural migrants<br />
lose their jobs in the city, for example,<br />
they may return to the land and selfemployment.<br />
In the service economy,<br />
“self-employment rises during recessions<br />
when regular jobs may be harder<br />
to find and laid-off executives may<br />
enter self-employed ‘consulting.’” 52<br />
Some social scientists who study<br />
immigrant communities, however,<br />
regard immigrant self-employment as a<br />
sign of success and upward mobility. In<br />
an influential 1985 book, Alejandro<br />
Portes and Robert Bach described how<br />
Cuban immigrants formed an “ethnic<br />
enclave” in Miami that enabled them<br />
to start businesses that created jobs<br />
for themselves and fellow Cubans. 53<br />
Instead of seeing self-employment as<br />
the failure to get a “real job,” Portes<br />
and Bach argued that self-employment<br />
showed how immigrants could take<br />
advantage of business opportunities in<br />
their communities. In 2002, however,<br />
only about 10 percent of foreign-born<br />
people were self-employed, versus 11<br />
percent of the U.S.-born. 54<br />
Fiscal Effects<br />
One of the most debated questions of<br />
the 1990s was whether immigrants<br />
“pay their way” in the United States.<br />
Do the taxes immigrants pay cover<br />
the cost of the public services they<br />
use, including schools, welfare, health<br />
care, and transportation systems? The<br />
answers are complex and depend in<br />
part on how well we can measure<br />
both the short-term and long-term fiscal<br />
effects of immigrants. The answers<br />
may also depend on the point of view<br />
of the investigator.<br />
Analysts inclined to look at the<br />
positive effects of immigration have<br />
argued that immigrants generally provide<br />
a fiscal surplus: Most immigrants<br />
are young and in their working and<br />
taxpaying years. They generally do<br />
not draw Social Security or health<br />
benefits. Furthermore, although<br />
immigrants are taxed like U.S. citizens,<br />
they are not eligible for all<br />
publicly provided services. Illegal<br />
immigrants, who also pay taxes, are<br />
excluded from almost all welfare benefits,<br />
as well as unemployment insurance<br />
and nonemergency health care<br />
services. Children living in the United<br />
States illegally, however, may attend<br />
public schools on the same basis as<br />
any citizen or legal resident.<br />
Several states, including California,<br />
Florida, and Texas, have sued<br />
the federal government to recover<br />
the cost of providing public services<br />
to unauthorized foreigners. Though<br />
the legal suits were rejected by the<br />
courts, they stimulated research<br />
about the amount of taxes paid by<br />
immigrants and the costs of providing<br />
services to immigrants. The NRC
eviewed the fiscal impact studies<br />
prepared in support of these suits<br />
and reached two major conclusions.<br />
First, an immigrant’s fiscal balance—<br />
the taxes paid minus the cost of services<br />
consumed—depends primarily<br />
on the immigrant’s earnings. In California,<br />
households headed by Latin<br />
<strong>America</strong>n immigrants received, on<br />
average, almost $5,000 more in federal,<br />
state, and local services than<br />
they paid in taxes in 1996, largely<br />
because they had below-average<br />
incomes and thus paid lower taxes,<br />
while they had more children attending<br />
public schools than households<br />
headed by U.S.-born Californians. 55<br />
California households headed by<br />
U.S.-born people paid, on average,<br />
$2,700 more in federal taxes than they<br />
received in federal benefits in 1996,<br />
while immigrants had exactly the<br />
opposite fiscal balance: They received<br />
$2,700 more in federal benefits than<br />
they paid in federal taxes. The average<br />
native-born household paid<br />
$1,200 more in taxes to cover the<br />
deficit in California. Applying these<br />
state estimates to the total U.S. population,<br />
researchers calculated that the 89<br />
million households headed by U.S.-<br />
born people paid an extra $200 each<br />
in 1996 to cover the gap between taxes<br />
paid and services consumed by 9 million<br />
immigrant-headed households.<br />
The immigrant deficit amounted to<br />
$15 billion to $20 billion per year for<br />
the United States. 56<br />
Second, the NRC study confirmed<br />
the imbalance among the federal,<br />
state, and local government taxes<br />
paid by immigrants and the expenditures<br />
made for their benefit. The<br />
taxes immigrants pay are mostly<br />
income taxes withheld by the federal<br />
government. These revenues pay for<br />
social security and health care benefits<br />
for older residents. Immigrants<br />
often pay a small amount in state and<br />
local taxes because they have low<br />
earnings. The services immigrants<br />
consume, however, such as education<br />
for their children, are mostly paid for<br />
by state and local governments. These<br />
and similar findings have prompted<br />
many states to request a revenue-sharing<br />
arrangement with the federal<br />
government to deal with the fiscal<br />
impacts of immigrants.<br />
Fiscal studies are snapshots of taxes<br />
paid and the cost of services provided<br />
at a point in time. If immigrants’ earnings<br />
rise over time, so will their tax<br />
contributions, and the fiscal deficit<br />
may decrease. Similarly, the cost of<br />
providing education to immigrant children<br />
today could be regarded as an<br />
investment that will reward the country<br />
with higher-income workers tomorrow.<br />
The NRC analysis attempted to<br />
glean longer-term effects from these<br />
snapshots. The researchers projected<br />
future population, immigrant and<br />
native earnings, taxes, and use of government<br />
services. They also examined<br />
typical life-cycle trajectories for children<br />
who attend public schools, pay<br />
taxes during their working lives, and<br />
then rely on publicly supported health<br />
and social services after they retire.<br />
The NRC concluded that the longterm<br />
economic value of an immigrant<br />
depends strongly on his or her age<br />
at arrival and his or her years of education.<br />
On average, adult immigrants<br />
arriving with less than a high school<br />
education impose a net fiscal cost on<br />
the United States of $89,000 (in 1996<br />
dollars) over their lifetimes; those<br />
with only a high school education<br />
cost $31,000 over their lifetimes (see<br />
Figure 5, page 30). Adult immigrants<br />
with more than 12 years of schooling<br />
provided a $105,000 lifetime gain for<br />
the United States—the value of the<br />
taxes they paid exceeded the value of<br />
benefits received by this amount.<br />
Migration From<br />
Mexico and NAFTA<br />
About 30 percent of the immigrants<br />
living in the United States today are<br />
from Mexico, but there was relatively<br />
little movement across the border<br />
until the early 20th century. In 1800,<br />
Mexico and the United States had<br />
roughly equal population size, about<br />
6 million. In 1848, a large portion of<br />
northern Mexico was transferred to<br />
31
Figure 5<br />
The Long-Term Fiscal Impact of One Immigrant: 1996<br />
Amount in U.S. dollars (thousands)<br />
Not high<br />
school graduate<br />
32<br />
-$89<br />
Immigrant<br />
Descendents<br />
Total effect<br />
$76<br />
High school<br />
graduate<br />
-$13 -$30<br />
$82<br />
$51<br />
More than<br />
high school<br />
$105<br />
$93<br />
$198<br />
All immigrants<br />
-$3<br />
$83 $80<br />
Source: J.P. Smith and B. Edmonston, eds., The New <strong>America</strong>ns: Economic, Demographic,<br />
and Fiscal Effects of <strong>Immigration</strong> (1997): table 7-5.<br />
the United States by the Treaty of<br />
Guadalupe Hidalgo, which ended a<br />
war that began when <strong>America</strong>n settlers<br />
moved into Mexican territory and<br />
rebelled. The relatively few Mexican<br />
residents of what is now the southwestern<br />
United States became <strong>America</strong>ns,<br />
but there was little population growth<br />
until the early 20th century.<br />
A permanent migration stream<br />
between Mexico and the United<br />
States was created in 1917, when the<br />
U.S. government approved the first<br />
of two bracero programs that allowed<br />
recruitment of Mexicans to work in<br />
the United States, primarily on farms.<br />
Both bracero programs were strongly<br />
opposed by U.S. unions and church<br />
groups concerned about U.S. workers,<br />
but farmers justified the program<br />
by arguing that the world wars had<br />
created an emergency situation.<br />
During the second bracero program,<br />
which lasted from 1942 to 1964,<br />
between 1 million and 2 million Mexicans<br />
gained work experience in the<br />
United States. Millions of others<br />
came illegally but eventually gained<br />
legal status. Unauthorized Mexicans<br />
found inside the United States were<br />
taken to the border, issued work permits,<br />
and returned to the farms on<br />
which they were found.<br />
Under the 1942 agreement with<br />
Mexico, U.S. employers had to pay<br />
the cost of transporting braceros from<br />
their place of recruitment in Mexico<br />
to U.S. farms. Mexicans soon learned<br />
that they could improve their chances<br />
of being selected by moving close to<br />
the U.S. border. When the bracero program<br />
was stopped in 1964 as a way to<br />
improve wages and opportunities for<br />
Mexican <strong>America</strong>ns, there were hundreds<br />
of thousands of braceros and<br />
their families living in Mexican-U.S.<br />
border cities. To provide the workers<br />
with jobs, Mexico and the United<br />
States modified their trade laws to<br />
allow the creation of maquiladoras,<br />
factories in Mexico that import<br />
components, assemble them into finished<br />
goods such as televisions, and<br />
then re-export the products to the<br />
United States. The maquiladoras never<br />
provided many jobs for ex-bracero<br />
workers—virtually all braceros were<br />
men, and the maquiladoras hired<br />
mostly women—but the new factories<br />
drew even more Mexicans to the<br />
border area.<br />
There was relatively little illegal<br />
Mexico-U.S. migration during the<br />
1960s and early 1970s, which was<br />
one reason why activist Cesar Chavez<br />
and the United Farm Workers union<br />
could win contracts with California<br />
farmers for better wages and benefits<br />
for farm workers. The flow quickened<br />
after 1976 because of higher<br />
U.S. wages and a devaluation of the<br />
Mexican peso. By 1980, an estimated<br />
1 million undocumented Mexicans<br />
were living in the United States. 57<br />
The Mexican economic crash of<br />
1982 and the ensuing devaluation<br />
of the peso fueled more emigration.<br />
U.S. farmers and other employers<br />
turned to labor contractors to assemble<br />
crews of Mexican workers to harvest<br />
crops, clean buildings, and work<br />
in construction jobs for low wages.<br />
Employers who hired unauthorized<br />
workers faced few consequences,
although their workers were subject<br />
to arrest and deportation in INS<br />
raids.<br />
The rising number of unauthorized<br />
or illegal Mexican workers<br />
prompted Congress to enact the<br />
<strong>Immigration</strong> Reform and Control Act<br />
of 1986 (IRCA), which prescribed<br />
penalties on U.S. employers who<br />
knowingly hired unauthorized workers.<br />
It also legalized the presence of<br />
2.7 million unauthorized foreigners in<br />
the United States; 85 percent of the<br />
legalized workers were from Mexico.<br />
But IRCA did little to discourage<br />
illegal immigration. Enforcement was<br />
underfunded and ineffective, and<br />
fraudulent documents were widely<br />
used by workers. Migration networks<br />
between the United States and Mexico<br />
were strengthened by the legalization<br />
of workers and family members.<br />
In effect, the United States put up a<br />
“keep out” sign at the border, but<br />
unauthorized foreigners inside the<br />
United States were free to respond to<br />
“help wanted” signs.<br />
During the 1980s and 1990s, legal<br />
and illegal migration helped increase<br />
the number of Mexican-born U.S.<br />
residents from 2.2 million in 1980<br />
to 4.5 million in 1990, 9.0 million in<br />
2000, and almost 10 million in 2002.<br />
Mexico’s total population was 100<br />
million in 2000—meaning that the<br />
equivalent of 9 percent of the Mexican<br />
population had moved to the<br />
United States. Hundreds of thousands<br />
more Mexicans are on waiting<br />
lists for immigrant visas. There have<br />
been two responses to this emigration<br />
pressure: the North <strong>America</strong>n<br />
Free Trade Agreement (NAFTA) and<br />
stepped-up border controls.<br />
NAFTA is a trade and investment<br />
agreement between Canada, Mexico,<br />
and the United States that permanently<br />
lowered barriers to the flow of<br />
goods and money. It was designed to<br />
accelerate economic and job growth<br />
in all three countries, as the theory of<br />
comparative advantage predicts. 58<br />
Mexico proposed NAFTA as a way to<br />
solve the country’s debt crisis and<br />
restore economic and job growth.<br />
Mexico had borrowed heavily in the<br />
Photo removed for copyright reasons.<br />
The U.S. government has strengthened border patrols to curb illegal immigration<br />
and more recently to combat terrorism, yet immigrant smuggling<br />
continues to thrive.<br />
early 1980s in the expectation that the<br />
price for Mexican oil would remain<br />
high. When oil prices fell, Mexico suffered<br />
a recession and mounting debts.<br />
Many people in the United States<br />
opposed NAFTA, fearing a rush of<br />
U.S. jobs flowing to Mexico. With<br />
bipartisan support, Congress narrowly<br />
approved NAFTA. One of the hopedfor<br />
side effects was reduced Mexico-<br />
U.S. migration.<br />
After NAFTA went into effect on<br />
Jan. 1, 1994, some <strong>America</strong>ns thought<br />
that migration from Mexico would<br />
quickly stop. Instead, it continued,<br />
and included so-called banzai runs in<br />
which Mexican smugglers massed<br />
groups of 50 to 80 migrants on the<br />
Mexican side of the port of entry at<br />
San Diego and directed them to run<br />
across the border through the southbound<br />
lanes of traffic into the United<br />
States. California Governor Pete Wilson,<br />
who maintained that providing<br />
services to unauthorized foreigners<br />
accounted for 10 percent of state<br />
spending in the early 1990s, used<br />
footage of these banzai runs in TV ads<br />
to win re-election and build support<br />
for Proposition 187, the never-implemented<br />
state law meant to prevent<br />
unauthorized foreigners from obtaining<br />
state-funded services.<br />
33
Figure 6<br />
Mexico-U.S. Migration With and Without NAFTA<br />
Number of migrants<br />
34<br />
Without NAFTA<br />
With NAFTA<br />
1994 2000 2005 2010 2015<br />
In 1995, Mexico suffered its worstever<br />
recession, losing about 10 percent<br />
of formal-sector jobs. The United<br />
States provided financial assistance to<br />
stabilize the Mexican economy and, as<br />
President Bill Clinton said, “to better<br />
protect our borders.” Mexico recovered<br />
from the crisis, but wages are still<br />
below 1993 levels. During the late<br />
1990s, Mexico-U.S. migration continued—even<br />
accelerated—despite economic<br />
and job growth in Mexico. This<br />
continued migration gave rise to the<br />
theory that “cumulative causation”<br />
had established such strong networks<br />
linking Mexican villagers and U.S.<br />
jobs that neither U.S. border controls<br />
nor sanctions on U.S. employers who<br />
hired illegal workers would stop<br />
migrants. 59 Cumulative causation<br />
explains how a migration flow, once<br />
set in motion, can assume a life of its<br />
own, much as a snowball rolling down<br />
a hill gathers speed and size, so that<br />
migration can beget more migration if<br />
underlying demand and supply factors<br />
do not change.<br />
In 1990, the U.S. Commission for<br />
the Study of International Migration<br />
and Cooperative Economic Development<br />
explained how freer trade and<br />
economic integration was the best<br />
long-term way to unwanted migration:<br />
“Expanded trade between the sending<br />
countries and the United States is<br />
the single most important remedy”<br />
for such migration. 60 But the Commission<br />
also warned that the same<br />
policies that accelerate economic and<br />
job growth in Mexico may also temporarily<br />
increase Mexico-U.S. migration.<br />
That increase came to be known<br />
as the “migration hump,” as shown in<br />
Figure 6.<br />
The Mexico-U.S. migration hump<br />
was anticipated by those familiar with<br />
Mexican and U.S. agriculture. 61 About<br />
35 percent of Mexicans lived in rural<br />
areas and were dependent on agriculture<br />
for most of their earnings in the<br />
early 1990s; such farmers received subsidized<br />
water and other inputs and<br />
could sell their corn to the government<br />
for about twice the world price.<br />
Since Iowa produces about twice as<br />
much corn as Mexico at about half<br />
the price, NAFTA was expected to displace<br />
millions of Mexican corn farmers,<br />
who were expected to switch to<br />
growing tomatoes and other laborintensive<br />
crops for export to the<br />
United States. But growing fruits and<br />
vegetables requires capital, skills, and<br />
access to markets that most independent<br />
Mexican farmers did not have.<br />
Instead of expanding in Mexico,<br />
labor-intensive agriculture expanded<br />
in California and elsewhere in the<br />
United States in the 1990s, creating a<br />
demand for Mexican workers north<br />
of the border.<br />
North <strong>America</strong>n agricultural integration<br />
produced a migration hump<br />
in the 1990s, but Mexico-U.S. migration<br />
should eventually fall as Mexico<br />
expands its exports, especially as<br />
Mexican farmers produce more<br />
labor-intensive crops. Mexico’s production<br />
of labor-intensive products<br />
might increase faster if the United<br />
States enforced laws that prevent U.S.<br />
employers from hiring unauthorized<br />
Mexican workers. And just as Mexican<br />
workers can produce food in<br />
Mexico for export to the United<br />
States, they can pack meat, process<br />
poultry, make shoes, and sew clothes<br />
for export rather than moving to the<br />
United States to do these things.<br />
Guacamole, for example, is increasingly<br />
made in Mexico and exported,<br />
rather than made in restaurant<br />
kitchens in the United States.
Mexico-U.S. migration is now at<br />
a crossroads. For most of the 20th<br />
century, Mexico and the United<br />
States were “distant neighbors” whose<br />
major economic link was the migration<br />
of rural Mexicans to rural <strong>America</strong>.<br />
Mexico-U.S. relations changed in<br />
the mid-1980s, when Mexico sought<br />
to emulate the East Asian miracle<br />
economies by fostering export-oriented<br />
growth. During the 1990s, economic<br />
integration symbolized by<br />
NAFTA accelerated as Mexico-U.S.<br />
migration increased. Mexico experienced<br />
political as well as economic<br />
change, and in 2000 elected its first<br />
president from an opposition party<br />
in 70 years, Vicente Fox. Fox made<br />
improving conditions for Mexican<br />
migrants in the United States his<br />
government’s top foreign priority.<br />
President George W. Bush was sympathetic,<br />
and, during the summer of<br />
2001, Mexico pushed hard for what it<br />
called a “whole enchilada” migration<br />
package—legalizing unauthorized<br />
Mexicans in the United States, a new<br />
guest-worker program, ending deaths<br />
and violence along the border, and<br />
exempting Mexicans from U.S. immigrant<br />
visa ceilings.<br />
Just before the terrorist attacks of<br />
Sept. 11, 2001, Presidents Bush and<br />
Fox met in Washington, D.C., where<br />
Bush said, “Our desire is to make it easier<br />
for an employer looking for somebody<br />
who wants to work and somebody<br />
who wants to work to come together,<br />
but that in itself is a complex process.”<br />
Fox responded, “We must, and we can,<br />
reach an agreement on migration before<br />
the end of this very year [2001].” 62<br />
After the terrorist attacks, however,<br />
U.S. attention shifted to security<br />
against terrorism and the priority of<br />
Mexico-U.S. migration receded. 63<br />
Naturalization and<br />
Politics<br />
At its founding, the United States<br />
established two important principles:<br />
All persons in the United States are<br />
to have full and equal rights, and all<br />
persons born in the United States are<br />
automatically citizens of the United<br />
States. The United States is still striving<br />
to undo the effects of the major<br />
exception to these rules: slavery.<br />
These efforts have included antidiscrimination<br />
measures and preferences<br />
for minorities that apply to<br />
immigrants as well as the descendants<br />
of slaves.<br />
U.S. laws have always made few distinctions<br />
between citizens and noncitizens<br />
who are legal residents. Legal<br />
immigrants have been able to live<br />
where they please, seek any job<br />
(except for federal government jobs),<br />
and buy a house, land, or business<br />
without restriction. The basic constitutional<br />
rights, including the right of<br />
free speech and the free exercise of<br />
religion, are extended to both legal<br />
and unauthorized immigrants. Citizens<br />
of other countries cannot vote in public<br />
elections, but they can vote and<br />
hold office in U.S. labor unions and in<br />
private organizations such as churches,<br />
foundations, and fraternal groups.<br />
To become a naturalized citizen,<br />
an immigrant must be at least 18 years<br />
old, have been legally resident at least<br />
five years (three years for spouses of<br />
U.S. citizens), and pass a test of English<br />
and civics. Typical questions asked<br />
on these tests include “Where is the<br />
White House located?” and “Name<br />
one right guaranteed by the First<br />
Amendment.” Citizenship requirements<br />
are less stringent than in most<br />
Western European counties, but more<br />
stringent than in Australia, Canada,<br />
and New Zealand.<br />
In the past, fewer than half of the<br />
immigrants to the United States<br />
became naturalized citizens,<br />
although the proportions vary substantially<br />
by country of origin. Most<br />
of the immigrants admitted between<br />
1980 and 1989 were eligible to naturalize<br />
by 1994; by 2002, about 45<br />
percent were citizens (see Figure 7,<br />
page 34). Nearly two-thirds of immigrants<br />
from Asia and just over onehalf<br />
of immigrants from Europe had<br />
become citizens. Only one-third of<br />
Latin <strong>America</strong>n immigrants had<br />
become citizens by 2002.<br />
35
Figure 7<br />
Foreign-Born Entering Between 1980 and 1989 Who<br />
Became U.S. Citizens by 2002, by Region of Birth<br />
36<br />
Total<br />
Asia<br />
Europe<br />
Africa and other<br />
Latin <strong>America</strong><br />
Percent<br />
33.3<br />
45.0<br />
46.2<br />
51.8<br />
65.1<br />
Source: U.S. Census <strong>Bureau</strong>, Foreign-Born <strong>Population</strong> of the United States Current <strong>Population</strong> Survey—March<br />
2002, Detailed Tables PPL-162 (www.census.gov/population/www/socdemo/foreign/ppl-162.html,<br />
accessed March 11, 2003): table 2.6.<br />
Mexicans, like Canadians, have had<br />
low rates of naturalization, probably<br />
because many maintain close ties with<br />
and expect to return to their home<br />
countries. Before 1996 changes in<br />
Mexican law, Mexicans who became<br />
naturalized U.S. citizens were denied<br />
certain rights granted only to Mexican<br />
citizens, such as the right to own and<br />
inherit land in Mexico.<br />
In general, the probability that an<br />
immigrant in the United States will<br />
naturalize increases with age, education,<br />
income, and English-language<br />
ability. The fact that Mexican immigrants<br />
are younger, poorer, and less<br />
likely to speak English than are immigrants<br />
from some other countries also<br />
helps explain why relatively few Mexicans<br />
naturalize.<br />
In 1996, naturalization became a<br />
major political issue. Vice President Al<br />
Gore launched the “Citizenship USA”<br />
drive in April 1995 with the goal of<br />
eliminating the backlog of 600,000<br />
immigrants who had applied for naturalization.<br />
Some of these applicants<br />
had been waiting for two years for their<br />
applications to be processed. Under<br />
Citizenship USA, new applicants were<br />
promised naturalization within six<br />
months. 64 Republicans accused the<br />
Clinton administration of expediting<br />
naturalization in order to add Democratic<br />
voters before the next election.<br />
Citizenship USA accelerated the<br />
naturalization process, producing a<br />
record 1 million naturalizations in<br />
FY1996, but not all the foreigners<br />
who naturalized had had the required<br />
FBI fingerprint checks to ascertain<br />
that they had not committed a crime<br />
in the United States. The INS tightened<br />
its procedures to ensure that all<br />
applicants were screened for criminal<br />
records, which lengthened the wait<br />
between application and naturalization.<br />
The number of immigrants<br />
electing to naturalize fell to about<br />
600,000 a year in FY2001 and FY2002.<br />
The mid-1990s surge in naturalizations<br />
has several causes, including:<br />
■ Rising levels of immigration in the<br />
1980s. Many of the 2.7 million<br />
unauthorized foreigners who were<br />
legalized in 1987 and 1988 became<br />
eligible to naturalize in 1995.<br />
■ The INS’ Green Card Replacement<br />
Program, launched in 1993. Legal<br />
immigrants had to obtain new<br />
counterfeit-resistant immigration<br />
visas. For a few dollars more, they<br />
could also naturalize if they met<br />
the other requirements.<br />
■ The 1996 laws that made many<br />
noncitizens ineligible for welfare<br />
benefits. Some immigrants naturalized<br />
to preserve their access to<br />
benefits.<br />
■ Citizenship USA, which streamlined<br />
the naturalization process<br />
and encouraged immigrants to<br />
become citizens.<br />
■<br />
Widening approval of dual citizenship.<br />
Many immigrant countries of<br />
origin permitted some version of<br />
dual nationality, so that immigrants<br />
who became U.S. citizens would<br />
not lose citizenship and rights in<br />
their countries of origin.<br />
Many analysts expect naturalized<br />
immigrants to affect voting patterns.<br />
This has not yet happened on a<br />
national scale. Non-Hispanic whites<br />
cast 81 percent of the votes in the<br />
2000 election, and a higher percentage<br />
of votes in 2002, when turnout<br />
was down. In 2000, the 35 million<br />
U.S. Hispanics included 13 million<br />
adult U.S. citizens, 6 million of whom<br />
voted, accounting for about 5 per-
cent of U.S. votes cast. Latinos cast<br />
about 14 percent of the vote in California<br />
in 1998 and 2000, but only 10<br />
percent of the vote in 2002.<br />
It may be decades before rising<br />
numbers of naturalized Latino and<br />
Asian voters significantly affect<br />
national elections, although they<br />
already make a difference in local<br />
elections. 65 Latinos are still a small<br />
part of the electorate and vote in<br />
much lower numbers than average.<br />
Education and age continue to be<br />
more reliable predictors of whether<br />
and how citizens will vote than<br />
whether they are U.S.-born or foreignborn.<br />
Numerous studies show that citizens<br />
with more education are more<br />
likely to vote and that, regardless of<br />
education, young people are less likely<br />
to vote than are older people. Immigrants<br />
tend to have many of the characteristics<br />
associated with a low voter<br />
turnout: They have a young age profile<br />
and below-average incomes and<br />
education, and they are less likely to<br />
own homes and more likely to belong<br />
to racial or ethnic minorities. Even<br />
after accounting for these factors,<br />
however, naturalized citizens are less<br />
likely than U.S.-born citizens to register<br />
and vote.<br />
Immigrants in<br />
<strong>America</strong>n Society<br />
During the 19th and early 20th centuries,<br />
the leading metaphor for the<br />
incorporation of newcomers to <strong>America</strong><br />
was a fusion of peoples in a “smelting<br />
pot” (Ralph Waldo Emerson),<br />
“cauldron” (Henry James), or “crucible”<br />
in which, historian Frederick<br />
Jackson Turner noted, “immigrants<br />
were <strong>America</strong>nized, liberated, and<br />
fused into a mixed race, English in<br />
neither nationality nor characteristics.”<br />
66 The hero of Israel Zangwill’s<br />
popular play of 1908, “The Melting<br />
Pot,” echoed this sentiment when he<br />
cried out, “Germans and Frenchmen,<br />
Irishmen and Englishmen, Jews and<br />
Russians—into the Crucible with you<br />
all! God is making the <strong>America</strong>n!”<br />
Reality was more complex. There is<br />
always a tension between the newcomers’<br />
desires to keep alive the culture<br />
and language of the community they<br />
left behind, and their need and wish<br />
to adapt to new surroundings and a<br />
different society. The balance between<br />
these competing forces changed over<br />
time, but three principles have guided<br />
what is now called integration:<br />
■ <strong>America</strong> was to be open to all<br />
kinds of immigrants. As George<br />
Washington said, “The bosom of<br />
<strong>America</strong> is open to receive not<br />
only the Opulent and respectable<br />
Stranger, but the oppressed and<br />
persecuted of all Nations and Religions;<br />
whom we shall welcome to a<br />
participation of all our rights and<br />
privileges.” 67<br />
■ No ethnic group should establish a<br />
formally recognized political identity.<br />
Nothing bars the formation of<br />
a Mexican <strong>America</strong>n political<br />
party, but the two-party tradition<br />
and the belief that <strong>America</strong>n citizens<br />
act politically as individuals,<br />
not as members of officially<br />
defined ethnic groups, has discouraged<br />
such political parties.<br />
■<br />
No ethnic or national origin group<br />
would be required to give up its<br />
character and distinctive qualities.<br />
Each immigrant group was free to<br />
maintain what it could of its cultural<br />
heritage and institutions.<br />
At no time in <strong>America</strong>n history<br />
has the process of integration been<br />
easy or trouble-free (see Box 4, page<br />
36). The open hostility that was<br />
expressed toward certain racial and<br />
ethnic groups in the past is surprising<br />
by today’s standards. After publicly<br />
criticizing President Herbert Hoover,<br />
for example, New York Congressman<br />
Fiorella La Guardia received a letter<br />
in 1930 saying that “the Italians are<br />
predominantly our murderers and<br />
bootleggers,” and inviting La Guardia<br />
and his Italian-<strong>America</strong>n supporters to<br />
“go back to where you belong”<br />
because “like a lot of other foreign<br />
spawn, you do not appreciate this<br />
country which supports you and tolerates<br />
you.” 68 Today, Chinese-<strong>America</strong>n<br />
Gary Locke, who was elected gover-<br />
Latino and<br />
Asian immigrants<br />
affect local, but<br />
not national,<br />
elections.<br />
37
nor of Washington in 1996, is less<br />
likely to receive to such public abuse.<br />
Governor Locke, like La Guardia, is<br />
the son of immigrants.<br />
Integration can be regarded as a<br />
glass half full or half empty. The<br />
Changing Relations study, which<br />
investigated immigrant communities<br />
in six cities in the 1980s, found<br />
that—despite segregation in jobs and<br />
housing and the lack of a common<br />
language—newcomers and natives in<br />
a number of U.S. cities were cooperating<br />
to achieve local goals, such as<br />
38<br />
Box 4<br />
‘Melting Pot’ vs. ‘Salad Bowl,’ or Integration vs. Pluralism<br />
Integration and pluralism are two prescriptions<br />
for the accommodation of<br />
immigrants in <strong>America</strong>n society put forward<br />
over the last century that reflect<br />
the immigrants’ dilemma and still characterize<br />
the two sides in the ongoing<br />
debate about the accommodation of<br />
immigrants.<br />
The integrationist (assimilationist)<br />
aims to eliminate ethnic boundaries<br />
while the pluralist (multiculturalist)<br />
aims to maintain them. For integrationists,<br />
<strong>America</strong>n democracy is composed<br />
of equal individuals, symbolized<br />
by the “melting pot” metaphor. For pluralists,<br />
<strong>America</strong>n society is an equality of<br />
groups much like a salad with distinct<br />
ingredients. For the integrationist, what<br />
counts is what the citizen thinks and<br />
believes; the pluralist wants to preserve<br />
the citizen’s awareness of where he or<br />
she came from.<br />
Taken to their logical extremes, both<br />
positions are absurd, and neither has<br />
been realized in the United States. The<br />
melting pot ignores the persistence of<br />
memory and the importance of the<br />
home culture. An exclusive emphasis<br />
on integration overlooks the fact that<br />
ethnic affiliation persists among many<br />
<strong>America</strong>ns after the second and third<br />
generations, long after the language<br />
and knowledge of the “old country”<br />
has been lost.<br />
The pluralists’ insistence on group<br />
identity, on the other hand, limits the<br />
freedom of individuals to choose their<br />
loyalties for themselves. It assumes that<br />
ethnic boundaries remain fixed and<br />
overlooks the divisions within ethnic<br />
groups. It also ignores the evidence<br />
that in an open, heterogeneous society<br />
like that of the United States, people<br />
work, make friends, and marry outside<br />
their ancestral communities.<br />
The integration versus pluralism<br />
debate is played out in many venues:<br />
In college dorms, should students be<br />
placed with others of the same race or<br />
ethnicity, or should they be mixed with<br />
students from unfamiliar backgrounds?<br />
Should school children be grouped for<br />
instruction according to their home<br />
languages, or should they be brought<br />
together in English-language classes<br />
from the start? How much instruction<br />
in public schools should be carried on<br />
in languages other than English? In<br />
the workplace, may employees converse<br />
among themselves in languages<br />
other than English?<br />
In 1984, historian John Higham<br />
proposed a system of “pluralistic integration.”<br />
Pluralistic integration asserts<br />
that there is a common U.S. culture to<br />
which all individuals have access, but it<br />
also supports the efforts of minorities<br />
to preserve and enhance their own cultural<br />
integrity. In practice, this means<br />
that public funds should not be used<br />
to promote differences between racial<br />
and ethnic groups: “No ethnic group<br />
under these terms may have the support<br />
of the general community in<br />
strengthening its boundaries, [but]<br />
ethnic nuclei are respected as enduring<br />
centers of social action.” 1 Another<br />
scholar of immigration, Lawrence<br />
Fuchs, used the term “kaleidoscope” to<br />
emphasize the dynamics of change:<br />
Immigrants adapt and change, and so<br />
does <strong>America</strong>n society. 2<br />
<strong>Reference</strong>s<br />
1. John Higham, Send These to Me: Immigrants<br />
in Urban <strong>America</strong> (Baltimore: Johns Hopkins<br />
University Press, 1984): 244. See also<br />
“Multiculturalism and Universalism: A History<br />
and Critique,” <strong>America</strong>n Quarterly 45,<br />
no. 2 (1993): 195-219.<br />
2. Lawrence H. Fuchs, The <strong>America</strong>n Kaleidoscope:<br />
Race, Ethnicity, and the Civic Culture<br />
(Middletown, CT: Wesleyan University<br />
Press, 1991).
obtaining government benefits or<br />
improving their neighborhoods. 69<br />
The report also noted that, in cities<br />
with large immigrant populations,<br />
immigrants were not integrating<br />
into the broader community. Economic<br />
restructuring had created<br />
fears in many communities that<br />
immigrants threatened the jobs of<br />
longer-term residents. Integrating<br />
immigrants is likely to be different in<br />
the early 21st century than it was in<br />
the early 20th century. In the early<br />
1900s, many U.S.-born <strong>America</strong>ns<br />
first interacted with immigrants when<br />
the U.S.-born left their farms for jobs<br />
in the cities, where both they and the<br />
immigrants were newcomers. 70 Now,<br />
immigrants, are moving into and<br />
sometimes transforming established<br />
communities.<br />
In 1997, the U.S. Commission on<br />
<strong>Immigration</strong> Reform (CIR) recommended<br />
that the federal government<br />
do more to “<strong>America</strong>nize immigrants”<br />
to help them integrate into U.S. society.<br />
The CIR emphasized that <strong>America</strong>nization<br />
is a two-way street. The<br />
United States expects immigrants to<br />
“obey our laws, pay our taxes, respect<br />
other cultures and ethnic groups. At<br />
the same time, [we] also incur obligations<br />
to provide an environment in<br />
which newcomers can become fully<br />
participating members of our society.”<br />
The CIR recommended that federal<br />
grants be given to communities with<br />
large numbers of immigrants to create<br />
resource centers in which immigrants<br />
and the native-born could interact.<br />
The CIR also urged U.S. businesses to<br />
do more to help integrate immigrants:<br />
“Those business groups in particular<br />
who lobby for high levels of immigration<br />
must make a far greater effort not<br />
only to support immigration, but also<br />
to support immigrants, through English<br />
classes, naturalization and civic<br />
education.” 71<br />
Language and Education<br />
The 2000 U.S. Census reported that<br />
47 million residents older than age 5<br />
spoke a language other than English at<br />
home, 15 million more than in 1990.<br />
Table 4<br />
Language Spoken at Home,<br />
2000<br />
Language spoken <strong>Population</strong> age 5<br />
at home<br />
or older (thousands)<br />
Total 262,375<br />
Speak only English 215,424<br />
Speak a language other than English 46,952<br />
Spanish or Spanish Creole 28,101<br />
Chinese 2,022<br />
French (incl. Patois, Cajun) 1,644<br />
German 1,383<br />
Tagalog 1,224<br />
Vietnamese 1,010<br />
Italian 1,008<br />
Korean 894<br />
Source: U.S. Census <strong>Bureau</strong>, Summary Tables on<br />
Language Use and English Ability: 2000, PHC-T-20<br />
(Feb. 23, 2003): table 5.<br />
Spanish was the most common non-<br />
English language, spoken by 28.1 million,<br />
while 2.0 million spoke Chinese,<br />
1.6 million spoke French, 1.4 million<br />
spoke German, 1.2 million spoke Tagalog,<br />
and 1.0 million each spoke Italian<br />
and Vietnamese (see Table 4).<br />
In the United States, the shift from<br />
speaking another language to speaking<br />
English has usually occurred over<br />
three generations. Adult immigrants<br />
commonly did not learn English well.<br />
Their children were usually bilingual,<br />
using their parents’ language at home<br />
and English at school. English often<br />
became dominant as the children of<br />
immigrants entered the workplace.<br />
The grandchildren of immigrants—<br />
the third generation—typically speak<br />
only English. 72<br />
The shift to English may be accelerating<br />
among recent immigrants and<br />
may occur within just two generations.<br />
73 Most immigrants settle in U.S.<br />
cities, where they are more likely to be<br />
exposed to English than were workers<br />
in farms and factories earlier in the<br />
century. A recent study found that the<br />
children of immigrants in Miami, for<br />
example, preferred English for their<br />
everyday communication. 74 Another<br />
survey found that even though most<br />
Mexican-born U.S. residents spoke<br />
Spanish at home, almost two-thirds of<br />
39
40<br />
Photo removed for copyright reasons.<br />
Learning English can help immigrants<br />
improve their wages and job prospects,<br />
although many foreigners find it difficult<br />
to take classes while holding full-time jobs.<br />
U.S.-born people of Mexican ancestry<br />
used English at home. 75<br />
Immigrants and their children<br />
would benefit from acquiring English<br />
language ability even more rapidly.<br />
Poor English skills are associated with<br />
lower earnings in a high-tech society.<br />
Earlier immigrants could farm or work<br />
in factories or build railroads without<br />
speaking English. But in today’s service-dominated<br />
economy, the ability to<br />
speak English is required for nearly all<br />
but the lowest-paying jobs. One study<br />
found that among immigrant men<br />
who did not speak English at home,<br />
those who were not fluent in English<br />
earned only about half as much as<br />
those who were. 76 Another study concluded<br />
that those in the United States<br />
“who speak English ‘well’ or ‘very well’<br />
have 17 percent higher earnings than<br />
those with less fluency.” 77<br />
Most immigrants want to learn<br />
English. A survey of residents of Mexican,<br />
Cuban, and Puerto Rican origins<br />
found that more than 90 percent<br />
agreed that all U.S. citizens and residents<br />
should learn English. 78 But<br />
acquiring a new language is a difficult<br />
undertaking for adults, particularly<br />
those who work long hours. There are<br />
frequently long waiting lists for English<br />
classes for adults. There is no federally<br />
financed program to teach English<br />
to adult speakers of other<br />
languages, although states use federal<br />
adult education grants along with<br />
their own funds to provide English<br />
instruction.<br />
Public Education<br />
Lack of English language skills is also<br />
a major issue for the nation’s schools.<br />
Students who have difficulty understanding<br />
an all-English curriculum are<br />
often referred to as limited-English<br />
proficient (LEP), a term whose definition<br />
varies from state to state and<br />
between federal agencies. These<br />
students are referred to as Englishlanguage<br />
learners.<br />
In the 2000-2001 school year, there<br />
were 3.4 million students in primary<br />
and secondary schools receiving LEP<br />
services, including 1.5 million in California<br />
and 570,000 in Texas. 79 There<br />
are two major approaches to teaching<br />
English to students fluent in another<br />
language: English-as-a-second-language<br />
(ESL) instruction for rapid<br />
acquisition of English, and bilingual<br />
education, which includes instruction<br />
in a limited-English student’s native<br />
language. Each approach has its own<br />
philosophy and assumptions about<br />
what is appropriate for students with<br />
different linguistic backgrounds. With<br />
the ESL approach, children of various<br />
language backgrounds receive instruction<br />
in English for all subjects, but<br />
the English is modified by specially<br />
trained teachers so English-learners<br />
can more easily understand it. Teachers<br />
provide an appropriate context<br />
for the students to help them with the<br />
new language.<br />
With bilingual education, children<br />
are taught to read and write in their<br />
home languages before shifting their<br />
language of instruction gradually to<br />
English. Older children who are new<br />
to English are taught such core subjects<br />
as math, science, and history in<br />
their home languages while they are<br />
learning English. The aim of bilingual<br />
education is to ensure that limited-<br />
English students are taught material
with the same intellectual content as<br />
other students while these students<br />
gain competence in English.<br />
Educators do not agree on which<br />
method is best. A report on limited-<br />
English students by the NRC concluded<br />
that the most successful school<br />
programs have three similar characteristics:<br />
some native language instruction<br />
initially for most students; relatively<br />
early phasing-in of English instruction;<br />
and teachers specially trained in instructing<br />
English-language learners. 80<br />
These three characteristics are lacking<br />
in many school programs. Schools<br />
with bilingual programs—most are<br />
Spanish—may continue instruction in<br />
a non-English language for as long as<br />
seven years. In other schools, limited-<br />
English children are taught in English<br />
by teachers who have had no special<br />
training in teaching children in a language<br />
that is not their own.<br />
Most non-English-speaking students<br />
come from disadvantaged socioeconomic<br />
backgrounds, which presents<br />
other handicaps for excelling in<br />
school. The NRC report found that<br />
77 percent of English-language learners<br />
in a sample of schools were eligible<br />
for free or reduced-price lunches,<br />
compared with 38 percent of all students<br />
in the sample.<br />
The debate about bilingual education<br />
is especially vociferous in California,<br />
which has about 45 percent of the<br />
nation’s limited-English school children.<br />
In June 1998, California voters<br />
approved Proposition 227, the English<br />
for the Children initiative, 61 percent<br />
to 39 percent, ending bilingual education<br />
and requiring most non-Englishspeaking<br />
children to be placed in<br />
special English classes for one year and<br />
then shifted to regular classes. Since<br />
then, students in English immersion<br />
classes have scored higher on math<br />
and reading than students in bilingual<br />
programs. In 2002, 32 percent of the<br />
LEP students in the immersion program<br />
passed the California English<br />
proficiency test, compared with just 9<br />
percent the previous year. Students in<br />
bilingual programs showed less dramatic<br />
improvement, from 3 percent to<br />
16 percent. 81 Arizona and Massachusetts<br />
also ended bilingual education by<br />
voter initiative, but Colorado voted to<br />
continue teaching LEP children in<br />
their native language. 82<br />
The debate about bilingual education<br />
involves much broader issues<br />
than the best way to teach non-English-speaking<br />
children. One issue is<br />
whether newcomers should quickly<br />
be integrated into mainstream <strong>America</strong>,<br />
or whether newcomers should be<br />
encouraged to retain their distinctive<br />
cultural attributes and their native<br />
languages—and whether the public<br />
schools should help immigrants maintain<br />
their language and culture. If<br />
schools give priority to English-language<br />
learning, does that show concern<br />
for immigrants’ future success in<br />
the United States, or is it “Anglo cultural<br />
imperialism”? Is bilingual education<br />
a form of minority patronage<br />
that creates public employment for<br />
members of particular ethnic groups?<br />
Should U.S. immigration policy be<br />
changed to favor people who already<br />
know English, as it does in Australia<br />
and New Zealand?<br />
Strong feelings about the role of<br />
English often overwhelm educational<br />
considerations in the debate over bilingual<br />
education. Should the United<br />
States establish English as its official<br />
language? Would a prohibition against<br />
the government’s use of other languages<br />
be a beneficial affirmation that<br />
English is the common language of<br />
the United States, or would establishing<br />
English as the official language be<br />
a rebuff to speakers of other languages<br />
and a handicap to the work of government?<br />
Such questions involve the public<br />
education system in much broader<br />
issues and feelings about immigrants,<br />
integration, and national character.<br />
An Unfinished<br />
Nation<br />
Past immigration flows to the United<br />
States resemble waves, with the number<br />
of immigrants increasing to peak<br />
levels and then falling into troughs.<br />
The fourth wave of U.S. immigration,<br />
Englishimmersion<br />
programs<br />
have helped<br />
immigrant<br />
children<br />
academically.<br />
41
which began in 1965, has been climbing<br />
since the early 1980s. Now, in the<br />
early 21st century, 1 million immigrants<br />
a year are being admitted, with<br />
no end in sight. Many <strong>America</strong>ns want<br />
the federal government to take steps<br />
to reduce immigration. If the flow<br />
were reduced, the current period<br />
would be the peak of the fourth wave.<br />
Other <strong>America</strong>ns are comfortable with<br />
current levels of immigration, so the<br />
fourth wave might continue.<br />
The United States is a nation of<br />
immigrants that first welcomed all<br />
newcomers, later excluded certain<br />
types, and since the 1920s has limited<br />
the number of immigrants with an<br />
annual ceiling. Immigrants and<br />
refugees continue to arrive through<br />
<strong>America</strong>’s front door, which was<br />
opened wider in 1990 to accommodate<br />
more relatives of U.S. residents<br />
and more workers desired by U.S.<br />
employers. But the fastest growth in<br />
entries in the 1990s was through side<br />
and back doors, as nonimmigrant<br />
tourists, foreign workers and students,<br />
and unauthorized foreigners arrived<br />
in larger numbers.<br />
Research on the economic, social,<br />
and political effects of immigration<br />
does not provide clear guidelines<br />
for policy. Overall, immigrants have<br />
minor effects—for better or worse—on<br />
the huge <strong>America</strong>n economy and<br />
labor market. Most immigrants are better<br />
off financially in <strong>America</strong> than they<br />
were at home, but many arrive with<br />
minimal education and skills and find<br />
it hard to advance to better jobs in the<br />
<strong>America</strong>n labor market. State and local<br />
governments, meanwhile, point out<br />
that the taxes paid by immigrants go<br />
mostly to the federal government,<br />
while state and local governments bear<br />
the brunt of the costs of providing<br />
services to the immigrants.<br />
Most immigrants to the United<br />
States do not become naturalized citizens.<br />
Instead, they live as permanent<br />
residents and keep their original<br />
nationality. Laws enacted in 1996<br />
made noncitizens ineligible for some<br />
welfare benefits, which prompted a<br />
record 1 million foreigners to naturalize.<br />
The U.S. constitution makes U.S.-<br />
born children of immigrants citizens<br />
at birth, whether their parents are<br />
naturalized citizens, legal immigrants,<br />
or illegal immigrants.<br />
U.S. immigrants are often isolated<br />
from native-born <strong>America</strong>ns, as they<br />
were in previous periods of mass<br />
immigration. Their isolation is reinforced<br />
by housing and job segregation<br />
and language barriers. There are<br />
many examples of cooperation<br />
between natives and immigrants, however,<br />
as well as signs that immigrant<br />
children may be acquiring English<br />
faster than did previous immigrants.<br />
For the foreseeable future, <strong>America</strong><br />
seems likely to remain the world’s<br />
major destination for immigrants.<br />
Our history and traditions suggest<br />
that, within a few decades, most of<br />
today’s immigrants will be an integral<br />
part of the ever-changing <strong>America</strong>n<br />
community. But past success does not<br />
guarantee that history will repeat<br />
itself. There are concerns about the<br />
size and nature of today’s immigrant<br />
population. As the nation searches for<br />
an immigration policy for the 21st<br />
century, the United States, and the<br />
immigrants on their way here, are on<br />
a journey to an uncertain destination.<br />
42
<strong>Reference</strong>s<br />
1. This number excludes Canadians and Mexicans entering for short stays; their entries are<br />
not recorded, but it is estimated that there are almost 800,000 such admissions each day.<br />
2. A Wall Street Journal editorial on July 3, 1986, first made this proposal, which was repeated<br />
in an editorial on July 3, 1990. A post-Sept. 11 editorial supported a similar sentiment: “So<br />
Atta Got His Visa. That’s No Reason to Kick Out Mexican Workers,” The Wall Street Journal,<br />
March 18, 2002.<br />
3. Nicholas Capaldi, ed., <strong>Immigration</strong>: Debating the Issues (Amherst, NY: Prometheus Books,<br />
1997): 17; and Cardinal Angelo Sodano, “Letter of Cardinal Angelo Sodano to the 32nd<br />
Ordinary Assembly of the Organization of <strong>America</strong>n States,” (2002), accessed online at<br />
www.vatican.va/roman_curia/secretariat_state/documents/<br />
rc_seg-st_doc_20020604_sodano-osa_en.html, on April 23, 2003.<br />
4. U.S. Department of State, “Visa Bulletin,” accessed online at http://travel.state.gov/<br />
visa_bulletin.html, on March 26, 2003.<br />
5. <strong>Immigration</strong> and Naturalization Service (INS), 2000 Statistical Yearbook of the <strong>Immigration</strong><br />
and Naturalization Service (Washington, DC: U.S. Government Printing Office, 2002): 29-31.<br />
6. Tom Jackman, “Lawyer Convicted of Bilking Immigrants,” The Washington Post, Dec. 12,<br />
2002.<br />
7. INS, 2001 Statistical Yearbook of the <strong>Immigration</strong> and Naturalization Service (Washington, DC:<br />
U.S. Government Printing Office, 2003).<br />
8. INS, 2000 Statistical Yearbook of the <strong>Immigration</strong> and Naturalization Service: 269.<br />
9. INS, “Report on H-1B Petitions, Third Quarter Fiscal Year 2001,” accessed online at<br />
www.immigration.gov/graphics/shared/services/employerinfo/H1B_3rdQFY01Rpt.pdf, on<br />
April 23, 2003.<br />
10. U.S. Department of Labor, The Department of Labor’s Foreign Labor Certification Programs: The<br />
System Is Broken and Needs to Be Fixed (May 1996), accessed online at www.oig.dol.gov/<br />
public/reports/oa/pre_1998/06-96-002-03-321.pdf, on March 21, 2003.<br />
11. Institute of International Education, Open Doors 2002, accessed online at<br />
http://opendoors.iienetwork.org, on March 24, 2003.<br />
12. Wayne A. Cornelius, “Death at the Border: The Efficacy and ‘Unintended’ Consequences<br />
of U.S. <strong>Immigration</strong> Control Policy,” <strong>Population</strong> and Development Review 27, no. 4 (2001):<br />
661-85.<br />
13. In 1953, for the only time in the past 70 years, more than 10 percent of the public favored<br />
increasing immigration. Julian Simon, The Economic Consequences of <strong>Immigration</strong> (New York:<br />
Blackwell, 1989): 350.<br />
14. Susan Page, “Fear of <strong>Immigration</strong> Eases,” USA Today Online Edition, Oct. 13, 1997.<br />
15. Mark Baldassare, “PPIC Statewide Survey: January 1999,” accessed online at<br />
www.ppic.org/content/pubs/S_199MBS.pdf, on March 27, 2003.<br />
16. Gary Martin, “White House Proposes Splitting of INS Duties,” San Antonio Express-News,<br />
Nov. 15, 2001; and Federation for <strong>America</strong>n <strong>Immigration</strong> Reform, “Issue Brief: <strong>Immigration</strong><br />
Polls,” accessed online at www.fairus.org/html/04120604.htm, on May 13, 2003.<br />
17. Patrick J. McDonnell, “Wave of U.S. <strong>Immigration</strong> Likely to Survive Sept. 11,” The Los Angeles<br />
Times, Jan. 10, 2002.<br />
18. Chicago Council on Foreign Relations, Worldviews 2002—<strong>America</strong>n Public Opinion and Foreign<br />
Policy, accessed online at www.worldviews.org/detailreports/usreport/html/<br />
ch5s5.html, on March 26, 2003.<br />
19. Carl N. Degler, Out of Our Past: The Forces That Shaped Modern <strong>America</strong>, 2d ed. (New York:<br />
Harper & Row, 1970): 50.<br />
20. Stanley Lebergott, The <strong>America</strong>ns: An Economic Record (New York: Norton, 1986): 182-85.<br />
21. Vernon J. Briggs, Mass <strong>Immigration</strong> and the National Interest (Armonk, NY: M.E. Sharpe,<br />
1992): 56-57.<br />
22. Briggs, Mass <strong>Immigration</strong> and the National Interest: 45.<br />
23. Woodrow Wilson, A History of the <strong>America</strong>n People. Vol. 4, Critical Changes and the Civil War<br />
(New York: Harper and Brothers, 1901): 212-13.<br />
24. Quoted in Oscar Handlin, “Memorandum Concerning the Origins of the National Origin<br />
Quota System,” hearings before the President’s Commission on <strong>Immigration</strong> and Naturalization,<br />
82nd Congress, 2nd session (Washington, DC: U.S. Government Printing Office,<br />
1952): 755.<br />
25. House of Representatives Committee on the Judiciary, House Report 1365, 82nd Congress,<br />
2nd Session, Feb. 14, 1952 (Washington, DC: U.S. Government Printing Office, 1952): 37.<br />
26. Robert Devine, <strong>America</strong>n <strong>Immigration</strong> Policy: 1924-1952 (New Haven: Yale University Press,<br />
1957): 104.<br />
27. United Nations High Commissioner for Refugees, The State of the World’s Refugees 2000: Fifty<br />
Years of Humanitarian Action (Oxford, England: Oxford University Press, 2000): 23.<br />
28. See <strong>Immigration</strong> and Refugee Services of <strong>America</strong>, accessed online at www.refugeesusa.org/<br />
who/, on March 27, 2003.<br />
43
44<br />
29. Select Commission on <strong>Immigration</strong> and Refugee Policy (SCIRP), U.S. <strong>Immigration</strong> Policy<br />
and the National Interest (Washington, DC: SCIRP, 1981).<br />
30. Philip L. Martin, “Good Intentions Gone Awry: IRCA and U.S. Agriculture,” Annals of the<br />
Academy of Political and Social Science, 534 (July 1994): 44-57.<br />
31. U.S. Department of Homeland Security (DHS), “DHS Organization,” accessed online at<br />
www.dhs.gov/dhspublic/display?theme=9, on April 29, 2003.<br />
32. Jeffrey S. Passel and Wendy Zimmermann, “Are Immigrants Leaving California?” (Washington,<br />
DC: The Urban Institute, 2001).<br />
33. Jeffrey S. Passel, “Projections of the U.S. <strong>Population</strong> and Labor Force by Generation and<br />
Educational Attainment: 2000–2050” (Washington, DC: The Urban Institute, 2003). The estimated<br />
annual inflow of 1,250,000 includes legal immigration and net illegal immigration.<br />
34. Passel, “Projections of the U.S. <strong>Population</strong> and Labor Force.”<br />
35. Ben Wattenberg, The Birth Dearth: What Happens When People in Free Countries Don’t Have<br />
Enough Babies? (New York: Pharos Books, 1987).<br />
36. Passel, “Projections of the U.S. <strong>Population</strong> and Labor Force.”<br />
37. Passel, “Projections of the U.S. <strong>Population</strong> and Labor Force.”<br />
38. Passel, “Projections of the U.S. <strong>Population</strong> and Labor Force.”<br />
39. James P. Smith and Barry Edmonston, eds., The New <strong>America</strong>ns: Economic, Demographic, and<br />
Fiscal Effects of <strong>Immigration</strong> (Washington, DC: National Academy Press, 1997): 135-65.<br />
40. Smith and Edmonston, The New <strong>America</strong>ns: 5-17.<br />
41. Council of Economic Advisers, The Economic Effects of <strong>Immigration</strong> (Washington, DC: Council<br />
of Economic Advisers, 1986): 221.<br />
42. Richard Mines and Philip L. Martin, “Immigrant Workers and the California Citrus Industry,”<br />
Industrial Relations 23, no. 1 (1984): 139-49.<br />
43. General Accounting Office (GAO), “Illegal Aliens: Influence of Illegal Workers on Wages<br />
and Working Conditions of Legal Workers,” PEMD-88-13BR (Washington, DC: GAO,<br />
1988): 39-41.<br />
44. George J. Borjas, Friends or Strangers: The Impact of Immigrants on the U.S. Economy (New York:<br />
Basic Books, 1990): 81.<br />
45. David Card, “The Impact of the Mariel Boatlift on the Miami Labor Market,” Industrial<br />
and Labor Relations Review 43, no. 2 (1990): 245-57<br />
46. William H. Frey, “The New White Flight,” <strong>America</strong>n Demographics (April 1994): 40-48; and<br />
William H. Frey, “Escaping the City—And the Suburbs,” <strong>America</strong>n Demographics (June<br />
2002): 21-22.<br />
47. George J. Borjas, “The Economics of <strong>Immigration</strong>,” Journal of Economic Literature 32, no. 4<br />
(1994): 1667-717.<br />
48. Smith and Edmonston, The New <strong>America</strong>ns: 5-33.<br />
49. Barry Chiswick, “The Effect of <strong>America</strong>nization on the Earnings of Foreign-Born Men,”<br />
Journal of Political Economy 86, no. 5 (1978): 897-921.<br />
50. George Borjas, “Assimilation and Changes in Cohort Quality Revisited: What Happened to<br />
Immigrant Earnings in the 1980s?” National <strong>Bureau</strong> of Economic Research Working Paper no.<br />
4866 (Cambridge, MA: National <strong>Bureau</strong> of Economic Research, 1994).<br />
51. Alejandro Portes, ed., The Economic Sociology of <strong>Immigration</strong> (New York: Russell Sage Foundation,<br />
1995): 29. See also “Immigrant Entrepreneurs,” Research Perspectives on Migration 1,<br />
no. 2 (Washington, DC: Carnegie Endowment, 1997): 11-12.<br />
52. Randall Filer, Daniel Hamermesh, and Albert Rees, The Economics of Work and Pay (New<br />
York: HarperCollins, 1996): 364; and Borjas, Friends or Strangers: 163.<br />
53. Alejandro Portes and Robert L. Bach, Latin Journey: Cuban and Mexican Immigrants in the<br />
United States (Berkeley, CA: University of California Press, 1985).<br />
54. Steven A. Camarota, “Immigrants in the United States-2002,” Backgrounder, November<br />
2002 (Washington, DC: Center for <strong>Immigration</strong> Studies, 2002): table 9.<br />
55. Smith and Edmonston, The New <strong>America</strong>ns: 52-61.<br />
56. Smith and Edmonston, The New <strong>America</strong>ns: table 6.3.<br />
57. Robert Warren and Jeffrey S. Passel, “A Count of the Uncountable: Estimates of Undocumented<br />
Aliens Counted in the 1980 United States Census,” Demography 24, no. 3 (1987): 375-93.<br />
58. A country has a comparative advantage when it specializes in producing goods that it manufactures<br />
for less than another country can. Under comparative advantage theory, all<br />
countries benefit when each one trades goods in which it has a comparative advantage.<br />
Accordingly, if Mexico has a comparative advantage over the United States in producing<br />
TVs, and the United States has a comparative advantage over Mexico in producing airplanes,<br />
the economies of both countries will grow if Mexicans sell their TVs to <strong>America</strong>ns and buy<br />
U.S. airplanes. See McMaster University Archive for the History of Economic Thought,<br />
“David Ricardo and Comparative Advantage,” accessed online at www.systemics.com/<br />
docs/ricardo/david.html, on May 9, 2003.<br />
59. Douglas S. Massey, Jorge Durand, and Nolan J. Malone, Beyond Smoke and Mirrors: Mexican<br />
<strong>Immigration</strong> in an Era of Economic Integration (New York: Russell Sage Foundation, 2002).
60. U.S. Commission for the Study of International Migration and Cooperative Economic<br />
Development, “Unauthorized Migration: An Economic Development Response” (Washington,<br />
DC: U.S. Government Printing Office, 1990): xv.<br />
61. Philip L. Martin, Trade and Migration: NAFTA and Agriculture (Washington, DC: Institute for<br />
International Economics, 1993).<br />
62. Bob Deans, “President Bush’s First State Dinner: Fox Applies Heat on Migrant Issue,”<br />
Atlanta Journal and Constitution, Sept. 6, 2001.<br />
63. Elizabeth Bumiller, “Two Presidential Pals, Until 9/11 Intervened,” The New York Times,<br />
March 3, 2003.<br />
64. “Naturalization Controversy,” Migration News 3, no. 10 (October 1996).<br />
65. Louis DeSipio, Counting on the Latino Vote: Latinos as a New Electorate (Charlottesville, VA:<br />
University of Virginia Press, 1996).<br />
66. Frederick Jackson Turner, The Frontier in <strong>America</strong>n History (New York: Henry Holt, 1920):<br />
22-23.<br />
67. George Washington, “Address to the Members of the Volunteer Association and Other<br />
Inhabitants of the Kingdom of Ireland Who Have Lately Arrived in the City of New York”<br />
(Dec. 2, 1783), accessed online at www.pbs.org/georgewashington/collection/<br />
other_1788dec2.html, on May 13, 2003.<br />
68. E. Digby Baltzell, The Protestant Establishment: Aristocracy and Caste in <strong>America</strong> (New York: Vintage<br />
Books, 1964): 30.<br />
69. Robert Bach, Changing Relations: Newcomers and Established Residents in U.S. Communities (New<br />
York: The Ford Foundation, 1992): 49.<br />
70. Only 35 percent of the 75 million <strong>America</strong>ns in 1900 lived in urban areas. The small communities<br />
where most <strong>America</strong>ns lived in the early 1900s could be homogeneous even as the<br />
country as a whole was becoming more diverse. Immigrants and <strong>America</strong>ns interacted in a<br />
common “new land”—cities. Thomas Archdeacon, “Reflections on <strong>Immigration</strong> to Europe<br />
in Light of U.S. <strong>Immigration</strong> History,” International Migration Review 26, no. 2 (1992): 525-<br />
48.<br />
71. U.S. Commission on <strong>Immigration</strong> Reform, “Becoming an <strong>America</strong>n: <strong>Immigration</strong> & Immigrant<br />
Policy” (1997), accessed online at http://migration.ucdavis.edu/mn/cir/97Report1/<br />
titlepgs/titlepgs.htm, on May 12, 2003.<br />
72. François Grosjean Life with Two Languages: An Introduction to Bilingualism (Cambridge, MA:<br />
Harvard University Press, 1982): chapter 2.<br />
73. Calvin Veltmann, The Future of the Spanish Language in the United States (Washington, DC and<br />
New York: Hispanic Policy Development Project, 1988): chapter 8.<br />
74. Alejandro Portes and Richard Schauffler, “Language and the Second Generation: Bilingualism<br />
Yesterday and Today,” in The New Second Generation, ed. Alejandro Portes (New York:<br />
Russell Sage Foundation, 1996): 8-29.<br />
75. Rodolfo O. de la Garza et al., Latino Voices (Boulder, CO: Westview Press, 1992): 42.<br />
76. Portes and Schauffler, “Language and the Second Generation”: 8-29.<br />
77. Joseph R. Meisenheimer II, “How Do Immigrants Fare in the U.S. Labor Market?” Monthly<br />
Labor Review 115, no. 12 (1992): 17; and Barry Chiswick and Paul Miller, “Language in the<br />
Immigrant Labor Market,” in <strong>Immigration</strong>, Language and Ethnicity: Canada and the U.S., ed.<br />
Barry Chiswick (Washington, DC: The AEI Press, 1992): 277.<br />
78. de la Garza et al., Latino Voices: 98.<br />
79. U.S. Department of Education, National Center for Education Statistics, Common Core of<br />
Data, “Public Elementary/Secondary School Universe Survey” (2000-2001), and “Local<br />
Education Agency Universe Survey” (2000-2001), accessed online at http://nces.ed.gov/<br />
pubs2002/overview/xls/table10.xls, on Jan. 26, 2003.<br />
80. National Research Council, Improving Schooling for Language-Minority Children: A Research<br />
Agenda (Washington, DC: Commission on Behavioral and Social Sciences and Education,<br />
1997).<br />
81. Nanette Asimov, “English-Only Students Do Better on State Test,” San Francisco Chronicle,<br />
March 26, 2003.<br />
82. “Massachusetts on Right Track With English Immersion, Results in California Are Encouraging,<br />
Says U.S. ENGLISH,” U.S. Newswire, May 5, 2003; and Jim Boulet Jr., “Win Some,<br />
Lose Some,” National Review Online, Nov. 7, 2002.<br />
45
Suggested Resources<br />
Borjas, George J. Heaven’s Door: <strong>Immigration</strong> Policy and the <strong>America</strong>n Economy. Princeton,<br />
NJ: Princeton University Press, 2001.<br />
Briggs, Vernon M., Jr. <strong>Immigration</strong> and <strong>America</strong>n Unionism. Ithaca, NY: Cornell University<br />
Press, 2001.<br />
Castles, Stephen, and Mark J. Miller. The Age of Migration: International <strong>Population</strong><br />
Movements in the Modern World. New York: Guilford Press, 1998.<br />
Cornelius, Wayne A., Philip L. Martin, and Takeyuki Tsuda, eds. Controlling <strong>Immigration</strong>:<br />
A Global Perspective. Stanford, CA: Stanford University Press, 2003.<br />
Fuchs, Lawrence H. The <strong>America</strong>n Kaleidoscope: Race, Ethnicity and the Civic Culture.<br />
Hanover, NH: Wesleyan University Press of New England, 1990.<br />
Higham, John. Send These to Me: Immigrants in Urban <strong>America</strong>. Baltimore: Johns Hopkins<br />
University Press, 1984.<br />
Isbister, John. The <strong>Immigration</strong> Debate: Remaking <strong>America</strong>. West Hartford, CT: Kumarian<br />
Press, 1996.<br />
Jencks, Christopher. “Who Should Get In?” New York Review of Books, November 29,<br />
2001, and December 20, 2001.<br />
Migration News. http://migration.ucdavis.edu/mn<br />
Smith, James, and Barry Edmonston, eds. The New <strong>America</strong>ns: Economic, Demographic,<br />
and Fiscal Effects of <strong>Immigration</strong>. Washington, DC: National Research Council,<br />
1997.<br />
SOPEMI, Trends in International Migration: Annual Reports. Paris: Organisation for<br />
Economic Co-operation and Development (OECD).<br />
U.S. Commission on <strong>Immigration</strong> Reform (USCIR). Becoming an <strong>America</strong>n: <strong>Immigration</strong><br />
and Immigrant Policy. Washington, DC: USCIR, 1997.<br />
46
Related PRB Publications<br />
For more information on U.S. immigration and related issues, here are several<br />
PRB publications available in print and on our website.<br />
<strong>Population</strong> Dynamics in Latin <strong>America</strong>,<br />
by Jorge A. Brea, 2003<br />
Despite declining fertility and extensive emigration to the United States and other<br />
counties, Latin <strong>America</strong>’s population is expected to increase from 520 million to<br />
800 million by 2050. Globalization and migration trends are forging closer bonds<br />
between Latin <strong>America</strong> and the United States. (BUL58.1) $7.00<br />
What Drives U.S. <strong>Population</strong> Growth?<br />
by Mary M. Kent and Mark Mather, 2002<br />
The U.S. population is growing as fast as, or faster than, that of any other more<br />
developed country. Compared with other more developed countries, the United<br />
States has a relatively young age structure and high fertility and immigration rates,<br />
which will fuel growth over the next several decades. (BUL57.4) $7.00<br />
International Migration: Facing the Challenge<br />
by Philip Martin and Jonas Widgren, 2002<br />
This <strong>Population</strong> Bulletin highlights the challenges brought by the movement of millions<br />
of people across national borders around the world. Such migration has often<br />
been controversial, more so in light of the Sept. 11 terrorist attacks in the United<br />
States. (BUL57.1) $7.00<br />
Government Spending in an Older <strong>America</strong>,<br />
By Ronald Lee and John Haaga, 2002<br />
This issue of PRB Reports on <strong>America</strong> investigates how our public finance system could<br />
be changed to deal with the increase in the number of elderly <strong>America</strong>ns. (ROA<br />
3.1) Available online at www.prb.org.<br />
Recent <strong>Population</strong><br />
Bulletins<br />
Volume 58 (2003)<br />
No. 1 <strong>Population</strong> Dynamics in<br />
Latin <strong>America</strong>, by Jorge A. Brea<br />
Volume 57 (2002)<br />
No. 4 What Drives U.S. <strong>Population</strong><br />
Growth? by Mary M. Kent and Mark<br />
Mather<br />
No. 3 Facing the HIV/AIDS Pandemic,<br />
by Peter Lamptey, Merywen<br />
Wigley, Dara Carr, and Yvette Collymore<br />
No. 2 Poverty in <strong>America</strong>: Beyond<br />
Welfare Reform, by Daniel T. Lichter<br />
and Martha L. Crowley<br />
No. 1 International Migration:<br />
Facing the Challenge, by Philip<br />
Martin and Jonas Widgren<br />
Volume 56 (2001)<br />
No. 4 Elderly <strong>America</strong>ns, by Christine<br />
L. Himes<br />
No. 3 World <strong>Population</strong> Futures,<br />
by Brian O’Neill and Deborah Balk<br />
No. 2 First Glimpses From the<br />
2000 U.S. Census, by Mary M. Kent,<br />
Kelvin M. Pollard, John Haaga, and<br />
Mark Mather<br />
No. 1 New <strong>Population</strong> Policies:<br />
Advancing Women’s Health and<br />
Rights, by Lori S. Ashford<br />
Volume 55 (2000)<br />
No. 4 <strong>America</strong>n Families,<br />
by Suzanne M. Bianchi and<br />
Lynne M. Casper<br />
No. 3 An Urbanizing World,<br />
by Martin P. Brockerhoff<br />
No. 2 <strong>America</strong>’s Diversity and<br />
Growth: Signposts for the 21st Century,<br />
by Martha Farnsworth Riche<br />
To order PRB publications (discounts available):<br />
<strong>Population</strong> <strong>Reference</strong> <strong>Bureau</strong><br />
1875 Connecticut Ave., NW, Suite 520<br />
Washington, DC 20009<br />
Phone: 800-877-9881<br />
Fax: 202-328-3937<br />
E-mail: popref@prb.org<br />
Website: www.prb.org<br />
No. 1 Attaining Global Health:<br />
Challenges and Opportunities,<br />
by Scott C. Ratzan, Gary L. Filerman,<br />
and John W. LeSar<br />
Volume 54 (1999)<br />
No. 4 <strong>Population</strong> and Health:<br />
An Introduction to Epidemiology,<br />
2d ed., by Ian R.H. Rockett<br />
No. 3 <strong>America</strong>’s Racial and Ethnic<br />
Minorities, by Kelvin M. Pollard and<br />
William P. O’Hare<br />
To read selected PRB publications, go to: www.prb.org
<strong>Population</strong> <strong>Reference</strong> <strong>Bureau</strong><br />
1875 Connecticut Avenue, NW, Suite 520<br />
Washington, DC 20009-5728<br />
202-483-1100<br />
www.prb.org