Immigration Shaping America - Population Reference Bureau
Immigration Shaping America - Population Reference Bureau
Immigration Shaping America - Population Reference Bureau

Create successful ePaper yourself
Turn your PDF publications into a flip-book with our unique Google optimized e-Paper software.
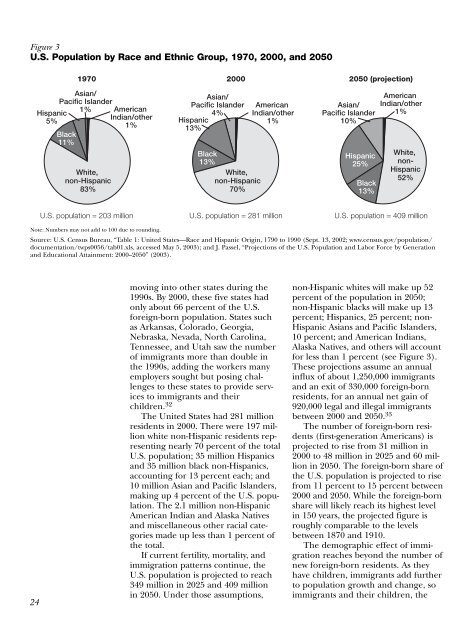
Figure 3<br />
U.S. <strong>Population</strong> by Race and Ethnic Group, 1970, 2000, and 2050<br />
1970 2000 2050 (projection)<br />
Hispanic<br />
5%<br />
Asian/<br />
Pacific Islander<br />
Black<br />
11%<br />
1% <strong>America</strong>n<br />
Indian/other<br />
1%<br />
White,<br />
non-Hispanic<br />
83%<br />
Asian/<br />
Pacific Islander<br />
4%<br />
Hispanic<br />
13%<br />
Black<br />
13%<br />
White,<br />
non-Hispanic<br />
70%<br />
<strong>America</strong>n<br />
Indian/other<br />
1%<br />
Asian/<br />
Pacific Islander<br />
10%<br />
Hispanic<br />
25%<br />
Black<br />
13%<br />
<strong>America</strong>n<br />
Indian/other<br />
1%<br />
White,<br />
non-<br />
Hispanic<br />
52%<br />
U.S. population = 203 million U.S. population = 281 million U.S. population = 409 million<br />
Note: Numbers may not add to 100 due to rounding.<br />
Source: U.S. Census <strong>Bureau</strong>, “Table 1: United States—Race and Hispanic Origin, 1790 to 1990 (Sept. 13, 2002; www.census.gov/population/<br />
documentation/twps0056/tab01.xls, accessed May 5, 2003); and J. Passel, “Projections of the U.S. <strong>Population</strong> and Labor Force by Generation<br />
and Educational Attainment: 2000–2050” (2003).<br />
24<br />
moving into other states during the<br />
1990s. By 2000, these five states had<br />
only about 66 percent of the U.S.<br />
foreign-born population. States such<br />
as Arkansas, Colorado, Georgia,<br />
Nebraska, Nevada, North Carolina,<br />
Tennessee, and Utah saw the number<br />
of immigrants more than double in<br />
the 1990s, adding the workers many<br />
employers sought but posing challenges<br />
to these states to provide services<br />
to immigrants and their<br />
children. 32<br />
The United States had 281 million<br />
residents in 2000. There were 197 million<br />
white non-Hispanic residents representing<br />
nearly 70 percent of the total<br />
U.S. population; 35 million Hispanics<br />
and 35 million black non-Hispanics,<br />
accounting for 13 percent each; and<br />
10 million Asian and Pacific Islanders,<br />
making up 4 percent of the U.S. population.<br />
The 2.1 million non-Hispanic<br />
<strong>America</strong>n Indian and Alaska Natives<br />
and miscellaneous other racial categories<br />
made up less than 1 percent of<br />
the total.<br />
If current fertility, mortality, and<br />
immigration patterns continue, the<br />
U.S. population is projected to reach<br />
349 million in 2025 and 409 million<br />
in 2050. Under those assumptions,<br />
non-Hispanic whites will make up 52<br />
percent of the population in 2050;<br />
non-Hispanic blacks will make up 13<br />
percent; Hispanics, 25 percent; non-<br />
Hispanic Asians and Pacific Islanders,<br />
10 percent; and <strong>America</strong>n Indians,<br />
Alaska Natives, and others will account<br />
for less than 1 percent (see Figure 3).<br />
These projections assume an annual<br />
influx of about 1,250,000 immigrants<br />
and an exit of 330,000 foreign-born<br />
residents, for an annual net gain of<br />
920,000 legal and illegal immigrants<br />
between 2000 and 2050. 33<br />
The number of foreign-born residents<br />
(first-generation <strong>America</strong>ns) is<br />
projected to rise from 31 million in<br />
2000 to 48 million in 2025 and 60 million<br />
in 2050. The foreign-born share of<br />
the U.S. population is projected to rise<br />
from 11 percent to 15 percent between<br />
2000 and 2050. While the foreign-born<br />
share will likely reach its highest level<br />
in 150 years, the projected figure is<br />
roughly comparable to the levels<br />
between 1870 and 1910.<br />
The demographic effect of immigration<br />
reaches beyond the number of<br />
new foreign-born residents. As they<br />
have children, immigrants add further<br />
to population growth and change, so<br />
immigrants and their children, the