ANNUAL REPORT 2011 - Connacher Oil and Gas
ANNUAL REPORT 2011 - Connacher Oil and Gas
ANNUAL REPORT 2011 - Connacher Oil and Gas

You also want an ePaper? Increase the reach of your titles
YUMPU automatically turns print PDFs into web optimized ePapers that Google loves.
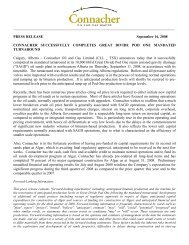
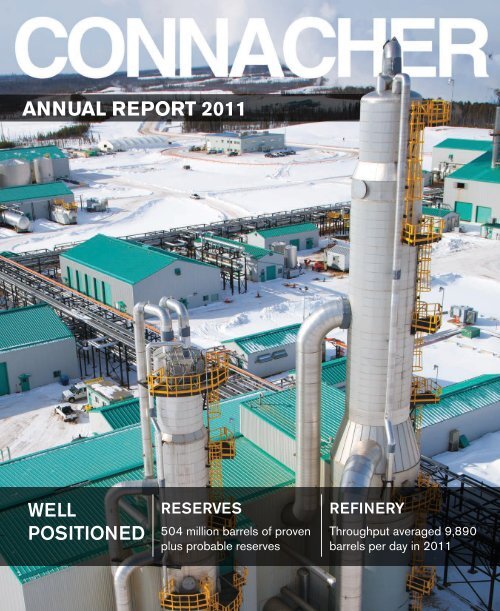
<strong>ANNUAL</strong> <strong>REPORT</strong> <strong>2011</strong><br />
WELL<br />
POSITIONED<br />
RESERVES<br />
504 million barrels of proven<br />
plus probable reserves<br />
REFINERY<br />
Throughput averaged 9,890<br />
barrels per day in <strong>2011</strong>
CORPORATE PROFILE<br />
<strong>Connacher</strong> <strong>Oil</strong> <strong>and</strong> <strong>Gas</strong> Limited is in an enviable operating position in the<br />
midst of one of the world’s largest accumulations of crude oil or bitumen<br />
located in the north eastern Athabasca region of Alberta. Since 2004,<br />
<strong>Connacher</strong> has established itself as a significant independent player in the<br />
Canadian oil s<strong>and</strong>s industry with an enterprise value in excess of $1.3 billion<br />
<strong>and</strong> an underlying pre-tax <strong>and</strong> after-tax net asset value which is significantly<br />
higher. While we are one of the smaller companies engaged in the business,<br />
our reviews say we are nimble, innovative <strong>and</strong> committed to the efficient<br />
modular expansion of our productive capacity.<br />
We also have conventional crude oil <strong>and</strong> natural gas properties <strong>and</strong> a<br />
profitable 9,500 bbl/d heavy crude oil refinery in Great Falls, Montana.<br />
Our integrated approach is designed to mitigate risk <strong>and</strong> our proved <strong>and</strong><br />
probable reserve base of half a billion barrels should facilitate a long run of<br />
success <strong>and</strong> value enhancement.<br />
CONTENT<br />
<strong>Connacher</strong>’s <strong>2011</strong> Annual<br />
GENERAL Meeting<br />
June 28, 2012<br />
3:00 PM (MDT)<br />
Calgary Petroleum Club – Devonian Room<br />
319 – 5 Avenue SW, Calgary, Alberta<br />
5<br />
LETTER TO<br />
SHAREHOLDERS<br />
<strong>Connacher</strong> is committed to maximizing<br />
shareholder value in 2012.<br />
9<br />
OPERATIONS REVIEW<br />
<strong>Connacher</strong>’s first steam assisted gravity<br />
drainage project has been producing<br />
bitumen since late 2007.
AR <strong>2011</strong><br />
PG 1<br />
02 HIGHLIGHTS<br />
05 LETTER TO SHAREHOLDERS<br />
09 REVIEW OF OPERATIONS<br />
12 RESERVES<br />
12<br />
RESERVES<br />
<strong>Connacher</strong>’s estimated proved <strong>and</strong><br />
probable oil <strong>and</strong> natural gas reserves<br />
total approximately 504 million barrels<br />
of oil equivalent.<br />
16<br />
HEALTH, SAFETY AND<br />
THE ENVIRONMENT<br />
<strong>Connacher</strong> is committed to developing<br />
its resources responsibly.<br />
16 HEALTH, SAFETY AND THE<br />
ENVIRONMENT<br />
18 MANAGEMENT AND<br />
BOARD OF DIRECTORS<br />
19 MANAGEMENT’S<br />
DISCUSSION AND ANALYSIS<br />
44 CONSOLIDATED FINANCIAL<br />
STATEMENTS<br />
IBC CORPORATE INFORMATION
AR <strong>2011</strong><br />
PG 2<br />
HIGHLIGHTS<br />
<strong>Connacher</strong>’s overall objective is to create shareholder value.<br />
In <strong>2011</strong>, we accomplished our goals of monetizing non-core,<br />
mature <strong>and</strong> non-cash generating assets; reducing balance<br />
sheet risk by extending the maturity, <strong>and</strong> reducing the interest<br />
coupon on our long-term debt; reducing our exposure to foreign<br />
exchange risk through a reduction of U.S. denominated debt;<br />
<strong>and</strong> increasing year over year production at Great Divide.<br />
PRODUCTION (boepd)<br />
15000<br />
14,493<br />
ADJUSTED EBITDA (1) ($ IN MILLIONS)<br />
150<br />
REFINERY THROUGHPUT (bbl/d)<br />
10000<br />
12000<br />
10,699<br />
120<br />
8000<br />
9000<br />
9,216<br />
90<br />
6000<br />
6000<br />
60<br />
4000<br />
3000<br />
30<br />
2000<br />
0<br />
2009<br />
2010<br />
<strong>2011</strong><br />
0<br />
2009<br />
2010<br />
<strong>2011</strong><br />
0<br />
2009<br />
2010<br />
<strong>2011</strong><br />
• CRUDE OIL bbl/d<br />
• NATURAL GAS boe/d<br />
• BITUMEN bbl/d<br />
(1) A non-GAAP measure which is defined in the Advisory section of this annual report.<br />
“<strong>Connacher</strong> is focused on<br />
delivering successive <strong>and</strong> sustained<br />
improvement in operating <strong>and</strong><br />
financial results <strong>and</strong> liquidity. ”
AR <strong>2011</strong><br />
PG 3<br />
Years ended December 31<br />
FINANCIAL ($000 except per share amounts) <strong>2011</strong> 2010 % Change<br />
Revenue, net of royalties $872,806 $589,931 48<br />
Adjusted EBITDA (2) 129,871 92,206 41<br />
Net earnings (loss) (114,105) (44,669) 155<br />
Per share, basic <strong>and</strong> diluted (0.25) (0.10) 150<br />
Capital expenditures 163,428 259,165 (37)<br />
Cash on h<strong>and</strong> 117,045 19,532 499<br />
Working capital 16,876 138,644 (87)<br />
Long-term debt 856,068 847,387 1<br />
Shareholders’ equity 421,076 523,187 (20)<br />
Total assets $1,605,626 $1,569,137 (2)<br />
OPERATIONAL<br />
Daily production volumes (4)<br />
Bitumen (bbl/d) 13,379 8,299 61<br />
Crude oil (bbl/d) 427 883 (52)<br />
Natural gas (Mcf/d) 4,124 9,100 (55)<br />
Barrels of oil equivalent (boe/d) (5) 14,493 10,699 35<br />
Upstream pricing (6)<br />
Bitumen ($/bbl) $47.59 $45.65 4<br />
Crude oil ($/bbl) $82.44 $65.63 26<br />
Natural gas ($/Mcf) $3.70 $3.90 (5)<br />
Barrels of oil equivalent ($/boe) (5) $47.41 $44.13 7<br />
Downstream<br />
Throughput – Crude charged (bbl/d) 9,890 9,693 2<br />
Refinery utilization (%) 104 102 2<br />
Margins (%) 10 9 11<br />
RESERVES INFORMATION<br />
Reserves <strong>and</strong> resources (mboe) (7)<br />
Proved (1P) reserves 176,995 186,668 (5)<br />
Proved plus probable (2P) reserves 503,753 509,434 (1)<br />
Proved plus probable plus possible (3P) reserves (9) 609,601 613,485 (1)<br />
Best estimate contingent resources 174,692 220,572 (21)<br />
Reserves <strong>and</strong> resources values ($million) (8)<br />
1P reserves $1,145 $1,497 (24)<br />
2P reserves $2,462 $3,101 (21)<br />
3P reserves (9) $3,183 $3,849 (17)<br />
Best estimate contingent resources $142 $571 (75)<br />
COMMON SHARES<br />
Shares outst<strong>and</strong>ing end of period (000) 448,260 447,168 -<br />
Weighted average shares outst<strong>and</strong>ing for the period<br />
Basic (000) 448,025 432,258 4<br />
Diluted (000) 448,025 432,258 4<br />
Volume traded (000) 628,718 585,135 7<br />
Common share price ($)<br />
High $1.66 $1.88 (12)<br />
Low $0.24 $1.10 (78)<br />
Close (end of period) $0.76 $1.33 (43)<br />
(1) A non-GAAP measure which is defined in the Advisory section of the MD&A.<br />
(2) No dividends have been declared by the company since its incorporation.<br />
(3) Effective October 1, 2010, the capitalized costs relating to the company’s second oil s<strong>and</strong>s project, Algar, were added to the full cost pool for depletion <strong>and</strong> ceiling test calculations <strong>and</strong> the revenues, expenses <strong>and</strong> finance charges associated with the project were<br />
reported in the statement of operations. In this Annual Report, we use the word “commerciality” to describe these circumstances. Prior thereto, Algar was considered a major development project under construction <strong>and</strong> all costs, including related financing costs <strong>and</strong><br />
internal operating expenses net of revenue, were capitalized. Accordingly, the above table does not include production <strong>and</strong> sales volumes for Algar prior to October 1, 2010. Daily production <strong>and</strong> sales averages are based on total calendar years during the year<br />
(4) Represents bitumen, crude oil <strong>and</strong> natural gas produced in the period. Actual sales volumes may be different due to inventory at the period end. Actual production volumes sold were 14,390 boe/d in <strong>2011</strong> (10,606 boe/d in 2010).<br />
(5) All references to barrels of oil equivalent (boe) are calculated on the basis of 6 Mcf:1 bbl. This conversion is based on an energy equivalency conversion method primarily applicable at the burner tip <strong>and</strong> does not represent a value equivalency at the wellhead. Boes<br />
may be misleading, particularly if used in isolation. Additionally, given the value ratio based on the current price of crude oil as compared to natural gas is significantly different from the energy equivalency of 6:1, utilizing a conversion ratio of 6:1 may be misleading as<br />
an indication of value.<br />
(6) Before royalties <strong>and</strong> risk management contract gains or losses <strong>and</strong> after applicable diluent <strong>and</strong> transportation costs divided by actual sales volumes.<br />
(7) The reserve <strong>and</strong> resource estimates for <strong>2011</strong> <strong>and</strong> 2010 were prepared by GLJ Petroleum Consultants Ltd., an independent professional petroleum engineering firm, in accordance with Canadian Securities Administrators’ National Instrument 51-101 <strong>and</strong> the<br />
Canadian <strong>Oil</strong> <strong>and</strong> <strong>Gas</strong> Evaluation H<strong>and</strong>book. For the definitions of the terms used please refer to the “Production, Sales <strong>and</strong> Reserves” section of the annual report.<br />
(8) PV10 of future net revenues associated with reserves <strong>and</strong> resources do not necessarily represent fair market value.<br />
(9) As at December 31, <strong>2011</strong>, possible reserves were 106 million bbls valued at PV10 of $721 million (2010 – 104 million bbls valued at PV10 of $748 million).
AR <strong>2011</strong><br />
PG 4<br />
“<strong>Connacher</strong><br />
remains bullish<br />
about the<br />
long-term price<br />
of bitumen.”
AR <strong>2011</strong><br />
PG 5<br />
Volatility in the oil <strong>and</strong> gas industry <strong>and</strong> new technologies<br />
<strong>and</strong> transportation initiatives made for an interesting year at<br />
<strong>Connacher</strong>. The first half of <strong>2011</strong> saw the continued ramp-up<br />
of Algar (which commenced production in August 2010) <strong>and</strong> a<br />
focus on increasing reliability at both Pod One <strong>and</strong> Algar.<br />
LETTER TO SHAREHOLDERS<br />
Dislocated pricing in the bitumen market<br />
due to pipeline outages <strong>and</strong> apportionment<br />
across North America resulted in <strong>Connacher</strong><br />
pioneering the sale of diluted bitumen<br />
(dilbit) by rail to the Gulf <strong>and</strong> West coasts.<br />
Operational reliability continued to improve<br />
during the year as evidenced by reduced<br />
chemical usage, improved water treating<br />
<strong>and</strong> recycling rates, upgraded electrical<br />
services, improved downhole pump run life<br />
<strong>and</strong> optimized evaporator performance.<br />
Work continued during the year on the<br />
Great Divide expansion project, for which<br />
<strong>Connacher</strong> expects to obtain regulatory<br />
approval in the first half of 2012. The<br />
SAGD+ trial (where solvent is mixed with<br />
steam <strong>and</strong> injected into the reservoir) started<br />
in July <strong>and</strong> demonstrated very encouraging<br />
results as a way to improve well productivity<br />
<strong>and</strong> reduce steam:oil ratios (“SORs”).<br />
debt. Asset sales continued throughout<br />
the year <strong>and</strong> added to cash balances. Joint<br />
venture processes were initiated in the oil<br />
s<strong>and</strong>s <strong>and</strong> light oil resource plays but were<br />
subsequently suspended.<br />
The refinery in Great Falls, Montana had<br />
strong results in <strong>2011</strong> as prices for refined<br />
products in its market area remained healthy<br />
throughout the year.<br />
In May <strong>2011</strong>, the Company refinanced<br />
its long-term debt at lower coupon rates,<br />
extended maturities to 2018 <strong>and</strong> 2019<br />
<strong>and</strong> reduced its exposure to U.S. dollar<br />
denominated debt by replacing a portion of<br />
its debt with Canadian dollar denominated
AR <strong>2011</strong><br />
PG 6<br />
As at December 31, <strong>2011</strong>, <strong>Connacher</strong>’s<br />
estimated proved <strong>and</strong> probable (“2P”)<br />
bitumen <strong>and</strong> conventional crude oil, natural<br />
gas <strong>and</strong> natural gas liquids reserves, as<br />
evaluated by GLJ Petroleum Consultants<br />
Ltd. (“GLJ”), independent qualified reserves<br />
evaluators, totaled approximately 504 million<br />
barrels of oil equivalent (“boe”). Despite a<br />
very modest capital program during <strong>2011</strong>,<br />
bitumen reserve volumes held virtually<br />
constant in all reserve categories, with the<br />
exception of proved producing bitumen,<br />
of which approximately 4.9 million barrels<br />
were produced during the year. The 10<br />
percent pre-tax present value of 2P reserves<br />
decreased to $2.5 billion, due primarily to<br />
increased estimated future capital costs,<br />
adjusted near-term production forecasts <strong>and</strong><br />
capital plans. Contingent <strong>and</strong> prospective<br />
bitumen resources also declined, mainly as a<br />
result of the sale of the Company’s Halfway<br />
Creek property.<br />
In <strong>2011</strong>, the Company embarked on a<br />
program to rationalize its non-core asset<br />
base. In February <strong>2011</strong>, the mature Battrum,<br />
Saskatchewan crude oil producing property<br />
was sold for $56.2 million <strong>and</strong> in April <strong>2011</strong><br />
the Marten Creek/R<strong>and</strong>all natural gas<br />
property in north central Alberta was sold for<br />
$22.1 million. Additionally, <strong>Connacher</strong> sold<br />
its undivided 50 percent working interest<br />
in l<strong>and</strong>s at Halfway Creek, Alberta, situated<br />
south of Fort McMurray, for $26.5 million, as<br />
well as undeveloped l<strong>and</strong> for $12.5 million,<br />
primarily situated at Latornell in the Deep<br />
Basin of northwestern Alberta. Total proceeds<br />
from these divestitures was $117.3 million<br />
which was added to working capital.<br />
<strong>Connacher</strong>’s 9,500 bbl/d heavy oil<br />
refinery in Great Falls, Montana had a very<br />
successful <strong>2011</strong>, operating at 104 percent<br />
of capacity, up from 102 percent of capacity<br />
in 2010. Strong refinery margins were<br />
primarily due to the improved stability of<br />
refining operations, more favorable weather<br />
conditions for road paving activities that<br />
buoyed higher relative asphalt sales <strong>and</strong><br />
increased dem<strong>and</strong> for refined petroleum<br />
products such as gasoline, diesel <strong>and</strong> jet<br />
fuel in <strong>2011</strong>.<br />
The refinery is strategically aligned with the<br />
Company’s oil s<strong>and</strong>s business. It primarily<br />
processes Canadian heavy sour crude<br />
oil into a range of higher value refined<br />
petroleum products, thereby capturing more<br />
of the value chain in a produced barrel<br />
of oil. Accordingly, the refinery provides a<br />
physical hedge for <strong>Connacher</strong>’s bitumen<br />
revenue by recovering a portion of the heavy<br />
oil differential in its netbacks under normal<br />
operating conditions. Over the past several<br />
years closely aligned marketing initiatives<br />
between upstream <strong>and</strong> downstream<br />
operations served the Company well in<br />
dealing with the challenging North American<br />
energy market environment.<br />
Notwithst<strong>and</strong>ing higher adjusted EBITDA,<br />
the Company incurred a net loss of<br />
$114.1 million or $0.25 per share in <strong>2011</strong><br />
compared to a net loss of $44.7 million or<br />
$0.10 per share in 2010. This was primarily<br />
due to lower unrealized foreign exchange<br />
gains, mainly in respect of U.S. dollar<br />
denominated debt, <strong>and</strong> higher depletion <strong>and</strong><br />
finance charges, partially offset by gains on<br />
the sale of assets <strong>and</strong> on risk management<br />
contracts. Please refer to the Management’s<br />
Discussion <strong>and</strong> Analysis for the year ended<br />
December 31, <strong>2011</strong> (“MD&A”) for a more<br />
detailed discussion in this regard.<br />
At December 31, <strong>2011</strong>, cash balances were<br />
$117.0 million, working capital was $16.9<br />
million <strong>and</strong> long-term debt totaled $856.0<br />
million. Convertible debentures with face<br />
value of approximately $100 million are due<br />
for repayment in June of 2012, accounting<br />
for the difference between cash <strong>and</strong> working<br />
capital as the debentures are classified<br />
as current debt on the balance sheet.<br />
<strong>Connacher</strong> has available bank credit lines<br />
of $100 million net of outst<strong>and</strong>ing letters of<br />
credit totaling $2.2 million which had been<br />
issued by the Company at year end <strong>2011</strong>.
AR <strong>2011</strong><br />
PG 7<br />
“Thanks to our liquidity, balanced<br />
operations, production potential<br />
<strong>and</strong> demonstrated execution,<br />
we’re optimistic about the future.”<br />
Total capital expenditures during the year<br />
were $163.4 million which was financed<br />
from operating cash flow <strong>and</strong> cash balances.<br />
Details of the overall capital program are<br />
contained in the MD&A.<br />
Externally there is great uncertainty<br />
in the capital <strong>and</strong> debt markets which<br />
creates volatility in oil prices <strong>and</strong> oil price<br />
differentials. <strong>Connacher</strong> remains bullish<br />
about the long term price of bitumen, but<br />
the Company also recognizes that during<br />
the second quarter there will be continued<br />
pressure on differentials <strong>and</strong> therefore<br />
wellhead pricing. The price of natural gas is<br />
a key component in <strong>Connacher</strong>’s oil s<strong>and</strong>s<br />
operations (natural gas is the biggest cost<br />
component in the generation of steam) <strong>and</strong><br />
is expected to remain low for the remainder<br />
of the year. Locally, the Alberta corridor<br />
continues to be a “bubble” with regard to<br />
costs of services, fabrication of equipment<br />
<strong>and</strong> access to human resources. Importantly,<br />
the hiatus in <strong>Connacher</strong>’s capital spending<br />
provided time to determine more cost<br />
effective if not local solutions. The everincreasing<br />
focus on oil s<strong>and</strong>s by the media,<br />
stakeholders <strong>and</strong> governments has resulted<br />
in exp<strong>and</strong>ed - not streamlined - approval<br />
processes. Effective leadership on both<br />
sides of the border will be necessary to drive<br />
efficient <strong>and</strong> economic outcomes.<br />
<strong>Connacher</strong> is focused on delivering<br />
successive <strong>and</strong> sustained improvement in<br />
operating <strong>and</strong> financial results <strong>and</strong> liquidity.<br />
Based on currently available information<br />
<strong>and</strong> prevailing commodity prices, the<br />
Company anticipates 2012 results that<br />
reflect solid operational performance in<br />
spite of current capital constraints.<br />
The Company’s 2012 capital budget has<br />
been set at $50.0 million as outlined in the<br />
Company’s MD&A, including the previously<br />
announced maintenance capital budget of<br />
$37.0 million. The Company is proceeding<br />
with preparatory work on several sustaining<br />
<strong>and</strong> growth projects, including the recently<br />
completed five-well core hole program<br />
designed to provide further technical data<br />
for the Great Divide expansion project<br />
<strong>and</strong> Pad 104 drilling program at Pod One.<br />
Additional work is ongoing to finalize the<br />
design basis memor<strong>and</strong>um for the Great<br />
Divide expansion project, complete the<br />
preparation of a commercial front end<br />
engineering design study for the Company’s<br />
SAGD+ project <strong>and</strong> the expansion <strong>and</strong><br />
upgrading of rail <strong>and</strong> other facilities at the<br />
Montana refinery.<br />
As previously announced, the Company’s<br />
Board of Directors has initiated a process<br />
to review <strong>Connacher</strong>’s business plan <strong>and</strong> to<br />
identify, examine <strong>and</strong> consider all strategies<br />
available to the Company, both near <strong>and</strong><br />
long term, in order to prudently determine<br />
the optimal course of action for the<br />
Company. Goldman Sachs <strong>and</strong> RBC Capital<br />
Markets have been engaged to assist the<br />
Board of Directors in connection with this<br />
strategic review. In addition, the current<br />
directors of the Company are pleased to<br />
welcome Mr. Greg Bol<strong>and</strong> <strong>and</strong> Mr. Garry<br />
Mihaichuk to the Board.<br />
The Company has a number of capital<br />
projects with very good economics that<br />
are expected to increase production<br />
<strong>and</strong>/or improve netbacks. These projects<br />
will continue to be evaluated during this<br />
period <strong>and</strong> will be undertaken as free cash<br />
flow is available.<br />
Thanks to <strong>Connacher</strong>’s liquidity, balanced<br />
operations, significant production potential<br />
<strong>and</strong> demonstrated execution, we’re<br />
optimistic about the future.<br />
Colin M. Evans <strong>and</strong> Kelly J. Ogle<br />
Co-Managing Directors<br />
March 15, 2012
AR <strong>2011</strong><br />
PG 8<br />
AB<br />
FORT MCMURRAY<br />
SK<br />
Great Divide<br />
Pod One/Algar<br />
EDMONTON<br />
Central Alberta Conventional<br />
CANADA<br />
CALGARY<br />
U.S.A.<br />
Montana Refining Company<br />
GREAT FALLS<br />
MT<br />
CANADA<br />
U.S.A.<br />
<strong>Oil</strong> S<strong>and</strong>s Assets<br />
Conventional Assets<br />
Refinery
AR <strong>2011</strong><br />
PG 9<br />
Review of Operations<br />
In <strong>2011</strong>, <strong>Connacher</strong> demonstrated:<br />
• Average bitumen production of 13,379 bbl/day <strong>and</strong> average total<br />
production of 14,493 boe/day<br />
• Increased reliability in oil s<strong>and</strong>s operations with plant steam<br />
throughput achieving design conditions<br />
• Most profitable refinery operations since the company acquired<br />
Montana Refining Company, Inc (“MRC)” in 2006<br />
• A technical leap forward with SAGD+ technology that will benefit<br />
Algar <strong>and</strong> the industry<br />
• Continued progress on the Great Divide expansion project design,<br />
engineering <strong>and</strong> stewardship through the application process<br />
• A successful property rationalization process with sale of Battrum,<br />
Marten Creek, Halfway Creek, Latornell <strong>and</strong> minor undeveloped l<strong>and</strong><br />
• Innovative marketing <strong>and</strong> transportation solutions to pipeline<br />
restrictions <strong>and</strong> pricing volatility<br />
At the same time <strong>Connacher</strong> had to deal with:<br />
• Declining production <strong>and</strong> increasing SORs at Pod One as the wells<br />
have been producing since 2007<br />
• Minor reservoir issues at Algar<br />
• Poor initial production results from the conventional resource play<br />
• Capital restraints for the latter half of the year<br />
All bITUMEN producers had to deal with:<br />
• Volatile pricing for bitumen <strong>and</strong> diluent<br />
• Infrastructure problems, particularly pipeline outages that affected<br />
access to market<br />
• Rapidly rising costs for equipment <strong>and</strong> services<br />
• Increased competition for key competencies<br />
<strong>Connacher</strong>’s first steam assisted gravity<br />
drainage (“SAGD”) project at Great Divide,<br />
Pod One, has been producing bitumen<br />
since late 2007, with commercial production<br />
commencing March 1, 2008. <strong>Connacher</strong>’s<br />
second SAGD project Algar, commenced<br />
producing bitumen in August 2010 <strong>and</strong><br />
commerciality was achieved October 1,<br />
2010. Production from both projects since<br />
start-up through December 31, <strong>2011</strong> has<br />
totaled approximately 12.6 million barrels of<br />
bitumen, of which 4.9 million barrels were<br />
produced in <strong>2011</strong>.<br />
Steam throughput reached design<br />
conditions at both plants in <strong>2011</strong>. Natural<br />
gas prices were essentially flat year-overyear<br />
which helped operating costs in the oil<br />
s<strong>and</strong>s operations. Although the company<br />
met revised production guidance in <strong>2011</strong>,<br />
lower bitumen production <strong>and</strong> cash flow<br />
necessitated constraining capital spending<br />
in the oil s<strong>and</strong>s in the second half of the<br />
year. Projects requiring regulatory approval<br />
received approval but the capital for those<br />
projects was deferred.<br />
An application was submitted in May<br />
of 2010 that proposes a 24,000 bbl/d<br />
expansion of the existing Algar facility – a<br />
“brownfield” expansion. While guiding the<br />
application through the regulatory process,<br />
engineering <strong>and</strong> design work continued<br />
throughout the year on the Great Divide<br />
expansion project.<br />
<strong>Connacher</strong>’s SAGD+ trial commenced<br />
in July <strong>2011</strong> at Algar <strong>and</strong> the company<br />
is encouraged by initial results. The<br />
SAGD+ trial has the potential to improve<br />
productivity <strong>and</strong> reduce SORs by injecting<br />
steam mixed with solvent into the reservoir.<br />
Two wells were selected to test whether<br />
varying solvent volumes added to the<br />
steam injection would result in production<br />
increases, reduced SORs <strong>and</strong> the<br />
economics recovery of injected solvent at<br />
surface treating facilities.<br />
The objectives, specifically, were to:<br />
• test the incremental bitumen<br />
production increase<br />
• monitor the timing for solvent recovery<br />
• measure how much solvent was retained<br />
in the reservoir rather than being produced<br />
to surface<br />
• evaluate the optimal solvent concentration<br />
in the steam
AR <strong>2011</strong><br />
PG 10<br />
Pilot results from July to year end <strong>2011</strong><br />
exceeded expectations. Average production<br />
increases for the two wells was 29 percent<br />
with an average decrease in SORs of 17<br />
percent. Moreover, solvent recovery in the<br />
field during steady-state solvent injection<br />
was greater than 85 percent. Pilot testing<br />
on additional wells will be required in 2012<br />
to confirm repeatable results at which point<br />
full implementation of SAGD+ at Algar will<br />
be considered. Capital will be required for<br />
facility modifications in order to capture <strong>and</strong><br />
recycle the recovered solvent. SAGD+ may<br />
be a very straightforward <strong>and</strong> rapid method<br />
of increasing bitumen production <strong>and</strong><br />
optimizing steam allocation.<br />
Quigley<br />
Great Divide<br />
Pod One<br />
Thornbury<br />
Algar<br />
The refinery in Great Falls, Montana had<br />
strong results in <strong>2011</strong>. Refinery throughput<br />
averaged 9,890 bbl/d. While prices for<br />
refined products in MRC’s market area<br />
remained healthy throughout the year. The<br />
margins or “crack spread” for key products<br />
produced by MRC (gasoline, diesel, jet fuel<br />
<strong>and</strong> asphalt) also remained strong during<br />
the year. Inventory management of asphalt<br />
was a focus in <strong>2011</strong> <strong>and</strong>, with good weather<br />
throughout most of the paving season,<br />
asphalt sales were maximized. MRC actively<br />
sells asphalt into the Canadian market as<br />
well as its local market in Montana. Excess<br />
naphtha is sold to <strong>Connacher</strong>’s bitumen<br />
operations for use as diluent. The refinery<br />
provides a physical hedge for the oil s<strong>and</strong>s<br />
operations as it purchases Canadian heavy<br />
sour crude for processing into higher value<br />
products. When differentials (the difference<br />
between light oil <strong>and</strong> heavy oil prices)<br />
widen, the result is lower wellhead prices for<br />
bitumen. Fortunately, the refinery benefits<br />
as its crude feedstock becomes cheaper,<br />
providing better margins.<br />
63 Bitumen accumulation<br />
In <strong>2011</strong>, bitumen market access in North<br />
America <strong>and</strong> farther afield became a major<br />
challenge producers, pipeline companies,<br />
governments <strong>and</strong> other stakeholders<br />
including environmental groups. Ruptures,<br />
spills <strong>and</strong> outages in North American<br />
pipeline infrastructure throughout the year<br />
caused disruptions in the Alberta oil market,<br />
restricting access to market for producers.<br />
Public protests regarding new pipeline
AR <strong>2011</strong><br />
PG 11<br />
proposals helped to politicize <strong>and</strong> delay<br />
approvals for needed takeaway capacity.<br />
As a result, crude oil from Canada <strong>and</strong> many<br />
new rapidly exp<strong>and</strong>ing American oilfields<br />
faced a discount in market price relative to<br />
the benchmark West Texas Intermediate<br />
(“WTI”) oil price. WTI was, in turn, discounted<br />
relative to world oil prices, more specifically<br />
by the benchmark Brent oil price. As a risk<br />
mitigant to these issues, starting in early<br />
<strong>2011</strong>, <strong>Connacher</strong> began moving dilbit by<br />
rail to markets that wanted to purchase <strong>and</strong><br />
process bitumen but weren’t able to access<br />
Canadian heavy crude by pipeline. These<br />
markets are located both on the West coast<br />
<strong>and</strong> the Gulf coast. Prices received were<br />
as good as or better than local Canadian<br />
markets-net of transportation changes.<br />
As a result of these successful efforts<br />
to pioneer “dilbit by rail” <strong>Connacher</strong> has<br />
committed to exp<strong>and</strong>ing its leased rail car<br />
fleet <strong>and</strong> continues to explore new market<br />
opportunities. Using rail cars to transport<br />
crude oil is a strategy that many companies,<br />
particularly producers in North Dakota, are<br />
also pursuing.<br />
Asset sales continued throughout the year<br />
<strong>and</strong> added to cash balances. Battrum,<br />
Marten Creek, Halfway Creek, Latornell<br />
<strong>and</strong> minor undeveloped l<strong>and</strong> were sold.<br />
<strong>Connacher</strong>’s strategy was to dispose<br />
of properties with limited upside but<br />
significant new capital or maintenance<br />
<strong>Connacher</strong> pioneered<br />
“dilbit by rail” to the Gulf<br />
Coast <strong>and</strong> West Coast<br />
capital expenditures, allowing the company<br />
to focus on projects with better potential.<br />
In addition, after significant review during<br />
2010, a decision to sell natural gas<br />
properties was also advanced. Given the<br />
short to medium term direction for natural<br />
gas pricing (subsequently born out), it was<br />
decided that producing natural gas as a<br />
physical hedge for natural gas consumption<br />
in the production of steam in the oil<br />
s<strong>and</strong>s was not necessary at present. As<br />
a result several gas properties were sold<br />
including the Marten Creek property. Overall<br />
conventional production declined over 50<br />
percent, primarily as a result of the asset<br />
rationalization program. Two new light oil<br />
resource plays in central Alberta were<br />
tested in <strong>2011</strong>. Although initial results were<br />
disappointing <strong>and</strong> production did not meet<br />
economic hurdles, there is significant oil in<br />
place at Twining <strong>and</strong> Penhold. Technical <strong>and</strong><br />
geological review would suggest that the<br />
completion <strong>and</strong> frac techniques employed<br />
for these wells can be improved upon <strong>and</strong><br />
optimized. However, the company is not<br />
prepared to invest more capital in these<br />
plays at this time.<br />
Joint venture processes to obtain a partner<br />
commenced in the oil s<strong>and</strong>s <strong>and</strong> the light<br />
oil resources plays but neither process was<br />
satisfactorily resolved by year end.<br />
T 83<br />
T 82<br />
T 81<br />
RG13 RG12 RG11W4<br />
“<strong>Connacher</strong> has<br />
identified multiple<br />
SAGD horizontal<br />
well pair locations<br />
as part of the<br />
Great Divide<br />
expansion project.”<br />
EIA Well Pairs Existing Well Pairs Net SAGD Pay
AR <strong>2011</strong><br />
PG 12<br />
RESERVES<br />
<strong>Connacher</strong>’s estimated proved <strong>and</strong> probable<br />
bitumen <strong>and</strong> conventional crude oil <strong>and</strong><br />
natural gas reserves total approximately<br />
504 million barrels of oil equivalent. This<br />
estimate is based on a report by GLJ,<br />
independent qualified reserves evaluators,<br />
as of December 31, <strong>2011</strong>. Despite a<br />
modest capital program during <strong>2011</strong>,<br />
bitumen reserve volumes held virtually<br />
constant in all reserve categories compared<br />
with 2010, with the exception of proved<br />
producing bitumen, of which approximately<br />
4.9 million barrels were produced during<br />
the year. The 10 percent pre-tax present<br />
value (“10% PV”) of 2P reserves decreased<br />
to $2.5 billion, due primarily to increased<br />
estimated future capital costs. Contingent<br />
<strong>Connacher</strong> has 500<br />
million barrels of 2P<br />
bitumen reserves<br />
<strong>and</strong> prospective bitumen resources also<br />
declined, mainly as a result of the sale of<br />
the Company’s 50% interest in the Halfway<br />
Creek oil s<strong>and</strong>s property.<br />
Detailed information included in the GLJ<br />
December 31, <strong>2011</strong> report (“Year-End <strong>2011</strong><br />
Report”) regarding <strong>Connacher</strong>’s reserves<br />
<strong>and</strong> resources <strong>and</strong> associated present<br />
values is provided in the following tables,<br />
including a comparison of year-end <strong>2011</strong><br />
results to year-end 2010 results.<br />
The Year-End <strong>2011</strong> Report was prepared<br />
using assumptions <strong>and</strong> methodology<br />
guidelines outlined in the Canadian <strong>Oil</strong><br />
<strong>and</strong> <strong>Gas</strong> Evaluation H<strong>and</strong>book (“COGE<br />
H<strong>and</strong>book”) <strong>and</strong> in accordance with<br />
National Instrument 51-101 (“NI 51-101”).<br />
Comparisons with respect to <strong>Connacher</strong>’s<br />
conventional <strong>and</strong> bitumen reserves, bitumen<br />
resources <strong>and</strong> for 10% PV for December<br />
31, <strong>2011</strong> are to estimates contained in the<br />
report, prepared by GLJ, with an effective<br />
date of December 31, 2010 (“Year-End<br />
2010 Report”).<br />
<strong>Connacher</strong> owns a 100 percent working<br />
interest in approximately 87,000 net acres<br />
of oil s<strong>and</strong>s leases, primarily located at its<br />
Great Divide project in northeastern Alberta,<br />
situated 80 kilometres southwest of Fort<br />
McMurray. Numerous oil accumulations in<br />
the McMurray formation have been identified<br />
for continuing <strong>and</strong> future development on<br />
<strong>Connacher</strong>’s properties.<br />
Since March of 2008, <strong>Connacher</strong> production<br />
from Great Divide has totaled approximately<br />
12.6 million barrels of bitumen, of which 4.9<br />
million barrels were produced in <strong>2011</strong>. Such<br />
amounts have been deducted from earlier<br />
estimates of proved reserves prior to the<br />
calculation of reserves as at December 31,<br />
<strong>2011</strong>. <strong>Connacher</strong>’s conventional reserve<br />
base declined, due primarily to the sale of<br />
several mature conventional properties,<br />
totaling approximately 8.2 million boe.<br />
The GLJ Year-End <strong>2011</strong> Report was<br />
prepared using the GLJ January 1, 2012<br />
price forecast, effective December 31,<br />
<strong>2011</strong>. Readers are referred to the notes to<br />
the Summary Tables for details regarding the<br />
price forecast used by GLJ. Earlier reports<br />
were prepared using the price forecasts<br />
then being applied by GLJ.<br />
WORKING INTEREST RESERVES<br />
(MMBBL) – BITUMEN<br />
700<br />
600<br />
500<br />
400<br />
300<br />
200<br />
100<br />
0<br />
4,000<br />
3,500<br />
3,000<br />
2,500<br />
2,000<br />
1,500<br />
1,000<br />
500<br />
0<br />
2007<br />
2008<br />
2009<br />
2010<br />
<strong>2011</strong><br />
• PROVED • PROBABLE • POSSIBLE<br />
BEFORE TAX PV10<br />
($MILLION) – BITUMEN<br />
2007<br />
2008<br />
2009<br />
2010<br />
<strong>2011</strong><br />
• PROVED • PROBABLE • POSSIBLE
AR <strong>2011</strong><br />
PG 13<br />
reservoir description <strong>and</strong> modeling<br />
Rapid Evolution of <strong>Connacher</strong>’s <strong>Oil</strong> S<strong>and</strong>s Underst<strong>and</strong>ing<br />
2005 CURRENT<br />
RG13 RG12 RG11W4<br />
<br />
RG13 RG12 R<br />
T 83<br />
• 3-D Imaging<br />
T 83<br />
• Exploration Core Holes<br />
• Data Integration <strong>and</strong><br />
Modeling<br />
T 82<br />
T 81<br />
• Exploitable Resource<br />
Characterization<br />
<br />
T 82<br />
T 81<br />
Best Estimate Contingent Resources (2C) : 127 MMbbl<br />
Highway 63<br />
EIA Well Pairs Existing Well Pairs Net SAGD Pay<br />
2P Reserves : 500 MMbbl<br />
EIA Well Pairs<br />
Existing Well Pairs<br />
The recognized exploitable Great Divide bitumen resource in the McMurray formation has increased as a result of <strong>Connacher</strong>’s ongoing drilling,<br />
reservoir characterization, seismic delineation <strong>and</strong> commercialization.<br />
WORking Interest VOLumes<br />
<strong>Connacher</strong> <strong>Oil</strong> <strong>and</strong> <strong>Gas</strong> Limited<br />
Bitumen Reserves <strong>and</strong> Resources<br />
31 - DEC - 10<br />
(mbbl)<br />
31 - DEC - 11<br />
(mbbl)<br />
Proved Reserves (1P) (1) 180,166 175,185 -3%<br />
Proved <strong>and</strong> Probable Reserves (2P) (1)(2) 499,657 500,825 0%<br />
Proved, Probable <strong>and</strong> Possible Reserves (3P) (1)(2)(3) 603,709 605,687 0%<br />
Low Estimate Contingent Resources (4)(6) 223,443 173,487 -22%<br />
Best Estimate Contingent Resources (4)(7) 220,572 174,692 -21%<br />
High Estimate Contingent Resources (4)(8) 408,908 243,239 -41%<br />
Best Estimate Prospective Resources (5)(7) 80,240 53,589 -33%<br />
High Estimate Prospective Resources (5)(8) 287,337 148,349 -48%<br />
12 MO<br />
% ∆
AR <strong>2011</strong><br />
PG 14<br />
<strong>Connacher</strong> <strong>Oil</strong> <strong>and</strong> <strong>Gas</strong> Limited<br />
Conventional Canadian Reserves<br />
LIGHT/MEDIUM OIL/NGL (mbbl)<br />
NATURAL GAS (mmcf)<br />
31/12/10 31/12/11 12 MO % ∆ 31/12/10 31/12/11 12 MO % ∆<br />
Proved Reserves (1P) (1) 2,524 778 -69% 23,864 6,186 -76%<br />
Probable Reserves (2) 972 556 -43% 13,818 3,371 -77%<br />
Proved + Probable Reserves (2P) (1) (2) 3,496 1,336 -62% 37,682 9,557 -77%<br />
<strong>Connacher</strong> <strong>Oil</strong> <strong>and</strong> <strong>Gas</strong> Limited<br />
Combined Conventional <strong>and</strong> Bitumen Reserves (9)<br />
31 - DEC - 10<br />
(mboe)<br />
31 - DEC - 11<br />
(mboe)<br />
Proved Conventional (1) 6,502 1,810 -72%<br />
Proved Bitumen (1) 180,166 175,185 -3%<br />
Total Proved (1P) (1) 186,668 176,995 -5%<br />
Probable Conventional (2) 3,275 1,118 -66%<br />
Probable Bitumen (2) 319,491 325,640 2%<br />
Total Probable (2) 322,766 326,758 1%<br />
Proved + Probable Conventional (1)(2) 9,777 2,928 -70%<br />
Proved + Probable Bitumen (1)(2) 499,657 500,825 0%<br />
Total Proved + Probable (2P) (1)(2) 509,434 503,753 -1%<br />
Total 3P Reserves (1)(2)(3) 613,485 609,601 -1%<br />
12 MO<br />
% ∆<br />
PRESENT VALUE (12)<br />
<strong>Connacher</strong> <strong>Oil</strong> <strong>and</strong> <strong>Gas</strong> Limited 10% Present Value of<br />
Future Net Revenue Based on Forecast Prices <strong>and</strong> Costs<br />
Bitumen Reserves <strong>and</strong> Resources - Before Tax<br />
31 - DEC - 10<br />
($MM)<br />
31 - DEC - 11<br />
($MM)<br />
12 MO<br />
% ∆<br />
Proved Reserves (1P) (1) 1,397 1,110 -21%<br />
Proved <strong>and</strong> Probable Reserves (2P) (1)(2) 2,966 2,412 -19%<br />
Proved, Probable <strong>and</strong> Possible Reserves (3P) (1)(2)(3) 3,714 3,127 -16%<br />
Low Estimate Contingent Resources (4)(6) 780 618 -21%<br />
Best Estimate Contingent Resources (4)(7) 571 142 -75%<br />
High Estimate Contingent Resources (4)(8) 1,212 372 -69%<br />
Best Estimate Prospective Resources (5)(7) 217 47 -78%<br />
High Estimate Prospective Resources (5)(8) 696 196 -72%
AR <strong>2011</strong><br />
PG 15<br />
<strong>Connacher</strong> <strong>Oil</strong> <strong>and</strong> <strong>Gas</strong> Limited 10% Present Value<br />
31 - DEC - 10<br />
of Future Net Revenue Based on Forecast Prices<br />
($MM)<br />
<strong>and</strong> Costs Combined Conventional <strong>and</strong> Bitumen<br />
Reserves - Before Tax (9)<br />
31 - DEC - 11<br />
($MM)<br />
12 MO<br />
% ∆<br />
Proved Conventional (1) 100 35 -65%<br />
Proved Bitumen (1) 1,397 1,110 -21%<br />
Total Proved (1P) (1) 1,497 1,145 -23%<br />
Probable Conventional (2) 36 15 -59%<br />
Probable Bitumen (2) 1,569 1,302 -17%<br />
Total Probable (2) 1,605 1,317 -18%<br />
Proved + Probable Conventional (1)(2) 135 50 -63%<br />
Proved + Probable Bitumen (1)(2) 2,966 2,412 -19%<br />
Total Proved + Probable (2P) (1)(2) 3,101 2,462 -21%<br />
Total 3P Reserves (1)(2)(3) 3,849 3,183 -17%<br />
Notes:<br />
1) Proved Reserves are those reserves that can be estimated with a high degree of certainty to be recoverable. It is likely that the actual remaining quantities recovered will exceed the estimated proved reserves.<br />
2) Probable Reserves are those additional reserves that are less certain to be recovered than proved reserves. It is equally likely that the actual remaining quantities recovered will be greater or less than the sum of the<br />
estimated proved plus probable reserves.<br />
3) Possible Reserves are those additional reserves that are less certain to be recovered than probable reserves. It is unlikely that the actual remaining quantities recovered will exceed the sum of the estimated proved plus<br />
probable plus possible reserves. There is a 10% probability that the quantities actually recovered will equal or exceed the sum of proved plus probable plus possible reserves.<br />
4) Contingent resources are those quantities of petroleum estimated, as of a given date, to be potentially recoverable from known accumulations using established technology or technology under development, but which<br />
are not currently considered to be commercially recoverable due to one or more contingencies. These resource estimates are not currently classified as reserves, pending further reservoir delineation, project application,<br />
facility <strong>and</strong> reservoir design work, preparation of firm development plans <strong>and</strong> Company approvals. Contingent resources entail additional commercial risk than reserves <strong>and</strong> adjustments for commercial risks have not been<br />
incorporated in the summaries set forth herein. There is no certainty that it will be commercially viable to produce any portion of the contingent resources.<br />
5) Prospective Resources are those quantities of petroleum estimated, as of a given date, to be potentially recoverable from undiscovered accumulations by application of future development projects. Prospective<br />
Resources have both an associated chance of discovery <strong>and</strong> a chance of development. The Prospective Resources estimates reflected herein have been risked for the chance of discovery but have not been risked for<br />
the chance of development <strong>and</strong> hence are considered partially risked estimates. Prospective Resources entail additional commercial risk than reserves <strong>and</strong> adjustments for commercial risks have not been incorporated<br />
in the summaries set forth herein. There is no certainty that any portion of the prospective resources will be discovered. If discovered, there is no certainty that it will be commercially viable to produce any portion of the<br />
resources. Moreover, if a discovery is made, there is no certainty that it will be developed. If it is developed, there is no certainty as to the timing of such development.<br />
6) Low Estimate: this is considered to be a conservative estimate of the quantity that will actually be recovered. It is likely that the actual remaining quantities recovered will exceed the low estimate. If probabilistic methods<br />
are used, there should be at least a 90 percent probability that the quantities actually recovered will equal or exceed the low estimate.<br />
7) Best Estimate: this is considered to be the best estimate of the quantity that will actually be recovered. It is equally likely that the actual remaining quantities recovered will exceed the best estimate. If probabilistic<br />
methods are used, there should be at least a 50 percent probability that the quantities actually recovered will equal or exceed the best estimate.<br />
8) High Estimate: this is considered to be an optimistic estimate of the quantity that will actually be recovered. It is unlikely that the actual remaining quantities recovered will exceed the high estimate. If probabilistic methods<br />
are used, there should be at least a 10 percent probability that the quantities actually recovered will equal or exceed the high estimate.<br />
9) Does not include bitumen resources or undeveloped l<strong>and</strong> value.<br />
10) Pricing assumptions in the Year-End 2010 Report <strong>and</strong> Year-End <strong>2011</strong> Report were as follows:<br />
BITUMEN<br />
(wellhead) ($/bbl)<br />
WTI<br />
(US$/bbl)<br />
NATURAL GAS<br />
(AECO) ($/mmbtu)<br />
Year-End 2010 Year-End <strong>2011</strong> Year-End 2010 Year-End <strong>2011</strong> Year-End 2010 Year-End <strong>2011</strong><br />
2012 54.41 57.69 89.00 97.00 4.74 3.49<br />
2013 55.39 60.24 90.00 100.00 5.31 4.13<br />
2014 58.50 64.39 92.00 100.00 5.77 4.59<br />
2015 60.88 66.00 95.17 100.00 6.22 5.05<br />
2016 62.57 66.00 97.55 100.00 6.53 5.51<br />
2017 64.51 65.90 100.26 100.00 6.76 5.97<br />
2018 66.27 66.82 102.74 101.35 6.90 6.21<br />
2019 68.21 68.27 105.45 103.38 7.06 6.33<br />
2020 69.69 69.74 107.56 105.45 7.21 6.46<br />
Thereafter +2%/yr +2%/yr +2%/yr +2%/yr +2%/yr +2%/yr<br />
US$/CDN$ exchange rates were 0.98 in the Year End 2010 Report <strong>and</strong> 0.98 in the Year End <strong>2011</strong> Report.<br />
11) Tables may not add due to rounding.<br />
12) Estimated values disclosed do not represent fair market value.
AR <strong>2011</strong><br />
PG 16<br />
Health, Safety, <strong>and</strong> The Environment<br />
<strong>Connacher</strong> is committed to developing<br />
its resources responsibly, <strong>and</strong> minimizing<br />
its impact on the air, l<strong>and</strong> <strong>and</strong> water. The<br />
Company does this by adhering to strict<br />
operational guidelines <strong>and</strong> investing in<br />
research <strong>and</strong> technology. Moreover, in<br />
order to grow the business responsibly<br />
the Company consults with stakeholders<br />
prior to development, maximizes local<br />
benefits <strong>and</strong> opportunities <strong>and</strong> ensures<br />
environmental protection before, during <strong>and</strong><br />
after operations. Additionally, <strong>Connacher</strong><br />
operates in a variety of ecosystems – some<br />
with sensitive characteristics. The Company<br />
strives to conserve biodiversity, including<br />
studying the impacts on wildlife <strong>and</strong><br />
following strict guidelines when working in<br />
environmentally sensitive areas.<br />
KEEPING a Minimal<br />
fOOTPRINT<br />
<strong>Connacher</strong>’s SAGD production operations<br />
allow it to access large subsurface bitumen<br />
deposits from only a few strategically-placed<br />
well pads. Due in large part to the use<br />
of state-of-the-art directional drilling <strong>and</strong><br />
bitumen recovery processes, the natural<br />
l<strong>and</strong>scape directly above a bitumen deposit<br />
requires little-to-no permanent disturbance<br />
in order to extract the resource. Those<br />
l<strong>and</strong> areas that are disturbed are done<br />
so while adhering to the philosophy of<br />
minimal disturbance <strong>and</strong> timely reclamation.<br />
<strong>Connacher</strong>’s facilities are compact in size<br />
<strong>and</strong> efficient in design, thereby minimizing<br />
the amount of l<strong>and</strong> disturbance necessary to<br />
accommodate them.<br />
USING <strong>and</strong> Reusing Water<br />
Responsibly<br />
In accordance with applicable regulations,<br />
<strong>Connacher</strong> is required to recycle at least<br />
90% of the water used for its bitumen<br />
extraction process, with the balance being<br />
comprised of make-up water. <strong>Connacher</strong>’s<br />
in-situ production process uses non-potable<br />
make-up water, which is derived from a deep,<br />
subsurface aquifer <strong>and</strong> is unsuitable for<br />
drinking or irrigation. <strong>Connacher</strong>’s production<br />
process draws no water from any rivers,<br />
lakes, or streams, nor is any used water ever<br />
discharged into these types of water bodies.<br />
Through the use of new technologies <strong>and</strong><br />
efficient operating practices, <strong>Connacher</strong><br />
continues its success in further reducing the<br />
amount of water used to extract bitumen.<br />
In fact, since it began operating in 2008,<br />
<strong>Connacher</strong>’s Pod One facility has seen<br />
a 33% decrease in its make-up water<br />
consumption. Building on that success,<br />
<strong>Connacher</strong>’s Algar facility was designed<br />
to operate at an even higher level of<br />
efficiently, often reaching a 98% water<br />
recycle rate. Algar has also shown a<br />
significant reduction in its make-up water<br />
consumption since startup.<br />
Emissions Reduction<br />
Through Technology<br />
Air emissions are a reality of bitumen, crude<br />
oil, <strong>and</strong> natural gas energy production, as<br />
they are with most other viable forms of<br />
energy generation. The resource industry<br />
has a role to play by embracing new<br />
technologies <strong>and</strong> implementing bestpractices<br />
that hold promise in achieving<br />
meaningful reductions in emissions.<br />
<strong>Connacher</strong> too has a role to play. Through<br />
its 13.1 megawatt natural gas-powered cogeneration<br />
facility, the installation of highlyefficient<br />
electric submersible pumps, <strong>and</strong><br />
its solvent co-injection process, <strong>Connacher</strong><br />
continues to press forward with initiatives<br />
that result in a more efficient bitumen<br />
extraction process. The more efficient the<br />
process becomes, the less energy is required<br />
in order to extract the bitumen – <strong>and</strong> that<br />
results in lower emissions.<br />
MAKE-UP WATER INTENSITY<br />
08<br />
09<br />
10<br />
11<br />
0.19<br />
0.0 0.1 0.2 0.3 0.4 0.5 0.6 0.7 0.8<br />
• ALGAR • POD 1<br />
0.36<br />
0.43<br />
0.49<br />
SUPPORTING <strong>and</strong><br />
MONITORING Wildlife<br />
0.63<br />
<strong>Connacher</strong> believes that the development<br />
of bitumen resources should not occur<br />
at the expense of the wildlife populations<br />
that inhabit its operating area. <strong>Connacher</strong><br />
continues to rely on its Wildlife Monitoring<br />
Program as a critical means by which to<br />
assess wildlife population, movement, activity<br />
<strong>and</strong> condition within its project area. Through<br />
the use of tools such as motion-activated<br />
wildlife cameras, winter track surveys,<br />
wildlife sighting cards <strong>and</strong> vehicular traffic<br />
monitors, a constant stream of valuable data<br />
is collected from within <strong>Connacher</strong>’s project<br />
area. The data undergoes a comprehensive<br />
evaluation by professional wildlife biologists<br />
<strong>and</strong> is then correlated to <strong>Connacher</strong>’s<br />
production <strong>and</strong> exploration activities<br />
within the project area in order to better<br />
underst<strong>and</strong> wildlife responses to them. Key<br />
findings are then used to influence future<br />
operating <strong>and</strong> development strategies.<br />
In <strong>2011</strong>, <strong>Connacher</strong> completed the<br />
construction of several wildlife crossing<br />
structures with the sole purpose to facilitate<br />
0.80
AR <strong>2011</strong><br />
PG 17<br />
the movement of wildlife over its aboveground<br />
pipelines. Several unique surface<br />
reclamation techniques were used in an<br />
effort to create crossings that were to<br />
appear to be as natural as the adjacent<br />
undisturbed forest. Wildlife monitoring<br />
equipment was also installed at each<br />
DISTRIBUTION OF WILDLIFE SPECIES<br />
PHOTOGRAPHED SINCE 2008<br />
• UNGULATES (moose, deer, caribou) / 47%<br />
• WOODLAND CARIBOU / 12%<br />
• LARGE PREDATOR (wolves, bear) / 15%<br />
• BIRDS / 14%<br />
• OTHER MAMMALS (squirrel, hare, beaver, mouse) / 13%<br />
• SMALL PREDATORS (fox, lynx, marten, fisher) / 10%<br />
• UNIDENTIFIABLE MAMMALS / 1%<br />
crossing so that wildlife activity adjacent<br />
to these structures can be extensively<br />
monitored over the next several years.<br />
Observations made at these crossings will<br />
provide for further refinement of the concept<br />
<strong>and</strong> the integration into <strong>Connacher</strong>’s future<br />
expansion plans.<br />
COMMITTED TO BUILDING<br />
LONG-TERM RELATIONSHIPS<br />
<strong>Connacher</strong> is committed to working with<br />
its stakeholders to develop <strong>and</strong> maintain<br />
long-term beneficial relationships.<br />
These stakeholders include a variety<br />
of individuals <strong>and</strong> businesses, such as<br />
investors, employees, community members,<br />
government <strong>and</strong> Aboriginal people that<br />
are impacted by <strong>Connacher</strong>’s operational<br />
development in Alberta. <strong>Connacher</strong><br />
continues to work closely with all<br />
stakeholders to ensure they are informed<br />
of our operations, any future development<br />
plans <strong>and</strong> our progress.<br />
In <strong>2011</strong>, <strong>Connacher</strong> completed over 200<br />
engagements with Aboriginal stakeholders.<br />
<strong>Connacher</strong>’s Environment Impact<br />
Assessment (EIA) received no statements<br />
of concern from the local Aboriginal<br />
communities in regards to a proposed<br />
expansion at Great Divide. In addition to<br />
these engagements, <strong>Connacher</strong> employees<br />
were trained in Aboriginal Awareness to<br />
recognize the impact our operations have<br />
on the surrounding communities <strong>and</strong> people.<br />
This awareness helps to better equip our<br />
employees with knowledge to maintain<br />
these favorable relationships.<br />
In addition to <strong>Connacher</strong>’s Aboriginal<br />
stakeholder initiatives, the company<br />
conducted numerous tours of its SAGD<br />
plants in <strong>2011</strong>. Participants ranged from<br />
politicians to business owners, regulatory<br />
boards <strong>and</strong> various media from within North<br />
America. Conducting these tours allows<br />
<strong>Connacher</strong> to engage its stakeholders<br />
<strong>and</strong> reinforce its commitment to building<br />
relationships with those interested <strong>and</strong><br />
impacted by our projects.<br />
CORPORATE GOVERNANCE<br />
<strong>Connacher</strong> is committed to a high st<strong>and</strong>ard<br />
of corporate governance practices. We<br />
believe good corporate governance is in the<br />
best interest of our shareholders, <strong>and</strong> that it<br />
also promotes effective decision making at<br />
all levels of the Company’s activities.<br />
The principal role of the Board of Directors<br />
is stewardship of the Company. The Board<br />
oversees the conduct of business <strong>and</strong> dayto-day<br />
management of the affairs of the<br />
Company which is delegated to the officers<br />
of the Company. To facilitate the Board of<br />
Directors in the discharge of its duties, the<br />
Board has established five committees,<br />
being the Audit Committee, Governance<br />
Committee, Health, Safety <strong>and</strong> Environment<br />
Committee, Human Resources Committee<br />
<strong>and</strong> Reserves Committees. All committees<br />
are comprised of at least a majority of<br />
independent directors.<br />
In its pursuit of effective governance,<br />
<strong>Connacher</strong> is mindful of prevailing<br />
recommendations with respect to best<br />
practices as advanced by Canadian<br />
regulatory authorities, non-regulatory<br />
organizations <strong>and</strong> other st<strong>and</strong>ards which are<br />
advanced from time to time by institutional<br />
<strong>and</strong> other investors. We comply with<br />
the objectives <strong>and</strong> guidelines relating to<br />
corporate governance adopted by the<br />
Canadian Securities Administrators <strong>and</strong> the<br />
Toronto Stock Exchange. A full examination<br />
of our corporate governance policies will be<br />
provided in our Management Proxy Circular,<br />
which will be filed on SEDAR (www.sedar.<br />
com) <strong>and</strong> mailed to all shareholders in<br />
connection with our 2012 annual meeting<br />
of shareholders.
AR <strong>2011</strong><br />
PG 18<br />
MANAGEMENT<br />
Colin M. Evans<br />
Interim co-Managing Director<br />
Brenda G. Hughes<br />
Chief Financial Officer<br />
Kelly J. Ogle<br />
Interim co-Managing Director<br />
Merle D. Johnson<br />
Vice President, <strong>Oil</strong> S<strong>and</strong>s<br />
BOARD OF DIRECTORS<br />
D. Hugh Bessell<br />
Jennifer K. Kennedy<br />
Gregory A. Bol<strong>and</strong><br />
Garry P. Mihaichuk<br />
Peter D. Sametz<br />
Interim Chief Executive Officer<br />
Stephen A. Marston<br />
Vice President,<br />
Exploration, L<strong>and</strong>, A & D<br />
Colin M. Evans<br />
Kelly J. Ogle<br />
Jesse J. Beaudry<br />
Vice President, Sustainability<br />
W.C. (Mike) Seth<br />
FORWARD-LOOKING INFORMATION<br />
This report contains forward-looking information including<br />
but not limited to, anticipated future operating <strong>and</strong><br />
financial results, anticipated capital expenditures for 2012,<br />
anticipated impact of <strong>Connacher</strong>’s integrated approach on<br />
risk mitigation, anticipated impact of the Company’s reserve<br />
base on success <strong>and</strong> value enhancement, timing of receipt<br />
of regulatory approval for the Great Divide expansion<br />
project, the future price of bitumen <strong>and</strong> natural gas, wellhead<br />
pricing <strong>and</strong> future differentials, future liquidity, new projects<br />
which may be undertaken once cash flow becomes available<br />
<strong>and</strong> the impact such projects may have on production <strong>and</strong><br />
netbacks, the potential impact that full implementation of<br />
SAGD+ could have on bitumen production <strong>and</strong> allocation of<br />
steam to wells, the future expansion of leased rail cars <strong>and</strong><br />
new market opportunities.<br />
Statements relating to “reserves” <strong>and</strong> “resources” are<br />
deemed to be forward-looking statements, as they involved<br />
the implied assessment, based on certain estimates <strong>and</strong><br />
assumptions, that the reserves <strong>and</strong> resources described exist<br />
in the quantities predicted or estimated, <strong>and</strong> can be profitably<br />
produced in the future. Additional information relating to the<br />
Company’s reserves <strong>and</strong> resources, including the risks <strong>and</strong><br />
uncertainties <strong>and</strong> assumptions related thereto, are described<br />
in further detail in <strong>Connacher</strong>’s Annual Information Form<br />
for the year ended December 31, <strong>2011</strong> (the “AIF) which is<br />
available at www.sedar. com.<br />
Forward-looking information is based on management’s<br />
expectations regarding future growth, results of operations,<br />
production, future commodity prices <strong>and</strong> foreign exchange<br />
rates, future capital <strong>and</strong> other expenditures (including the<br />
amount, nature <strong>and</strong> sources of funding thereof), plans for<br />
<strong>and</strong> results of drilling activity, environmental matters, business<br />
prospects <strong>and</strong> opportunities <strong>and</strong> future economic conditions.<br />
Forward-looking information involves significant known <strong>and</strong><br />
unknown risks <strong>and</strong> uncertainties, which could cause actual<br />
results to differ materially from those anticipated. These<br />
risks include, but are not limited to operational risks in<br />
development, exploration, production <strong>and</strong> startup activities;<br />
delays or changes in plans with respect to exploration or<br />
development projects or capital expenditures; the uncertainty<br />
of reserve <strong>and</strong> resource estimates; the uncertainty of<br />
estimates <strong>and</strong> projections relating to production, costs<br />
<strong>and</strong> expenses, <strong>and</strong> health, safety <strong>and</strong> environmental<br />
risks; the risk of commodity price <strong>and</strong> foreign exchange<br />
rate fluctuations; risks associated with the impact of<br />
general economic conditions; sales volumes <strong>and</strong> risks <strong>and</strong><br />
uncertainties associated with securing <strong>and</strong> maintaining the<br />
necessary regulatory approvals <strong>and</strong> financing to proceed<br />
with the continued expansion of the Great Divide oil s<strong>and</strong>s<br />
project. Additional risks <strong>and</strong> uncertainties are described in<br />
<strong>Connacher</strong>’s AIF.<br />
Although <strong>Connacher</strong> believes that the expectations in such<br />
forward-looking information are reasonable, there can be no<br />
assurance that such expectations shall prove to be correct.<br />
The forward-looking information included in this report is<br />
expressly qualified in its entirety by this cautionary statement.<br />
The forward-looking information included in this report is<br />
made as of March 16, 2012 <strong>and</strong> <strong>Connacher</strong> assumes no<br />
obligation to update or revise any forward-looking information<br />
to reflect new events or circumstances, except as required<br />
by law.<br />
Per barrel of oil equivalent (boe) amounts have been<br />
calculated using a conversion rate of six thous<strong>and</strong> cubic feet<br />
of natural gas to one barrel of crude oil (6:1). The conversion<br />
is based on an energy equivalency conversion method<br />
primarily applicable to the burner tip <strong>and</strong> does not represent<br />
a value equivalency at the wellhead. Boes may be misleading,<br />
particularly if used in isolation. Additionally, given the value<br />
ratio based on the current price of crude oil as compared<br />
to natural gas is significantly different from the energy<br />
equivalency of 6:1, utilizing a conversion ratio of 6:1 may be<br />
misleading as an indication of value.
AR <strong>2011</strong><br />
PG 19<br />
MANAGEMENT’S DISCUSSION AND ANALYSIS<br />
This Management’s Discussion <strong>and</strong> Analysis (“MD&A”) for <strong>Connacher</strong> <strong>Oil</strong> <strong>and</strong> <strong>Gas</strong> Limited (“<strong>Connacher</strong>” or the “company” ” or “we” or “our”) is dated<br />
March 15, 2012 <strong>and</strong> should be read in conjunction with <strong>Connacher</strong>’s consolidated financial statements for the years ended December 31, <strong>2011</strong><br />
(“YTD <strong>2011</strong>”) <strong>and</strong> December 31, 2010 (“YTD 2010”).<br />
The consolidated financial statements <strong>and</strong> comparative information have been prepared in accordance with International Financial Reporting<br />
St<strong>and</strong>ard (“IFRS”) 1, “First-time Adoption of International Financial Reporting St<strong>and</strong>ards” as issued by the International Accounting St<strong>and</strong>ards<br />
Board. In this MD&A, the term “previous GAAP” refers to Canadian generally accepted accounting principles prior to the adoption of IFRS.<br />
Unless otherwise noted, 2010 comparative information has been prepared in accordance with IFRS, which now comprises Canadian GAAP.<br />
The adoption of IFRS has not had any material impact on the company’s operations or strategic directions. The most significant area of impact<br />
was the adoption of the IFRS upstream oil <strong>and</strong> gas accounting principles. Further information on the IFRS impacts is provided in the Accounting<br />
Policies <strong>and</strong> Estimates Section of this MD&A.<br />
Please read the Advisory section of the MD&A which provides information on Forward-Looking Statements, Non-GAAP measurements<br />
<strong>and</strong> other information. Additional information relating to <strong>Connacher</strong>, including <strong>Connacher</strong>’s Annual Information Form (“AIF”), can be found<br />
on SEDAR at www.sedar.com or on the company’s website at www.connacheroil.com.<br />
<strong>2011</strong> OVERVIEW<br />
<strong>Connacher</strong> is a Calgary-based integrated energy company. We explore for, develop <strong>and</strong> produce bitumen, crude oil, natural gas <strong>and</strong> natural gas liquids<br />
in Canada, our upstream business segment. We also own <strong>and</strong> operate a heavy oil refinery in Great Falls, Montana through our wholly owned subsidiary<br />
Montana Refining Company, Inc. (‘‘MRCI’’), our downstream business segment. The refinery processes <strong>and</strong> refines crude oil into refined products<br />
including gasoline, jet fuel, diesel fuel/distillates, asphalt <strong>and</strong> other ancillary products. <strong>Connacher</strong>’s shares trade on the TSX under the symbol CLL.<br />
Our primary asset is our 100% ownership of bitumen reserves <strong>and</strong> production from two steam assisted gravity drainage (“SAGD”) plants, Pod<br />
One <strong>and</strong> Algar, at our Great Divide oil s<strong>and</strong>s lease block in northeastern Alberta. While SAGD bitumen production represents our greatest growth<br />
opportunity, we benefit strategically from also owning conventional production <strong>and</strong> refining assets for reasons of risk mitigation, capital requirements<br />
<strong>and</strong> regulatory process, among other factors.<br />
Our heavy crude oil refinery provides a strategic advantage because it offers a partial hedge against heavy crude oil differential price risk, provides<br />
diluent needed for our oil s<strong>and</strong>s operations <strong>and</strong> affords a beneficial window on marketing opportunities in the United States of America (“USA”) for<br />
our bitumen <strong>and</strong> dilbit (bitumen mixed with diluent).<br />
The table below shows the distribution of our gross revenue from oil s<strong>and</strong>s production, conventional production <strong>and</strong> refining for the most recent <strong>and</strong><br />
comparative reporting periods.<br />
Gross revenue<br />
<strong>and</strong> % of total gross revenue<br />
Three months ended December 31 Year ended December 31<br />
<strong>2011</strong> 2010 <strong>2011</strong> 2010<br />
($000) % ($000) % ($000) % ($000) %<br />
<strong>Oil</strong> s<strong>and</strong>s (1)(2) $ 123,150 53 $ 99,456 54 $ 443,768 49 $ 247,187 40<br />
Conventional (1) 4,330 2 8,010 4 18,494 2 34,171 6<br />
Refining (1) 107,010 45 77,435 42 441,143 49 334,165 54<br />
Total gross revenues (1)(2) $ 234,490 100 $ 184,901 100 $ 903,405 100 $ 615,523 100<br />
(1) Before eliminating intercompany transactions <strong>and</strong> before royalties.<br />
(2) Revenue from Algar included effective October 1, 2010.<br />
The increase in oil s<strong>and</strong>s gross revenue of 24 percent in Q4 <strong>2011</strong> was primarily driven by higher realized bitumen prices. <strong>Oil</strong> s<strong>and</strong>s revenue increased<br />
significantly in YTD <strong>2011</strong> compared to YTD 2010 due to the start-up of production at Algar, our second oil s<strong>and</strong>s SAGD project. Conventional gross<br />
revenue decreased in the <strong>2011</strong> periods compared to the 2010 periods primarily due to lower production as a result of the sale of certain mature<br />
producing properties. Refining revenues increased in <strong>2011</strong> periods due to higher refined products sales volumes <strong>and</strong> realized prices.<br />
<strong>Connacher</strong>’s overall objective is to create shareholder value. In <strong>2011</strong>, we accomplished our goals of monetizing non-core, mature <strong>and</strong> non-cash<br />
generating assets; reducing balance sheet risk by extending the maturity profile of, <strong>and</strong> reducing interest coupon on our long term debt <strong>and</strong> reducing<br />
our exposure to foreign exchange risk through a reduction of US denominated debt; <strong>and</strong> increasing year over year production at Great Divide.
AR <strong>2011</strong><br />
PG 20<br />
2012 OUTLOOK<br />
As previously announced, the company’s Board of Directors has initiated a process to review <strong>Connacher</strong>’s business plan <strong>and</strong> to identify, examine <strong>and</strong><br />
consider all strategies available to the company, both near <strong>and</strong> long term, in order to prudently determine the optimal course of action for the company.<br />
Goldman Sachs <strong>and</strong> RBC Capital Markets have been engaged to assist the Board of Directors in connection with this strategic review. The company<br />
has a number of capital projects with very good economics that are expected to increase production <strong>and</strong>/or improve netbacks. These projects will<br />
continue to be evaluated during this period <strong>and</strong> will be undertaken when free cash flow is available.<br />
Externally there is great uncertainty in the capital <strong>and</strong> debt markets which creates volatility in oil prices <strong>and</strong> oil price differentials. We remain bullish<br />
regarding the long term price of bitumen, but we also recognize that during the second quarter there will be continued pressure on differentials <strong>and</strong><br />
therefore bitumen wellhead pricing. The price of natural gas is a key component in the company’s oil s<strong>and</strong>s operations (natural gas is the biggest cost<br />
component in the generation of steam) <strong>and</strong> is expected to remain low for the remainder of the year. Locally, the Alberta corridor continues to be a “bubble”<br />
with regard to costs of services, fabrication of equipment <strong>and</strong> access to talent. Importantly, the hiatus in our capital spending provided time to determine<br />
more cost effective if not local solutions. The ever-increasing focus on oil s<strong>and</strong>s by the media, stakeholders <strong>and</strong> governments has resulted in exp<strong>and</strong>ed,<br />
not streamlined, approval processes. Effective leadership on both sides of the border will be necessary to drive efficient <strong>and</strong> economic outcomes.<br />
<strong>Connacher</strong> is focused on delivering successive <strong>and</strong> sustained improvement in operating <strong>and</strong> financial results <strong>and</strong> liquidity. Based on currently available<br />
information <strong>and</strong> prevailing commodity prices, we anticipate 2012 results to reflect solid operational performance given capital constraints.<br />
As a means of managing the risk of commodity price volatility, we monitor crude oil markets <strong>and</strong> enter into risk management commodity sales<br />
contracts from time to time to ensure the company has adequate downside commodity price protection, having regard to its established hedging<br />
policy, financial leverage <strong>and</strong> capital commitments.<br />
2012 CAPITAL EXPENDITURE BUDGET AND PRODUCTION GUIDANCE<br />
Our 2012 capital budget has been set at $50 million as outlined below, including the previously announced maintenance capital budget of<br />
$37 million. The company is proceeding with preparatory work on several sustaining <strong>and</strong> growth projects, including a five- well core hole<br />
program to provide further technical data for the Great Divide expansion project <strong>and</strong> Pad 104 drilling program (Pod One), preparatory lease<br />
work <strong>and</strong> equipment pre-orders for Pad 104, finalizing the design basis memor<strong>and</strong>um for the Great Divide expansion project, preparation of a<br />
commercial front-end engineering design study for the company’s SAGD+ project <strong>and</strong> expansion <strong>and</strong> upgrading of the rail <strong>and</strong> other facilities<br />
at the Montana refinery.<br />
2012 capital budget on a cash basis ($ in millions)<br />
Upstream $ 35<br />
Downstream 11<br />
Corporate 4<br />
Total 2012 capital budget on cash basis $ 50<br />
Actual capital expenditures incurred during 2012 could differ materially from these estimates – please see “Forward-Looking Information” in the<br />
Advisory section <strong>and</strong> “Risk Factors”.<br />
2012 production guidance<br />
Upstream Production (boe/d) 12,600 – 13,900<br />
Downstream Crude Charged (bbl/d) 9,150 – 10,600<br />
The 2012 production guidance provided includes provision for turnarounds at both Pod One <strong>and</strong> Algar in Q3 2012 <strong>and</strong> does not include<br />
incremental production which may be achieved from recommencement of the company’s SAGD+ project or completion of any future project.<br />
Actual production achieved during 2012 could differ materially from these estimates – please see “Forward-Looking Information” in the Advisory<br />
section <strong>and</strong> “Risk Factors”.<br />
LIQUIDITY<br />
<strong>Connacher</strong> is committed to maintaining substantial liquidity <strong>and</strong> accordingly, reported a cash position of $117.0 million at December 31, <strong>2011</strong>, up<br />
from $19.5 million a year earlier. During <strong>2011</strong>, we concluded certain key activities to increase liquidity in response to current market conditions <strong>and</strong><br />
to enable us to redeem our 4 ¾ percent $100 million Convertible Debentures when due on June 30, 2012. These <strong>2011</strong> liquidity-building initiatives<br />
follow significant developments, comprised of both asset sales <strong>and</strong> the refinancing of our long term debt. Our key liquidity-focused activities related to<br />
our asset rationalization <strong>and</strong> capital spending were as follows:<br />
• We refinanced our long-term debt in May <strong>2011</strong> which provided significantly lower interest rates <strong>and</strong> extended maturities to 2018 <strong>and</strong> 2019,<br />
without interim principal payments <strong>and</strong> without incurring any restrictive financial or maintenance covenants. The refinancing involved the timely <strong>and</strong><br />
successful sale of Secured Second Lien Senior Notes, in both US <strong>and</strong> Canadian capital markets. These notes are further described under “New<br />
Notes” in the Capital Resources section of this MD&A. Proceeds of the New Notes were used to fund a tender offer <strong>and</strong> pay associated costs<br />
to acquire previously outst<strong>and</strong>ing high coupon debt, which had been placed in the US high yield market during 2007 <strong>and</strong> 2009. In addition to
AR <strong>2011</strong><br />
PG 21<br />
reduced interest rates <strong>and</strong> anticipated annual interest expense reductions, we reduced our exposure to currency fluctuations with the placement of<br />
a portion of the New Notes in the Canadian market with payment in Canadian dollars, our reporting currency.<br />
• We were successful in increasing the size of our Revolving Credit Facility. Our overall <strong>and</strong> prospective liquidity was improved during <strong>2011</strong> by the<br />
continued availability of an upsized syndicated revolving credit facility in the amount of $100 million, on which there is only $2 million utilized to<br />
back-stop letters of credit.<br />
• We completed the sales of our mature producing conventional oil <strong>and</strong> gas properties <strong>and</strong> minor unproved l<strong>and</strong>s in Alberta <strong>and</strong> Saskatchewan <strong>and</strong><br />
the sale of our 50 percent interest in l<strong>and</strong>s at Halfway Creek, Alberta for net proceeds of $117.3 million. We also sold our investment in common<br />
shares of Gran Tierra Energy Inc. for net proceeds of $21.1 million.<br />
• We reduced our 2012 capital expenditure budget.<br />
Higher trade <strong>and</strong> accrued receivables <strong>and</strong> inventory balances as at December 31, <strong>2011</strong>, compared to December 31, 2010, are primarily due to<br />
increases in production <strong>and</strong> sales in <strong>2011</strong>. Higher trade <strong>and</strong> accrued payables as at December 31, <strong>2011</strong>, compared to December 31, 2010, reflect<br />
the timing of capital expenditure programs <strong>and</strong> interest payments.<br />
As we enter 2012, one of the company’s biggest challenges is the volatility of commodity prices <strong>and</strong> the uncertainty surrounding the US:Canadian<br />
dollar exchange rate <strong>and</strong> their combined significance to the company’s operating performance <strong>and</strong> results. There is considerable pressure on<br />
heavy crude oil pricing due to uncertainty surrounding the market impact of the Seaway pipeline reversal announcement, Bakken crude supply,<br />
transportation constraints <strong>and</strong> planned Pad IV refinery turnarounds <strong>and</strong> shutdowns. Management regularly assesses alternative hedging strategies<br />
to protect the company’s cash flow from the risk of severe downturns in crude oil prices, refined product pricing <strong>and</strong> adverse foreign exchange rate<br />
fluctuations. Although the company’s integrated business model provides some risk mitigation, it does not provide a complete hedge, particularly<br />
against commodity price volatility. The purpose of any hedging activity undertaken is to ensure more predictable cash flow availability to supplement<br />
cash balances. This allows us to continue to service <strong>and</strong> discharge indebtedness, complete capital projects <strong>and</strong> protect the credit capacity of<br />
<strong>Connacher</strong>’s oil <strong>and</strong> gas reserves in an uncertain or volatile commodity price environment.<br />
The company has WTI risk management contracts on a portion of its crude oil, gasoline <strong>and</strong> diesel sales <strong>and</strong> AECO risk management contracts on a<br />
portion of its natural gas consumption requirements. Details of these risk management contracts are provided in this MD&A. These risk management<br />
contracts are undertaken pursuant to policies adopted by the Board of Directors <strong>and</strong> having consideration for restrictions embedded in our longterm<br />
debt indenture. At December 31, <strong>2011</strong>, the company had net working capital of $16.9 million (December 31, 2010 – $138.6 million), including<br />
$117.0 million of cash (December 31, 2010 – $19.5 million) <strong>and</strong> after deducting the company’s current portion of long-term debt of $102.0 million<br />
(December 31, 2010 – nil).<br />
SELECT <strong>ANNUAL</strong> INFORMATION<br />
($000 except per share amounts) <strong>2011</strong> 2010 2009 (1)<br />
Revenue, net of royalties $ 872,806 $ 589,931 $ 449,789<br />
Adjusted EBITDA (2) 129,871 92,206 37,268<br />
Net earnings (loss) (114,105) (44,669) 26,158<br />
Net earnings (loss) per share - basic <strong>and</strong> diluted (0.25) (0.10) 0.08<br />
Additions to property, plant <strong>and</strong> equipment <strong>and</strong><br />
163,428 259,165 322,064<br />
exploration <strong>and</strong> evaluation assets<br />
Total assets 1,605,626 1,569,137 1,741,866<br />
Long-term debt $ 856,068 $ 847,387 $ 876,181<br />
(1) Presented in accordance with previous GAAP as reported previously in the respective financial statements.<br />
(2) Adjusted EBITDA is a non-GAAP measure, which is defined in the Advisory section of the MD&A.<br />
In <strong>2011</strong>, higher revenue in both the upstream <strong>and</strong> downstream segments contributed to a 48 percent increase in the total net revenue compared<br />
to 2010. Upstream revenue increased by 65 percent, primarily as result of a 62 percent increase in bitumen sales volumes (13,276 bbl/d in <strong>2011</strong><br />
compared to 8,206 bbl/d in 2010) as a result of the commissioning of the company’s second oil s<strong>and</strong>s project, Algar, <strong>and</strong> the inclusion of its<br />
operating results from October 1, 2010. In addition, higher weighted average upstream sales prices ($47.41/boe in <strong>2011</strong> compared to $44.13/boe<br />
in 2010) contributed to increased revenue in <strong>2011</strong> compared to 2010. This was primarily due to higher benchmark crude oil prices, partially offset<br />
by wider heavy crude oil differentials resulting from pipeline disruptions <strong>and</strong> other factors. Downstream revenue increased by 32 percent in <strong>2011</strong>,<br />
compared to 2010, due to an 11 percent increase in sales volume (11,141 bbl/d in <strong>2011</strong> compared to 10,080 bbl/d in 2010) <strong>and</strong> a 19 percent<br />
increase in the weighted average sales price of refined petroleum products sold ($105.46/bbl in <strong>2011</strong> compared to $88.68/bbl in 2010).<br />
In 2010, revenue increased by 31 percent compared to 2009 primarily due to higher sales volume in oil s<strong>and</strong>s operations coupled with higher<br />
commodity prices in both upstream <strong>and</strong> downstream segments.<br />
In <strong>2011</strong>, adjusted EBITDA increased 41 percent compared to 2010, primarily due to higher upstream <strong>and</strong> downstream netbacks. Similarly, higher<br />
netbacks in both segments contributed to an increase in adjusted EBITDA in 2010 compared to 2009.<br />
Notwithst<strong>and</strong>ing higher adjusted EBITDA, the company incurred a net loss of $114.1 million in <strong>2011</strong> compared to net loss of $44.7 million in 2010.
AR <strong>2011</strong><br />
PG 22<br />
This was primarily due to lower foreign exchange gains, higher depletion, depreciation, amortization <strong>and</strong> impairment <strong>and</strong> higher financing related costs<br />
partially offset by gains on sale of assets <strong>and</strong> risk management contracts.<br />
The company incurred capital expenditures of $163.4 million in <strong>2011</strong> compared to $259.2 million in 2010. Reduced capital expenditures in <strong>2011</strong><br />
were primarily due to the completion of the Algar plant in 2010.<br />
The company completed the refinancing of its long-term debt in <strong>2011</strong> to reduce cash interest, extend maturities <strong>and</strong> reduce exposure to foreign<br />
exchange rate fluctuations. As a result, the long-term debt balance was increased in <strong>2011</strong> compared to 2010 to fund the redemption premium paid<br />
for the refinancing of the long-term debt.<br />
Although the face value of our long-term debt did not change in 2010 compared to 2009, its carrying value decreased in 2010 due to the effect of<br />
translation to a Canadian dollar equivalent of our US-dollar denominated long-term debt, at a stronger Canadian dollar exchange rate as at December<br />
31, 2010 compared to its level at December 31, 2009. The majority of the company’s long-term debt was previously denominated in US dollars.<br />
FINANCIAL AND OPERATING REVIEW<br />
UPSTREAM - CANADA<br />
SALES AND PRODUCTION VOLUMES (1) Three months ended December 31 Year ended December 31<br />
<strong>2011</strong> 2010 % Change <strong>2011</strong> 2010 % Change<br />
Dilbit sales – bbl/d (2) 17,278 17,442 (1) 17,165 11,012 56<br />
Diluent used – bbl/d (2) (4,024) (4,573) (12) (3,889) (2,806) 39<br />
Bitumen sold – bbl/d (2) 13,254 12,869 3 13,276 8,206 62<br />
Crude oil – bbl/d 417 873 (52) 427 883 (52)<br />
Natural gas – Mcf/d 2,955 8,318 (64) 4,124 9,100 (55)<br />
Total sales volumes – boe/d 14,164 15,128 (6) 14,390 10,606 36<br />
Total production volumes – boe/d (3) 14,083 15,498 (9) 14,493 10,699 35<br />
(1) Effective October 1, 2010, the capitalized costs relating to the company’s second oil s<strong>and</strong>s project, Algar, were subjected to depletion <strong>and</strong> the revenues, expenses <strong>and</strong> finance charges associated with<br />
the project were reported in the statement of operations. Prior thereto, Algar was considered a major development project under construction <strong>and</strong> all costs, including related financing costs <strong>and</strong> operating<br />
expenses net of revenue were capitalized. Accordingly, the above table does not include production <strong>and</strong> sales volumes for Algar prior to October 1, 2010.<br />
(2) Bitumen produced at our oil s<strong>and</strong>s project is mixed with purchased diluent <strong>and</strong> sold as “dilbit”. Diluent is a light hydrocarbon that improves the marketing <strong>and</strong> transportation quality of bitumen. Diluent volumes<br />
used have been deducted in calculating bitumen production <strong>and</strong> sales volumes.<br />
(3) The company’s bitumen sales volumes differ from its production volumes due to changes in inventory <strong>and</strong> other product losses.<br />
In Q4 <strong>2011</strong>, bitumen sold includes the impact of our pilot SAGD+ project at our two well pads in Great Divide. Diluent used in Q4 <strong>2011</strong> decreased by<br />
12 percent compared to Q4 2010, which reflects both the impact of this project <strong>and</strong> the impact of first quarter production at Algar in 2010. Bitumen<br />
sold increased 62 percent in YTD <strong>2011</strong> compared to YTD 2010, primarily due to the startup of, Algar booked effective October 1, 2010.<br />
In Q4 <strong>2011</strong> <strong>and</strong> YTD <strong>2011</strong>, conventional production <strong>and</strong> sales volumes declined compared to the 2010 periods primarily due to the property sales<br />
early in the year, partially offset by new production coming on stream from our resource plays.<br />
COMMODITY PRICES AND RISK MANAGEMENT<br />
Three months ended December 31 Year ended December 31<br />
Average benchmark prices <strong>2011</strong> 2010 % <strong>2011</strong> 2010 %<br />
West Texas Intermediate (WTI) crude oil US$/barrel at Cushing $ 94.05 $ 85.16 10 $ 95.14 $ 79.51 20<br />
Heavy <strong>Oil</strong> Differential – C$/bbl (1) 10.70 18.35 (42) 16.95 14.69 15<br />
Western Canadian Select (WCS) C$/bbl 85.53 67.87 26 77.15 67.23 15<br />
Edmonton C5 (C$/bbl) (1) 111.36 86.24 29 104.21 84.23 24<br />
Natural <strong>Gas</strong> (Alberta spot) C$/Mcf at AECO 3.40 3.61 (6) 3.56 3.98 (11)<br />
Average realized prices (2)(3)<br />
Bitumen - C$/bbl 53.04 45.08 18 47.59 45.65 4<br />
Crude oil - C$/bbl 89.57 66.72 34 82.44 65.63 26<br />
Natural gas - C$/Mcf 3.27 3.44 (5) 3.70 3.90 (5)<br />
Weighted average sales price – C$/boe (4) $ 52.96 $ 44.09 20 $ 47.41 $ 44.13 7<br />
Weighted average sales price, including realized gains/loss on risk<br />
management contracts – C$/boe (2) (4) $ 52.29 $ 42.89 22 $ 45.67 $ 43.68 5<br />
(1) Heavy oil differential refers to the WCS discount to WTI; Edmonton C5 is the benchmark price for diluent.<br />
(2) Based on sales volume <strong>and</strong> calculated before royalties <strong>and</strong> after blending <strong>and</strong> transportation costs.<br />
(3) Before risk management contract gains or losses.<br />
(4) Boe is defined in the Advisory section of the MD&A.
AR <strong>2011</strong><br />
PG 23<br />
<strong>Connacher</strong>’s bitumen production slate is a heavy gravity crude oil. Consequently, the bitumen selling prices realized by the company are lower than the<br />
WTI reference price. This difference is commonly referred to as the “heavy oil differential” as applied to crude oil prices. Actual realized bitumen prices<br />
are a calculated amount derived by deduction from diluted bitumen (“dilbit”) sales prices of such items as the cost of diluent, transportation charges for<br />
both diluent from purchase points to our Great Divide site <strong>and</strong> for dilbit from our Great Divide site to market. Other factors which influence calculated<br />
bitumen prices include the relative value of the Canadian dollar, the blend ratio <strong>and</strong> quality differentials.<br />
In YTD <strong>2011</strong>, higher realized bitumen prices were driven by higher benchmark WTI prices partially offset by wider heavy oil differentials, higher diluent<br />
costs <strong>and</strong> higher transportation charges necessitated by the need to utilize transportation alternatives <strong>and</strong> more distant markets because of pipeline<br />
apportionment <strong>and</strong> other issues. The heavy oil differential discount widened in <strong>2011</strong> due to market dem<strong>and</strong> <strong>and</strong> supply issues for heavy crude relative<br />
to lighter crude, attributed primarily to USA refinery needs <strong>and</strong> pipeline disruptions or other bottlenecks that limited the transportation capacity for<br />
heavy crude oil to the USA.<br />
Higher realized conventional crude oil pricing in <strong>2011</strong> resulted from generally higher market oil prices <strong>and</strong> an increased weighting of a lighter crude<br />
oil as a result of disposing of our medium gravity Saskatchewan oil properties <strong>and</strong> adding new light gravity crude oil production from our resource<br />
plays. The change in realized natural gas prices in <strong>2011</strong> was consistent with the change in benchmark prices.<br />
Dilbit, crude oil <strong>and</strong> natural gas are generally sold on month-to-month sales contracts at prices negotiated with major Canadian or USA marketers,<br />
refiners, regional upgraders or other end users, by reference to various benchmark prices, including WTI market prices for crude oil <strong>and</strong> AECO<br />
market prices for natural gas. <strong>Connacher</strong> maintains various short-term contracts for the sale of dilbit to a variety of heavy oil purchasers in central <strong>and</strong><br />
northern Alberta. In order to secure diluent supplies, <strong>Connacher</strong> also utilizes short-term diluent purchase contracts <strong>and</strong> acquires certain volumes from<br />
its own refinery at Great Falls, Montana.<br />
As a means of managing the risk of commodity price volatility, management monitors crude oil markets <strong>and</strong> enters into risk management commodity<br />
sales contracts from time to time to ensure <strong>Connacher</strong> has adequate downside commodity price protection, having regard to its established hedging<br />
policy, financial leverage <strong>and</strong> capital commitments. Our hedging program is administered by a management subcommittee comprised of appropriate<br />
departmental representatives.<br />
The company recorded unrealized <strong>and</strong> realized losses of $23.7 million <strong>and</strong> $0.9 million, respectively, in Q4 <strong>2011</strong> (Q4 2010 – an unrealized <strong>and</strong><br />
realized loss of $16.3 million <strong>and</strong> $1.7 million, respectively) <strong>and</strong> for the YTD <strong>2011</strong>, the company recorded an unrealized gain of $7.2 million <strong>and</strong> a<br />
realized loss of $9.2 million (YTD 2010 – an unrealized loss of $13.6 million <strong>and</strong> a realized loss of $1.7 million) on the risk management contracts.<br />
Currently, the company has the following WTI crude oil price risk management contracts in place:<br />
Volume (bbl/d)<br />
Type Pricing (WTI US$/bbl) Q1 2012 Q2 2012 Q3 2012 Q4 2012 Year 2013<br />
Swap $90.60 2,000 2,000 2,000 2,000 -<br />
Swap $90.50 - - 1,000 1,000 -<br />
Swap $109.40 - 1,000 - - -<br />
Collar Call $96.00 Put $80.00 2,000 - - - -<br />
Collar Call $100.00 Put $80.00 2,000 2,000 - - -<br />
Collar Call $120.00 Put $80.00 2,000 2,000 2,000 2,000 -<br />
Collar Call $98.00 Put $80.00 - - 1,000 1,000 -<br />
Collar Call $118.00 Put $100.00 - - 1,000 - -<br />
Collar Call $116.50 Put $100.00 - - - 1,000 -<br />
Collar Call $118.30 Put $90.00 - - - - 300<br />
Collar Call $117.80 Put $90.00 - - - - 1,000<br />
8,000 7,000 7,000 7,000 1,300
AR <strong>2011</strong><br />
PG 24<br />
UPSTREAM REVENUE (1)<br />
Three months ended December 31 <strong>2011</strong> 2010<br />
($000 except per unit amounts) <strong>Oil</strong> s<strong>and</strong>s Crude oil Natural gas Total <strong>Oil</strong> s<strong>and</strong>s Crude oil Natural gas Total<br />
Gross upstream revenues (2) $ 123,150 $ 3,441 $ 889 $ 127,480 $ 99,456 $ 5,377 $ 2,633 $ 107,466<br />
Diluent costs (3) (43,727) - - (43,727) (37,810) - - (37,810)<br />
Transportation costs (14,741) (3) - (14,744) (8,273) (15) (1) (8,289)<br />
Revenues $ 64,682 $ 3,438 $ 889 $ 69,009 $ 53,373 $ 5,362 $ 2,632 $ 61,367<br />
Price ($ per bbl / Mcf / boe) (4) $ 53.04 $ 89.57 $ 3.27 $ 52.96 $ 45.08 $ 66.72 $ 3.44 $ 44.09<br />
Year ended December 31 <strong>2011</strong> 2010<br />
($000 except per unit amounts) <strong>Oil</strong> s<strong>and</strong>s Crude oil Natural gas Total <strong>Oil</strong> s<strong>and</strong>s Crude oil Natural gas Total<br />
Gross upstream revenues (2) $ 443,768 $ 12,929 $ 5,565 $ 462,262 $ 247,187 $ 21,229 $ 12,942 $ 281,358<br />
Diluent costs (3) (162,410) - - (162,410) (91,644) - - (91,644)<br />
Transportation costs (50,757) (81) - (50,838) (18,806) (66) (1) (18,873)<br />
Revenues $ 230,601 $ 12,848 $ 5,565 $ 249,014 $ 136,737 $ 21,163 $ 12,941 $ 170,841<br />
Price ($ per bbl / Mcf / boe) (4) $ 47.59 $ 82.44 $ 3.70 $ 47.41 $ 45.65 $ 65.63 $ 3.90 $ 44.13<br />
(1) Effective October 1, 2010, the capitalized costs relating to the company’s second oil s<strong>and</strong>s project, Algar, were subjected to depletion <strong>and</strong> the revenues, expenses <strong>and</strong> finance charges associated with<br />
the project were reported in the statement of operations. Prior thereto, Algar was considered a major development project under construction <strong>and</strong> all costs, including related financing costs <strong>and</strong> operating<br />
expenses net of revenue were capitalized. Accordingly, the above table does not include operating results for Algar prior to October 1, 2010.<br />
(2) Bitumen produced at our oil s<strong>and</strong>s project is mixed with purchased diluent <strong>and</strong> sold as “dilbit”. Gross revenues represent sales of dilbit, crude oil <strong>and</strong> natural gas <strong>and</strong> are presented before royalties. In the<br />
consolidated financial statements, upstream revenues are presented net of royalties.<br />
(3) The cost of diluent has been deducted from gross revenues in calculating revenues, above, whereas the diluent costs have been included in “Blending <strong>and</strong> costs of product sold” in the consolidated financial<br />
statements. Diluent costs, above, include purchases of $3.8 million <strong>and</strong> $15.2 million from our subsidiary, MRCI in Q4 <strong>2011</strong> <strong>and</strong> YTD <strong>2011</strong>, respectively (Q1 2010 <strong>and</strong> YTD 2010 - $3.8 million <strong>and</strong> $14.3<br />
million, respectively) at market prices. These intercompany transactions have been eliminated in our consolidated financial statements.<br />
(4) Per unit prices are calculated using revenues divided by bitumen, crude oil <strong>and</strong> natural gas actual volumes sold.<br />
The bitumen produced by <strong>Connacher</strong> requires blending to reduce its viscosity in order to transfer the bitumen to market. Diluent used represented<br />
approximately 23 percent of the dilbit barrel sold in Q4 <strong>2011</strong> <strong>and</strong> YTD <strong>2011</strong> (26 percent in Q4 2010 <strong>and</strong> 25 percent in YTD 2010). In <strong>2011</strong>, we<br />
purchased 3,889 bbl/d of diluent at $114.41 per bbl, including transportation costs, compared to 2,806 bbl/d at $89.48 per barrel for the same<br />
period last year. The cost of blending diluent is recovered at the sale price of the blended product.<br />
Transportation costs represent costs to transport dilbit <strong>and</strong> crude oil to customers. Transportation costs increased by 78 percent in Q4 <strong>2011</strong><br />
compared to Q4 2010 <strong>and</strong> 169 percent in YTD <strong>2011</strong> compared to YTD 2010, due to increased bitumen sales volumes as wells as higher trucking<br />
costs resulting from both industry cost pressures <strong>and</strong> increased long-haul trucking to markets in <strong>2011</strong> arising from sales market disruptions.<br />
Additionally, we commenced railing dilbit to new USA markets to alleviate downstream barriers, to access new sales markets that are less connected<br />
to current WTI/WCS pricing levels <strong>and</strong> which give evidence of being more aligned with higher Brent oil pricing. In conjunction with our goal of<br />
optimizing netbacks, railing dilbit is a part of our marketing diversification strategy, primarily aimed at mitigating the risk of plant curtailment due to any<br />
inability to sell production in congested markets, combined with minimal on-site storage facilities. Transportation <strong>and</strong> marketing costs for <strong>2011</strong> also<br />
include the carrying cost of temporary storage facilities secured in Tacoma, Washington during the year.<br />
ROYALTIES (1)<br />
Three months ended December 31 <strong>2011</strong> 2010<br />
($000 except per unit amounts) <strong>Oil</strong> s<strong>and</strong>s Crude oil Natural gas Total <strong>Oil</strong> s<strong>and</strong>s Crude oil Natural gas Total<br />
Royalties $ 3,772 $ 544 $ (98) $ 4,218 $ 2,188 $ 1,587 $ 70 $ 3,845<br />
Royalties ($ per bbl / Mcf / boe) (2) $ 3.09 $ 14.17 $ (0.36) $ 3.24 $ 1.85 $ 19.76 $ 0.09 $ 2.76<br />
Year ended December 31 <strong>2011</strong> 2010<br />
($000 except per unit amounts) <strong>Oil</strong> s<strong>and</strong>s Crude oil Natural gas Total <strong>Oil</strong> s<strong>and</strong>s Crude oil Natural gas Total<br />
Royalties $ 13,740 $ 2,556 $ (938) $ 15,358 $ 5,440 $ 5,713 $ 172 $ 11,325<br />
Royalties ($ per bbl / Mcf / boe) (2) $ 2.83 $ 16.40 $ (0.62) $ 2.92 $ 1.82 $ 17.72 $ 0.05 $ 2.93<br />
(1) Effective October 1, 2010, the capitalized costs relating to the company’s second oil s<strong>and</strong>s project, Algar, were subjected to depletion <strong>and</strong> the revenues, expenses <strong>and</strong> finance charges associated with<br />
the project were reported in the statement of operations. Prior thereto, Algar was considered a major development project under construction <strong>and</strong> all costs, including related financing costs <strong>and</strong> operating<br />
expenses net of revenue were capitalized. Accordingly, the above table does not include operating results for Algar prior to October 1, 2010.<br />
(2) Per unit royalties are calculated using royalties divided by bitumen, crude oil <strong>and</strong> natural gas actual volumes sold.<br />
Royalties represent charges against production or revenue by governments <strong>and</strong> l<strong>and</strong>owners. From period to period, royalties vary due to changes in the<br />
product mix, the components of which are subject to different royalty rates. Additionally, royalty rates are applied on a sliding scale to commodity prices.<br />
Royalties in Q4 <strong>2011</strong> <strong>and</strong> YTD <strong>2011</strong> increased by 10 percent <strong>and</strong> 36 percent compared to Q4 2010 <strong>and</strong> YTD 2010, respectively, primarily due to<br />
higher sales volumes <strong>and</strong> higher WTI benchmark prices on which royalties are calculated, partially offset by Alberta gas cost allowance recoveries.
AR <strong>2011</strong><br />
PG 25<br />
OPERATING COSTS (1)<br />
Three months ended December 31 <strong>2011</strong> 2010<br />
($000 except per unit amounts) <strong>Oil</strong> s<strong>and</strong>s Crude oil Natural gas Total <strong>Oil</strong> s<strong>and</strong>s Crude oil Natural gas Total<br />
Operating costs $ 23,923 $ 781 $ 560 $ 25,264 $ 22,447 $ 1,331 $ 1,145 $ 24,923<br />
Operating costs ($ per bbl / Mcf / boe) (2) $ 19.62 $ 20.35 $ 2.07 $ 19.39 $ 18.96 $ 16.57 $ 1.50 $ 17.91<br />
Year ended December 31 <strong>2011</strong> 2010<br />
($000 except per unit amounts) <strong>Oil</strong> s<strong>and</strong>s Crude oil Natural gas Total <strong>Oil</strong> s<strong>and</strong>s Crude oil Natural gas Total<br />
Operating costs $ 97,295 $ 2,929 $ 2,912 $ 103,136 $ 60,344 $ 4,407 $ 5,403 $ 70,154<br />
Operating costs ($ per bbl / Mcf / boe) (2) $ 20.08 $ 18.80 $ 1.93 $ 19.64 $ 20.15 $ 13.67 $ 1.63 $ 18.12<br />
(1) Effective October 1, 2010, the capitalized costs relating to the company’s second oil s<strong>and</strong>s project, Algar, were subjected to depletion <strong>and</strong> the revenues, expenses <strong>and</strong> finance charges associated with<br />
the project were reported in the statement of operations. Prior thereto, Algar was considered a major development project under construction <strong>and</strong> all costs, including related financing costs <strong>and</strong> operating<br />
expenses net of revenue were capitalized. Accordingly, the above table does not include operating results for Algar prior to October 1, 2010.<br />
(2) Per unit costs are calculated using operating costs divided by bitumen, crude oil <strong>and</strong> natural gas actual volumes sold.<br />
Total oil s<strong>and</strong>s operating costs increased by 7 percent in Q4 <strong>2011</strong> compared to Q4 2010, reflecting general industry cost conditions <strong>and</strong> increased by<br />
61 percent in YTD <strong>2011</strong> compared to YTD 2010 due to the incremental production at Algar. Operating costs in <strong>2011</strong> also include incremental costs<br />
related to our SAGD+ pilot project.<br />
The table below summarizes information related to our oil s<strong>and</strong>s operating costs:<br />
Three months ended December 31 Year ended December 31<br />
<strong>2011</strong> 2010 <strong>2011</strong> 2010<br />
($000) ($ per bbl) ($000) ($ per bbl) ($000) ($ per bbl) ($000) ($ per bbl)<br />
Natural gas costs (1) $ 6,696 5.49 $ 7,187 6.07 $ 29,263 6.04 $ 18,142 6.06<br />
Other operating costs 17,227 14.13 15,260 12.89 68,032 14.04 42,202 14.09<br />
Total oil s<strong>and</strong>s operating costs $ 23,923 $ 19.62 $ 22,447 $ 18.96 $ 97,295 $ 20.08 $ 60,344 $ 20.15<br />
(1) Excluding risk management contract gains <strong>and</strong> losses. Includes natural gas consumed by boilers at the cogeneration facility <strong>and</strong> by other vessels at Great Divide.<br />
We utilize natural gas primarily for our boilers at both plants <strong>and</strong> our cogeneration facility at Algar. In Q4 <strong>2011</strong>, the combined steam: oil ratio (“SOR”)<br />
from Pod One <strong>and</strong> Algar was 4.1 compared to 3.8 in Q4 2010. On a YTD basis, SOR was 4.0 in <strong>2011</strong> compared to 4.3 in 2010. The company had<br />
been producing high levels of steam at Algar to test the reservoir performance while in ramp-up, but recently reduced steam production without any<br />
attendant reduction of bitumen production. At Pod One, the higher SORs reflect the impact of underperforming wells on the north pad. The drilling of<br />
new wells <strong>and</strong> new technologies such as SAGD+ are anticipated to lower SORs <strong>and</strong> improve individual well <strong>and</strong> overall productivity.<br />
We commissioned our 13 megawatt cogeneration plant at Algar in 2010 <strong>and</strong> as a consequence have experienced the benefits of improved power<br />
stability in our oil s<strong>and</strong>s operations. Although this has resulted in higher natural gas utilization <strong>and</strong> related costs, it has reduced our reliance on third<br />
party power suppliers <strong>and</strong> has improved operational reliability at both Pod One <strong>and</strong> Algar.<br />
The company also recorded risk management contract losses of $1.9 million in Q4 <strong>2011</strong> <strong>and</strong> $2.5 million in YTD <strong>2011</strong> relating to AECO natural<br />
gas purchase contracts. These losses are not included in the calculation of operating costs noted in the table above. Currently, the company has the<br />
following AECO natural gas price risk management contracts:<br />
• January 1, 2012 – December 31, 2012 – 5,000 GJ/d at a minimum of AECO CAD$3.70/GJ <strong>and</strong> a maximum of AECO CAD$4.30/GJ;<br />
• January 1, 2012 – December 31, 2012 – 5,000 GJ/d at a minimum of AECO CAD$2.80/GJ <strong>and</strong> a maximum of AECO CAD$4.00/GJ;<br />
• March 1, 2012 – June 30, 2012 – 2,500 GJ/d at a minimum of AECO $1.85/GJ <strong>and</strong> a maximum of AECO $2.90/GJ; <strong>and</strong><br />
• July 1, 2012 – September 30, 2012 – 2,500 GJ/d at a minimum of AECO $1.85/GJ <strong>and</strong> a maximum of AECO $3.20/GJ.<br />
SAGD+<br />
<strong>Connacher</strong> completed a steam with solvent (SAGD+) field trial on two of its wells located on Pad 203 at Algar in <strong>2011</strong>, as a pilot project designed<br />
to enhance reservoir recovery <strong>and</strong> bitumen production, while lowering steam injection volumes. Results were encouraging, with an approximate<br />
29 percent increase in base-line bitumen production <strong>and</strong> a reduction in SOR by approximately 17 percent. The company is currently completing a<br />
commercial front-end engineering design study on this project. While solvent recoveries <strong>and</strong> related production impact have exceeded expectations,<br />
facility modifications will have to be implemented to fully capture <strong>and</strong> recycle the recovered solvent.
AR <strong>2011</strong><br />
PG 26<br />
UPSTREAM NETBACKS (1)<br />
Three months ended December 31 <strong>2011</strong> 2010<br />
($ per bbl / Mcf / boe) <strong>Oil</strong> s<strong>and</strong>s Crude oil Natural gas Total <strong>Oil</strong> s<strong>and</strong>s Crude oil Natural gas Total<br />
Revenues (2) $ 53.04 $ 89.57 $ 3.27 $ 52.96 $ 45.08 $ 66.72 $ 3.44 $ 44.09<br />
Royalties (3.09) (14.17) 0.36 (3.24) (1.85) (19.76) (0.09) (2.76)<br />
Operating costs (19.62) (20.35) (2.07) (19.39) (18.96) (16.57) (1.50) (17.91)<br />
Netbacks (3) $ 30.33 $ 55.05 $ 1.56 $ 30.33 $ 24.27 $ 30.39 $ 1.85 $ 23.42<br />
Year ended December 31, <strong>2011</strong> <strong>2011</strong> 2010<br />
($ per bbl / Mcf / boe) <strong>Oil</strong> s<strong>and</strong>s Crude oil Natural gas Total <strong>Oil</strong> s<strong>and</strong>s Crude oil Natural gas Total<br />
Revenues (2) $ 47.59 $ 82.44 $ 3.70 $ 47.41 $ 45.65 $ 65.63 $ 3.90 $ 44.13<br />
Royalties (2.83) (16.40) 0.62 (2.92) (1.82) (17.72) (0.05) (2.93)<br />
Operating costs (20.08) (18.80) (1.93) (19.64) (20.15) (13.67) (1.63) (18.12)<br />
Netbacks (3) $ 24.68 $ 47.24 $ 2.39 $ 24.85 $ 23.68 $ 34.24 $ 2.22 $ 23.08<br />
(1) Effective October 1, 2010, the capitalized costs relating to the company’s second oil s<strong>and</strong>s project, Algar, were subjected to depletion <strong>and</strong> the revenues, expenses <strong>and</strong> finance charges associated with<br />
the project were reported in the statement of operations. Prior thereto, Algar was considered a major development project under construction <strong>and</strong> all costs, including related financing costs <strong>and</strong> operating<br />
expenses net of revenue, were capitalized. Accordingly, the above table does not include operating results for Algar prior to October 1, 2010.<br />
(2) Revenues are calculated after deducting diluent <strong>and</strong> transportation costs, but before royalties <strong>and</strong> risk management contract gains or losses.<br />
(3) Netbacks are a non-GAAP measure <strong>and</strong> are defined in the Advisory section of the MD&A.<br />
DOWNSTREAM - USA<br />
<strong>Connacher</strong>’s wholly-owned subsidiary, MRCI operates a 9,500 bbl/d heavy oil refinery located in Great Falls, Montana (the “Refinery”) which is<br />
strategically aligned with our oil s<strong>and</strong>s business. It primarily processes Canadian heavy sour crude oil into a range of higher value refined petroleum<br />
products, thereby capturing more of the value chain in a produced barrel of oil. Accordingly, the Refinery provides a physical hedge for our bitumen<br />
revenue by recovering a portion of the heavy oil differential in its netbacks under normal operating conditions. In <strong>2011</strong>, the refinery margin per barrel of<br />
bitumen sold was $8.67 (2010 - $9.70 per bbl), illustrating the positive contribution to overall corporate netbacks of owning the Refinery. The Refinery<br />
is located on an approximately 73 acre site <strong>and</strong> is a fully integrated refinery with reforming, isomerization <strong>and</strong> alkylation processes for formulation of<br />
gasoline blends, hydro-treating for ultra low sulphur diesel <strong>and</strong> fluid catalytic cracking for conversion of heavy gas oils to gasoline <strong>and</strong> distillate products.<br />
Also, it is a major supplier of paving grade asphalt, polymer modified grades <strong>and</strong> asphalt emulsions for road construction. The Refinery delivers products<br />
in Montana <strong>and</strong> to neighboring regions, including, Alberta, Canada, by truck <strong>and</strong> rail transport. Upon completion of the benzene removal project currently<br />
underway, the Refinery will also be able to access the southern Alberta market for gasoline. The Refinery is also a source of supply for a portion of our<br />
diluent requirements for oil s<strong>and</strong>s operations. These intercompany purchases <strong>and</strong> sales have been eliminated on consolidation.<br />
The operating results of our Refinery are subject to a number of seasonal factors which cause production <strong>and</strong> sales to vary throughout the year. The<br />
Refinery’s primary asphalt market is paving for road construction, which is in greater dem<strong>and</strong> during the summer. Consequently, the Refinery runs a<br />
higher proportion of lighter, higher cost crude in the October to March period to restrict asphalt production, <strong>and</strong> sales prices <strong>and</strong> volumes for asphalt<br />
are higher in the summer <strong>and</strong> lower in the colder seasons. During the winter, most of the Refinery’s asphalt production is stored in tankage for sale in<br />
the subsequent summer. Seasonal factors also affect the production <strong>and</strong> sale of gasoline, which has a higher dem<strong>and</strong> in summer months. As a result,<br />
inventory levels, sales volumes <strong>and</strong> prices can be expected to fluctuate on a seasonal basis. The Refinery has approximately one million barrels of<br />
feedstock <strong>and</strong> product tankage.<br />
REFINERY THROUGHPUT<br />
Three months ended December 31 Year ended December 31<br />
<strong>2011</strong> 2010 <strong>2011</strong> 2010<br />
Crude charged – bbl/d (1) 10,295 10,137 9,890 9,693<br />
Refinery production – bbl/d (2) 11,515 11,964 10,876 10,704<br />
Sales of refined petroleum products – bbl/d (3) 10,330 9,068 11,141 10,080<br />
Refinery utilization (4) 108% 107% 104% 102%<br />
(1) Crude charged represents the barrels per day of crude oil processed at the Refinery.<br />
(2) Refinery production represents the barrels per day of refined products yielded from processing crude <strong>and</strong> other refinery feedstock.<br />
(3) Includes refined products purchased for resale <strong>and</strong> blending.<br />
(4) Represents crude charged divided by total crude capacity of the Refinery of 9,500 bbl/d.
AR <strong>2011</strong><br />
PG 27<br />
SALES PRODUCT MIX (%)<br />
Three months ended December 31 Year ended December 31<br />
<strong>2011</strong> 2010 <strong>2011</strong> 2010<br />
<strong>Gas</strong>oline 45 49 41 45<br />
Diesel 22 17 18 16<br />
Jet fuel 4 5 5 7<br />
Asphalt 27 25 34 30<br />
Other 2 4 2 2<br />
Total 100 100 100 100<br />
In Q4 <strong>2011</strong> <strong>and</strong> YTD <strong>2011</strong>, the total sales volumes of refined petroleum products increased by 14 percent <strong>and</strong> 11 percent compared to Q4 2010<br />
<strong>and</strong> YTD 2010, respectively, primarily due to the improved stability of refining operations, more favorable weather conditions for road paving activities<br />
that buoyed higher relative asphalt sales <strong>and</strong> increased dem<strong>and</strong> for refined petroleum products in <strong>2011</strong>.<br />
COMMODITY PRICES<br />
Three months ended December 31 Year ended December 31<br />
<strong>2011</strong> 2010 % <strong>2011</strong> 2010 %<br />
Average benchmark prices<br />
West Texas Intermediate (WTI) crude oil US$/barrel at Cushing $ 94.05 $ 85.16 10 $ 95.14 $ 79.51 20<br />
Average realized crude oil input cost<br />
Crude <strong>Oil</strong> – US$/bbl at Refinery 90.05 72.00 25 84.28 69.33 22<br />
Average realized refined product prices (1)<br />
<strong>Gas</strong>oline – US$/bbl 107.56 88.35 22 112.35 87.48 28<br />
Diesel – US$/bbl 136.38 107.82 26 126.77 94.97 33<br />
Jet fuel – US$/bbl 131.23 105.18 25 133.65 96.57 38<br />
Asphalt – US$/bbl 87.77 79.22 11 87.99 81.49 8<br />
Weighted average sales price – US$ per bbl $ 108.32 $ 89.13 22 $ 106.81 $ 86.02 24<br />
Weighted average sales price, including realized gains/loss<br />
on risk management contracts – US$/bbl $ 109.43 $ 89.13 23 $ 107.06 $ 85.88 25<br />
(1) Before risk management contracts gains <strong>and</strong> losses <strong>and</strong> after transportation costs.<br />
The Refinery operates in PADD IV <strong>and</strong> is exposed to niche-like markets that resulted in above average realized refined product prices in <strong>2011</strong>. Sales<br />
of refined petroleum products are generally made on sales contracts negotiated with wholesalers, retailers <strong>and</strong> large end-users for gasoline, jet fuel<br />
<strong>and</strong> diesel <strong>and</strong> with construction contractors <strong>and</strong> road builders for asphalt. Frequently, sales contracts are for periods in excess of one month.<br />
General <strong>and</strong> local economic conditions affect refined product dem<strong>and</strong> <strong>and</strong> pricing. We anticipate they will continue to influence our downstream<br />
financial results in the future. To mitigate some of the risk of lower future gasoline <strong>and</strong> diesel selling prices <strong>and</strong> margins, the company entered<br />
into certain risk management sales contracts. In Q4 <strong>2011</strong>, the company recorded a realized <strong>and</strong> unrealized gain of $1.0 million <strong>and</strong> $5.3 million,<br />
respectively (Q4 2010 - $nil). In YTD <strong>2011</strong>, the company recorded a realized <strong>and</strong> unrealized gain of $1.0 million <strong>and</strong> $5.6 million, respectively (YTD<br />
2010 - realized loss of $543,000). Currently, the following risk management contracts in place:<br />
• <strong>Gas</strong>oline swap – January 1, 2012 – March 31, 2012 – 1,000 bbl/d at WTI per barrel plus US$27.50/bbl;<br />
• Diesel swap – January 1, 2012 – December 31, 2012 – 1,000 bbl/d at WTI per barrel plus US$32.25/bbl;<br />
• <strong>Gas</strong>oline swap – April 1, 2012 – June 30, 2012 – 1,000 bbl/d at WTI per barrel plus US$21.25/bbl;<br />
• <strong>Gas</strong>oline swap – April 1, 2012 – June 30, 2012 – 815 bbl/d at WTI per barrel plus US$23.00/bbl.<br />
DOWNSTREAM REVENUE<br />
Three months ended December 31 Year ended December 31<br />
<strong>2011</strong> 2010 <strong>2011</strong> 2010<br />
Gross revenue (1) ($000) $ 107,010 $ 77,435 $ 441,143 $ 334,165<br />
Transportation <strong>and</strong> h<strong>and</strong>ling cost (2) ($000) (1,899) (2,905) (12,282) (7,899)<br />
Downstream revenue ($000) $ 105,111 $ 74,530 $ 428,861 $ 326,266<br />
Weighted average sales price ($ per bbl) (3) $ 110.60 $ 90.32 $ 105.47 $ 88.68<br />
(1) Includes intersegment sales of $3.8 million in Q4 <strong>2011</strong> <strong>and</strong> $15.2 million in YTD <strong>2011</strong> ($3.8 million in Q4 2010 <strong>and</strong> $14.3 million in YTD 2010), which were transacted at prevailing market prices <strong>and</strong> have<br />
been eliminated from the consolidated financial statements. The costs of these sales were $3.5 million in Q4 <strong>2011</strong> <strong>and</strong> $13.7 million in YTD <strong>2011</strong> ($3.4 million in Q4 2010 <strong>and</strong> $13.0 million in YTD 2010).<br />
(2) Transportation cost is deducted in calculating above revenue whereas it is included in expenses in the consolidated statements of operations.<br />
(3) Per unit prices are calculated using revenue divided by volumes of refined products sold.
AR <strong>2011</strong><br />
PG 28<br />
In Q4 <strong>2011</strong> <strong>and</strong> YTD <strong>2011</strong>, downstream revenue increased by 41 percent <strong>and</strong> 31 percent compared to Q4 2010 <strong>and</strong> YTD 2010, respectively. Higher<br />
revenue was primarily due to higher light products production in <strong>2011</strong> relative to 2010 combined with higher weighted average realized sales prices<br />
for all products, driven by stronger economic conditions in our sales market.<br />
PRODUCT AND OPERATING COSTS<br />
Three months ended December 31 Year ended December 31<br />
<strong>2011</strong> 2010 <strong>2011</strong> 2010<br />
Crude oil <strong>and</strong> other feedstocks ($000) $ 89,500 $ 59,760 $ 358,416 $ 266,205<br />
Crude oil <strong>and</strong> other feedstocks ($ per bbl) (1) $ 94.17 $ 72.42 $ 88.14 $ 72.35<br />
Operating costs ($000) $ 7,966 $ 6,686 $ 28,453 $ 30,994<br />
Operating costs ($ per bbl) (1) $ 8.38 $ 8.10 $ 7.00 $ 8.42<br />
(1) Per unit costs are calculated using crude oil purchases <strong>and</strong> operations costs divided by volumes of refined products sold; costs are exclusive of depreciation <strong>and</strong> amortization.<br />
In Q4 <strong>2011</strong>, crude oil purchases <strong>and</strong> other feedstock costs per bbl increased by 30 percent compared to levels in Q4 2010 due to increased WTI<br />
prices <strong>and</strong> narrower heavy oil differentials in Q1 <strong>2011</strong> relative to the previous year. However, on a year to date basis, significantly higher WTI prices<br />
were offset by wider heavy oil differentials, resulting in a lower year over year increase at 22 percent.<br />
The Refinery completed a major maintenance turnaround in fourth quarter of 2009 <strong>and</strong> has commenced planning for the next turnaround scheduled<br />
for the second quarter of 2013.<br />
REFINING MARGIN (1) Three months ended December 31 Year ended December 31<br />
<strong>2011</strong> 2010 <strong>2011</strong> 2010<br />
Refining margin (1) ($000) $ 7,645 $ 8,084 $ 41,992 $ 29,067<br />
Refining margin (weighted average $ per bbl) $ 8.05 $ 9.80 $ 10.33 $ 7.91<br />
Refining margin (% of revenue) 7% 11% 10% 9%<br />
(1) Refining margin is a non-GAAP measure <strong>and</strong> defined in the Advisory section of the MD&A. Refining netbacks are calculated by deducting crude oil purchases <strong>and</strong> operating costs from revenue. Refining<br />
netbacks are calculated before eliminating inter-segment sales <strong>and</strong> related costs of sales.<br />
CORPORATE REVIEW<br />
GENERAL AND ADMINISTRATIVE EXPENSES<br />
In Q4 <strong>2011</strong>, general <strong>and</strong> administrative (“G&A”) expenses were $8.5 million (YTD <strong>2011</strong> - $34.2 million), compared to $6.5 million in Q4 2010 (YTD<br />
2010 - $23.8 million), primarily as a result of bringing our second oil s<strong>and</strong>s plant on production effective October 1, 2010 (including higher staff<br />
costs) as well as special advisory fees <strong>and</strong> other fees incurred in conjunction with the company’s joint venture processes in Q4 <strong>2011</strong>.<br />
SHARE BASED COMPENSATION<br />
Three months ended December 31 Year ended December 31<br />
($000) <strong>2011</strong> 2010 <strong>2011</strong> 2010<br />
Charged to expense $ 734 $ 1,184 $ 3,453 $ 5,019<br />
Capitalized to property, plant <strong>and</strong> equipment 19 142 238 1,610<br />
Total $ 753 $ 1,326 $ 3,691 $ 6,629<br />
The decrease in share based compensation charges in <strong>2011</strong> is primarily due to a lower number of options being granted in <strong>2011</strong> compared to 2010.<br />
DEPLETION, DEPRECIATION, AMORTIZATION AND IMPAIRMENT (“DD&A”)<br />
The following table summarizes the depletion, depreciation, amortization <strong>and</strong> impairment expense:<br />
Three months ended December 31 Year ended December 31<br />
($000) <strong>2011</strong> 2010 <strong>2011</strong> 2010<br />
Upstream $ 25,052 $ 18,799 $ 82,535 $ 57,966<br />
Downstream 2,449 2,994 9,278 10,470<br />
Corporate 526 664 1,859 2,330<br />
Impairment - upstream 24,700 4,467 24,700 4,467<br />
Amortization of exploration <strong>and</strong> evaluation assets 905 1,318 3,637 4,609<br />
Total $ 53,632 $ 28,242 $ 122,009 $ 79,842
AR <strong>2011</strong><br />
PG 29<br />
Depletion expense is calculated using the unit-of-production method, based on estimated total proved <strong>and</strong> probable (“2P”) reserves. Future capital<br />
costs estimated to realize production from the company’s 2P reserve is also added to the carrying amount of capitalized costs for depletion purposes.<br />
Depletion expense was higher in the <strong>2011</strong> periods as a result of increased production. On a boe basis, depletion was $19.33/boe of production in<br />
Q4 <strong>2011</strong> (Q4 2010 - $13.18/boe of production). Downstream <strong>and</strong> corporate property, plant <strong>and</strong> equipment are depreciated over their estimated<br />
useful lives.<br />
The company recorded impairment charge of $24.7 million in <strong>2011</strong> (2010 - $4.5 million) relating to certain conventional oil <strong>and</strong> gas properties<br />
located in Central Alberta.<br />
FINANCE CHARGES<br />
Three months ended December 31 Year ended December 31<br />
($000) <strong>2011</strong> 2010 <strong>2011</strong> 2010<br />
Finance charges – total $ 30,994 $ 25,635 $ 95,588 $ 107,735<br />
Less: Capitalized – – – (38,290)<br />
Finance charges – expensed $ 30,994 $ 25,635 $ 95,588 $ 69,445<br />
Finance charges include interest expense relating to the Convertible Debentures, Senior Notes <strong>and</strong> the Revolving Credit Facility (the “Facility”),<br />
amortization of transaction costs of the Facility, st<strong>and</strong>by fees associated with the Facility <strong>and</strong> fees on letters of credit issued. Finance charges also<br />
include non-cash charges with respect to the Convertible Debentures <strong>and</strong> Senior Notes. Higher finance charges in Q4 <strong>2011</strong> compared to Q4 2010<br />
was primarily due to a higher unrealized loss on remeasurement of Convertible Debentures at fair value. Total finance charges in YTD <strong>2011</strong> were<br />
lower than YTD 2010 primarily due to lower interest on Senior Notes <strong>and</strong> lower unrealized loss on remeasurement of Convertible Debentures to fair<br />
value. Lower interest expense on New Notes resulted from the debt refinancing completed in May <strong>2011</strong>.<br />
REFINANCING OF LONG-TERM DEBT<br />
As a result of the issuance of new Second Lien Senior Notes (the “New Notes”) <strong>and</strong> the purchase <strong>and</strong> redemption of old Notes during Q2 <strong>2011</strong>,<br />
the company performed an analysis <strong>and</strong> determined that this transaction partially resulted in a modification <strong>and</strong> partially an extinguishment of old<br />
Notes. Accordingly, the company recorded costs of refinancing of $36.1 million as a discount on the New Notes <strong>and</strong> approximately $61.9 million<br />
was expensed in the consolidated statement of operations. The repayment of US dollar denominated old Notes in YTD <strong>2011</strong> also resulted in the<br />
realization of a foreign exchange gain of $11.6 million.<br />
FOREIGN EXCHANGE GAINS<br />
The value of the Canadian dollar relative to the U.S. dollar has risen <strong>and</strong> fallen throughout <strong>2011</strong> (trading between $0.95 U.S. <strong>and</strong> $1.04 U.S.) <strong>and</strong> has<br />
had a significant impact on <strong>Connacher</strong>’s results, upon settling US dollar-denominated transactions <strong>and</strong> translating its US dollar-denominated long-term<br />
debt <strong>and</strong> US dollar cash balances into Canadian dollars for financial reporting purposes. We recorded foreign exchange gain of $10.7 million in Q4<br />
<strong>2011</strong> compared with gains of $26.9 million in Q4 2010 <strong>and</strong> losses of $8.9 million in YTD <strong>2011</strong> compared with gains of $41.6 million for YTD 2010.<br />
GAIN ON DISPOSITION OF ASSETS<br />
In Q4 <strong>2011</strong>, the company realized a gain of $0.6 million (Q4 2010 – loss of $1.2 million) primarily from the sale of oil <strong>and</strong> gas properties offset by a<br />
loss on the sale of Gran Tierra Energy Inc. common shares (“Gran Tierra Energy”) (see below). For YTD <strong>2011</strong>, a gain of $43.5 million (YTD 2010 –<br />
loss of $0.8 million), was realized primarily from the sale of our Marten Creek, Battrum, Latornell <strong>and</strong> Halfway Creek oil <strong>and</strong> gas properties <strong>and</strong> sale of<br />
Gran Tierra Energy shares.<br />
SHARE OF INTEREST IN AND LOSS ON ASSOCIATE<br />
In March <strong>2011</strong>, Petrolifera Petroleum Limited (“Petrolifera”) was acquired by Gran Tierra Energy. Under the terms of the sale, <strong>Connacher</strong>’s holding in<br />
Petrolifera was exchanged for 3.3 million common shares <strong>and</strong> 841,000 common share purchase warrants of Gran Tierra Energy Inc. The common<br />
share purchase warrants expired unexercised in <strong>2011</strong>. As a result of the transaction, the company recognized a loss of $2.3 million <strong>and</strong> transferred<br />
a loss of $4.5 million, an amount which had previously been recognized in other comprehensive loss. Common shares of Gran Tierra Energy Inc.<br />
received were sold in Q4 <strong>2011</strong> for net proceeds of $21.1 million resulting in a net loss of $4.6 million.<br />
INCOME TAXES<br />
The total income tax recovery of $24,000 in <strong>2011</strong> (2010 – $8.1 million) included a current income tax provision of $1.5 million (2010 – recovery<br />
of $291,000) <strong>and</strong> deferred income tax recovery of $1.6 million (2010 - $7.8 million). The increase in current income tax provision in <strong>2011</strong> primarily<br />
relates to higher net earnings in MRCI.<br />
The company has specific tax matters under discussion with tax authorities, the outcome of which is uncertain. Where the final outcome of these<br />
matters is different from the amounts currently recorded, such differences will be recorded in net earnings (loss) in the period in which such<br />
determination is made.
AR <strong>2011</strong><br />
PG 30<br />
ADJUSTED EBITDA, CASH FLOW AND NET LOSS<br />
<strong>Connacher</strong> realized improved operational performance in <strong>2011</strong> as a result of higher upstream <strong>and</strong> downstream sales volumes <strong>and</strong> higher product<br />
selling prices. This improved performance resulted in higher adjusted EBITDA. Adjusted EBITDA was $39.1 million in Q4 <strong>2011</strong> compared to $31.9<br />
million reported in Q4 2010; YTD <strong>2011</strong> was up 41 percent to $129.9 million, compared to $92.2 million in YTD 2010.<br />
Cash flow in Q4 <strong>2011</strong> of $19.3 million was 114 percent higher than the $9.0 million reported in Q4 2010. YTD <strong>2011</strong> cash flow of $45.1 million was<br />
26 percent higher than in YTD 2010 when it was $35.9 million. Increased cash flow in <strong>2011</strong> periods was primarily due to higher netbacks.<br />
The company realized net loss of $59.5 million in Q4 <strong>2011</strong> compared to a net loss of $25.6 million in Q4 2010 <strong>and</strong> incurred a net loss of $114.1<br />
million in YTD <strong>2011</strong> compared to a loss of $44.7 million in YTD 2010 primarily due to higher finance charges, the cost of refinancing long-term debt,<br />
higher depletion, depreciation, amortization <strong>and</strong> impairment charges <strong>and</strong> foreign exchange losses incurred in <strong>2011</strong>.<br />
CAPITAL EXPENDITURES<br />
ACTUAL CAPITAL EXPENDITURES<br />
Year ended December 31<br />
($000) <strong>2011</strong> 2010<br />
Upstream $ 137,974 $ 191,740<br />
Downstream 18,653 8,575<br />
Cash-related capital expenditures 156,627 200,315<br />
Non-cash related capital expenditures 6,801 58,850<br />
Total capital expenditures $ 163,428 $ 259,165<br />
YTD <strong>2011</strong> cash capital expenditures for maintenance <strong>and</strong> sustaining activities were $51 million, including $32 million at our oil s<strong>and</strong>s operations;<br />
$6 million in our conventional operations <strong>and</strong> head office requirements; <strong>and</strong> $13 million at our Refinery related to boiler replacement <strong>and</strong> substation<br />
upgrades. YTD <strong>2011</strong> growth <strong>and</strong> special projects cash capital expenditures of $106 million included $63 million related to our conventional; $2<br />
million at our oil s<strong>and</strong>s producing operations; $6 million related to the Great Divide Environmental Impact Assessment; $30 million related to oil s<strong>and</strong>s<br />
exploration activities; <strong>and</strong> $5 million at our Refinery related to the benzene removal project. Conventional outlays were entirely financed from proceeds<br />
of sales of non-core or mature conventional properties.<br />
YTD 2010 cash capital expenditures for maintenance <strong>and</strong> sustaining activities were $32 million, including $15 million at our oil s<strong>and</strong>s operations;<br />
$9 million in our conventional operations <strong>and</strong> head office requirements; <strong>and</strong> $8 million at our Refinery related to boiler replacement <strong>and</strong> substation<br />
upgrades. YTD 2010 growth <strong>and</strong> special projects cash capital expenditures of $168 million included $153 million related to our oil s<strong>and</strong>s operations;<br />
$13 million at our conventional operations <strong>and</strong> $1 million at our Refinery related to the benzene removal project.<br />
Non-cash related capital expenditures include revisions for changes in estimated costs <strong>and</strong> rates of discount relating to decommissioning liabilities.<br />
CAPITAL RESOURCES<br />
<strong>Connacher</strong>’s objectives in managing its cash, debt, equity, balance sheet <strong>and</strong> future capital expenditure programs are to safeguard its ability to meet<br />
its financial obligations, to maintain a flexible capital structure that allows financing options when a financing need arises <strong>and</strong> to optimize its use of<br />
short-term <strong>and</strong> long-term debt <strong>and</strong> equity at an appropriate level of risk. The company manages its capital structure <strong>and</strong> follows a financial strategy<br />
that considers economic <strong>and</strong> industry conditions, the risk characteristics <strong>and</strong> long-term nature of its underlying assets <strong>and</strong> its growth opportunities. It<br />
strives to continuously improve its credit rating <strong>and</strong> reduce its cost of capital.<br />
The company reported the following debt outst<strong>and</strong>ing:<br />
($000) December 31, <strong>2011</strong> December 31, 2010<br />
Convertible Debentures, 4.75%, due June 30, 2012 $ 98,564 $ 96,548<br />
First Lien Senior Notes, 11.75%, due July 15, 2014 - 184,176<br />
Second Lien Senior Notes, 10.25%, due December 15, 2015 3,470 566,663<br />
Second Lien Senior Notes, 8.75%, due August 1, 2018 343,138 -<br />
Second Lien Senior Notes, 8.5%, due August 1, 2019 512,930 -<br />
Total $ 958,102 $ 847,387<br />
CONVERTIBLE DEBENTURES<br />
It is the present intention of the company to redeem the 4.75% $100 million Convertible Debentures when due on June 30, 2012.
AR <strong>2011</strong><br />
PG 31<br />
NEW NOTES<br />
We issued US$550 million face value 8.5% Senior Secured Second Lien Notes due August 1, 2019 <strong>and</strong> CAD$350 million face value 8.75% Senior<br />
Secured Second Lien Notes due August 1, 2018 at par <strong>and</strong> capitalized transaction costs of $17.6 million relating to their issuance.<br />
Interest is payable semi-annually on February 1 <strong>and</strong> August 1 each year the New Notes are outst<strong>and</strong>ing. The New Notes are secured on a second<br />
priority basis by liens on all of the company’s existing <strong>and</strong> future property, excluding certain pipeline assets in the USA.<br />
Proceeds received from the sale of collateralized assets (excluding oil <strong>and</strong> gas properties for which no reserves have been assigned) are required to<br />
be re-invested in existing oil <strong>and</strong> gas properties, to acquire new oil <strong>and</strong> gas properties or to repay the Facility. If such proceeds are not used for these<br />
purposes within one year, the company is required to make an offer to repurchase the New Notes at par to the extent such proceeds exceed $25<br />
million plus any re-invested <strong>and</strong> repaid amounts. Following an offer to purchase the New Notes in connection with an asset sale, the company may<br />
redeem all or part of the US-dollar denominated New Notes at 108.5 percent <strong>and</strong> Canadian-dollar denominated New Notes at 108.75 percent with<br />
any remaining asset sale proceeds. As of December 31, <strong>2011</strong>, all asset sale proceeds have been re-invested in our oil <strong>and</strong> gas properties.<br />
Provisions in the indenture allow the company to redeem the New Notes as follows:<br />
• at any time prior to August 1, 2014, the company may redeem up to 35 percent of the US-dollar denominated New Notes at a price of 108.5<br />
percent <strong>and</strong> up to 35 percent of the Canadian-dollar denominated New Notes at the price of 108.75 percent with proceeds of equity offerings of<br />
at least $10 million;<br />
• at any time prior to August 1, 2015, the company may redeem some or all of the New Notes at their principal amount plus a make whole premium<br />
plus applicable interest;<br />
• after August 1, 2015, the US-dollar denominated New Notes may be redeemed at redemption prices ranging from 104.25 percent, reducing to<br />
100 percent on August 1, 2017 <strong>and</strong> thereafter; <strong>and</strong><br />
• after August 1, 2015, the Canadian–dollar denominated New Notes may be redeemed at redemption prices ranging from 104.375 percent<br />
reducing to 100 percent on August 1, 2017 <strong>and</strong> thereafter.<br />
In the event of a Change of Control of the company, the holders of the New Notes have the right to require the company to purchase the New Notes<br />
at a price of not less than 101 percent of the principal amount to be repurchased.<br />
The company repurchased US$783.5 million face value of the outst<strong>and</strong>ing 11 ¾% First Lien Senior Notes <strong>and</strong> 10 ¼% Second Lien Senior Notes<br />
(the “Old Notes”) (representing 99% of the Old Notes outst<strong>and</strong>ing) for cash consideration of US$854.7 million (CAD$835.9 million). The company<br />
determined that this transaction resulted partially in a modification <strong>and</strong> partially as an extinguishment of debt. Accordingly, the company recorded<br />
$36.1 million as a discount on the New Notes <strong>and</strong> approximately $61.9 million was expensed in the consolidated statement of operations. The<br />
repayment of US-dollar denominated Senior Notes in <strong>2011</strong> also resulted in the realization of a foreign exchange gain of $11.6 million.<br />
The company redeemed remaining amounts outst<strong>and</strong>ing relating to the Second Lien Senior Notes, 10 ¼% in January 2012.<br />
CREDIT FACILITY<br />
On May 31, <strong>2011</strong>, the company entered into an Amended <strong>and</strong> Restated Senior Secured Revolving Credit Facility. The Facility provides for revolving<br />
credit financing of up to $100 million, subject to borrowing base availability, including sub-facilities for letters of credit, swingline loans <strong>and</strong> borrowings<br />
in Canadian dollars <strong>and</strong> U.S. dollars. The Facility has an accordian feature whereby the Company can increase the Facility to $125 million. All<br />
outst<strong>and</strong>ing loans under the new Facility are due <strong>and</strong> payable in full on May 31, 2014.<br />
In the case of Canadian dollar drawings, borrowings under the new Facility bear interest at a rate per annum equal to the Canadian Prime Rate plus the<br />
applicable margin; in the case of US dollar drawings at US Base Rate plus the applicable margin. The applicable margins for borrowings under the new<br />
Facility are subject to steps up <strong>and</strong> steps down based on average ratings of the company’s debt as published by Moody’s <strong>and</strong> St<strong>and</strong>ard <strong>and</strong> Poors.<br />
In addition to paying interest on outst<strong>and</strong>ing principal under the new Facility, the company is required to pay a st<strong>and</strong>by fee in respect of the unutilized<br />
commitments thereunder, which fee will be determined based on utilization of the new Facility with rates established in the Facility in a similar manner<br />
to the interest margins. The company must also pay customary letter of credit fees equal to the applicable margin. As of December 31, <strong>2011</strong>, the<br />
Company’s interest rate on the new Facility was approximately 6.5%. The new Facility contains a requirement to maintain a ratio of consolidated total<br />
debt to total capitalization of under 75% (with convertible debt treated as equity <strong>and</strong> with up to $120 million added to equity for IFRS conversion<br />
adjustments) <strong>and</strong> borrowings under the new Facility cannot exceed two times trailing adjusted EBITDA.<br />
All obligations under the new Facility are unconditionally guaranteed by the company, are secured by substantially all of the assets of the company,<br />
including a first priority security interest on all current <strong>and</strong> future property, with the exception of certain pipeline assets in the USA.<br />
As of December 31, <strong>2011</strong>, the company had letters of credit outst<strong>and</strong>ing under the Facility of $2.2 million. No other amounts were owed under<br />
the Facility.
AR <strong>2011</strong><br />
PG 32<br />
<strong>Connacher</strong>’s capital structure <strong>and</strong> certain financial ratios are noted below:<br />
($000) December 31, <strong>2011</strong> December 31, 2010<br />
Long-term debt (1) $ 856,068 $ 847,387<br />
Shareholders’ equity 421,076 523,187<br />
Total Long-term debt plus Equity (“capitalization”) $ 1,277,144 $ 1,370,574<br />
Long-term debt to capitalization (2) 67% 62%<br />
(1) Long-term debt is stated at its carrying value, which is net of transaction costs including current portion.<br />
(2) Calculated as long-term debt divided by the book value of shareholders’ equity plus long-term debt.<br />
The long-term debt agreements contain certain provisions, which restrict the company’s ability to incur additional indebtedness, pay dividends, to<br />
make certain payments <strong>and</strong> to dispose of collateralized assets. At December 31, <strong>2011</strong>, the company was in compliance with all of the terms of its<br />
debt agreements.<br />
SHARES OUTSTANDING<br />
As at December 31, <strong>2011</strong>, the number of common shares issued <strong>and</strong> outst<strong>and</strong>ing was 448.3 million (December 31, 2010 – 447.2 million). The<br />
increase in <strong>2011</strong> was due to shares issued in respect of share option exercises <strong>and</strong> shares issued under share incentive awards plan.<br />
As at March 15, 2012, the company had the following securities issued <strong>and</strong> outst<strong>and</strong>ing.<br />
• 448,575,641 common shares;<br />
• 24,416,150 stock options under the company’s Stock Option Plan;<br />
• 494,190 share units under the Share Award Incentive Plan; <strong>and</strong><br />
• 470,124 share units under the Share Unit Plan.<br />
CONTRACTUAL OBLIGATIONS AND COMMITMENTS<br />
In the normal course of business, the company is obligated to make future payments. These obligations represent contracts <strong>and</strong> other commitments<br />
that are known <strong>and</strong> non-cancellable. The company is committed under its operating leases for office premises, vehicles <strong>and</strong> rail cars. The company is<br />
also obligated to make certain payments under its software license agreements, facility <strong>and</strong> equipment maintenance arrangements <strong>and</strong> long term debt<br />
indentures are as follows:<br />
As at December 31, <strong>2011</strong><br />
2012 1-3 years 4-6 years Thereafter Total<br />
($000)<br />
Operating leases (1) $ 5,284 $ 17,015 $ 4,742 $ - $ 27,041<br />
Other commitments (2) 8,487 18,129 4,855 14,400 45,871<br />
Long-term debt at face value including interest (3) 180,559 234,509 774,049 367,865 1,556,982<br />
Defined benefit plan contributions 1,530 - - - 1,530<br />
Total $ 195,860 $ 269,656 $ 783,643 $ 382,265 $ 1,631,424<br />
(1) Includes rent of office space <strong>and</strong> lease rentals for vehicles <strong>and</strong> rail cars.<br />
(2) Primarily relates to power infrastructure cost.<br />
(3) Includes future interest payments.<br />
The above table excludes ongoing crude oil <strong>and</strong> product purchase commitments of the Refinery, which are in the normal course of business <strong>and</strong> are<br />
contracted at market prices.<br />
OFF BALANCE SHEET ITEMS<br />
At December 31, <strong>2011</strong> <strong>and</strong> December 31, 2010, the company did not have any off‐balance sheet arrangements other than letters of credit<br />
outst<strong>and</strong>ing under the Facility of $2.2 million (December 31, 2010: $5.7 million).<br />
TRANSACTIONS WITH RELATED PARTIES<br />
The company had transactions with its related parties which include Petrolifera, a previously associated company <strong>and</strong> key management personnel.<br />
Associate<br />
<strong>Connacher</strong> provided certain general <strong>and</strong> administrative services to Petrolifera <strong>and</strong> received approximately $45,000 as fees in <strong>2011</strong> (2010: $180,000).<br />
Petrolifera also reimbursed <strong>Connacher</strong> for certain other out–of–pocket expenses incurred by <strong>Connacher</strong> on Petrolifera’s behalf. In addition, the company<br />
rented a portion of its office building to Petrolifera on sublease. The company recovered rental expenses of $30,000 in <strong>2011</strong> (2010 : $137,000).<br />
The service <strong>and</strong> sublease agreements were terminated in March <strong>2011</strong>.
AR <strong>2011</strong><br />
PG 33<br />
Compensation of key management personnel<br />
Key management personnel include directors <strong>and</strong> executive officers of <strong>Connacher</strong>. The compensation paid or payable to key management for services<br />
is shown below:<br />
For the year ended December 31<br />
<strong>2011</strong> 2010<br />
(Canadian dollar in thous<strong>and</strong>s)<br />
Short–term employee benefits $ 4,309 $ 4,353<br />
Post–employment benefits 197 229<br />
Termination benefits - 312<br />
Other long–term benefits 96 103<br />
Share–based payments 1,217 2,031<br />
$ 5,819 $ 7,028<br />
The company has management contracts with executive officers that require the company to pay a lump sum payment in case of loss of employment<br />
under certain circumstances as prescribed in these contracts. Subsequent to December 31, <strong>2011</strong>, the company paid approximately $5.5 million<br />
under these contracts as compensation for loss of employment.<br />
RISK FACTORS AND RISK MANAGEMENT<br />
GENERAL<br />
<strong>Connacher</strong> is engaged in the oil <strong>and</strong> gas exploration, development, production, <strong>and</strong> refining industry. The business is inherently risky <strong>and</strong> there is no<br />
assurance that hydrocarbon reserves will be discovered <strong>and</strong> economically produced. Operational risks include competition, reservoir performance<br />
uncertainties, environmental factors <strong>and</strong> regulatory <strong>and</strong> safety concerns. Financial risks associated with the petroleum industry include fluctuations in<br />
commodity prices, interest rates, currency exchange rates <strong>and</strong> the cost of goods <strong>and</strong> services.<br />
<strong>Connacher</strong>’s financial <strong>and</strong> operating performance is potentially affected by a number of factors including, but not limited to, risks associated with the<br />
production <strong>and</strong> refining of oil <strong>and</strong> gas, commodity prices <strong>and</strong> exchange rates, environmental legislation, changes to royalty <strong>and</strong> income tax legislation,<br />
credit <strong>and</strong> capital market conditions, credit risk for failure of performance of third parties <strong>and</strong> other risks <strong>and</strong> uncertainties described in more detail in<br />
<strong>Connacher</strong>’s Annual Information Form filed with securities regulatory authorities.<br />
<strong>Connacher</strong> employs highly qualified people, uses sound operating <strong>and</strong> business practices <strong>and</strong> evaluates all potential <strong>and</strong> existing wells using the latest<br />
applicable technology. The company complies with government regulations <strong>and</strong> has in place an up-to-date emergency response program. <strong>Connacher</strong><br />
adheres to environment <strong>and</strong> safety policies <strong>and</strong> st<strong>and</strong>ards. Decommissioning liabilities are recognized upon acquisition, construction <strong>and</strong> development<br />
of the assets. <strong>Connacher</strong> maintains property <strong>and</strong> liability insurance coverage. The coverage provides a reasonable amount of protection from risk of<br />
loss; however, not all risks are foreseeable or insurable.<br />
COMMODITY PRICE AND EXCHANGE RATE RISKS<br />
<strong>Connacher</strong>’s future financial performance remains closely linked to crude oil, natural gas <strong>and</strong> refined product prices <strong>and</strong> foreign exchange rate<br />
changes which may be influenced by many factors including global <strong>and</strong> regional supply <strong>and</strong> dem<strong>and</strong>, seasonality, political events <strong>and</strong> weather. These<br />
factors can cause a high degree of price volatility. We mitigate some of the risk associated with changes in commodity prices through the use of<br />
hedges <strong>and</strong> other derivative financial instruments.<br />
Dilbit, crude oil, diluent, <strong>and</strong> refined products purchase <strong>and</strong> sale prices are based on U.S. dollar benchmarks that result in our realized prices being<br />
influenced by the US:Canadian dollar exchange rate, thereby creating another element of uncertainty. Should the Canadian dollar strengthen compared<br />
to the U.S dollar, the resulting negative effect on revenue, including the translation of MRCI’s U.S. denominated results to Canadian dollars for financial<br />
reporting purposes would be partially offset with exchange gains on translating our U.S. dollar denominated debt <strong>and</strong> associated interest payments<br />
thereon. The opposite would occur should the Canadian dollar weaken compared to the U.S. dollar. See “Liquidity” <strong>and</strong> “Capital Resources” above.<br />
REGULATORY APPROVAL RISKS<br />
Before proceeding with most major development projects, <strong>Connacher</strong> must obtain regulatory approvals, which approvals must be maintained in<br />
good st<strong>and</strong>ing during the currency of the particular project. The regulatory approval process involves stakeholder consultation, environmental impact<br />
assessments <strong>and</strong> public hearings, among other factors. Failure to obtain regulatory approvals, or failure to obtain them on a timely basis, could<br />
result in delays, ab<strong>and</strong>onment, or restructuring of projects <strong>and</strong> increased costs, all of which could negatively impact future earnings <strong>and</strong> cash flow.<br />
Failure to maintain approvals, licenses, permits <strong>and</strong> authorizations in good st<strong>and</strong>ing could result in the imposition of fines, production limitations or<br />
suspension orders.
AR <strong>2011</strong><br />
PG 34<br />
PERFORMANCE<br />
Our financial <strong>and</strong> operating performance is potentially affected by a number of factors, including, but not limited to the following:<br />
• Our ability to reliably operate our conventional <strong>and</strong> oil s<strong>and</strong>s facilities <strong>and</strong> our refinery is important in meeting production targets.<br />
• Operating costs could be impacted by inflationary pressures on labor, volatile pricing for natural gas used as an energy source in oil s<strong>and</strong>s<br />
processes <strong>and</strong> planned <strong>and</strong> unplanned maintenance. We continue to address these risks though such strategies as application of technologies <strong>and</strong><br />
an increased focus on regular preventative maintenance. The Refinery is in its final year of operation prior to the scheduled turnaround in 2013.<br />
• While fiscal regimes in Alberta, Canada <strong>and</strong> the USA are generally stable relative to many global jurisdictions, royalty <strong>and</strong> tax treatments are<br />
subject to periodic review, the outcome of which is not predictable <strong>and</strong> could result in changes to the company’s planned investments <strong>and</strong> rates of<br />
return on existing investments.<br />
• Management expects that fluctuations in dem<strong>and</strong> <strong>and</strong> supply for refined products, margin <strong>and</strong> price volatility, market competition <strong>and</strong> the seasonal<br />
dem<strong>and</strong> fluctuations for some of our refined products will continue to impact our refining business.<br />
• There are certain risks associated with the execution of capital projects, including the risk of cost overruns <strong>and</strong> delays. Numerous risks <strong>and</strong><br />
uncertainties can affect construction schedules, including the availability of labor <strong>and</strong> other impacts of competing projects drawing on the same<br />
resources during the same time period.<br />
CAPITAL REQUIREMENTS<br />
The company anticipates making substantial capital expenditures for the acquisition, exploration, development <strong>and</strong> production of bitumen <strong>and</strong> crude oil<br />
reserves <strong>and</strong> refining in the future. As the company’s revenues may decline as a result of decreased commodity pricing, it may be required to reduce<br />
capital expenditures. In addition, uncertain levels of near term industry activity coupled with the global economic situation exposes the company<br />
to additional access to capital risk. There can be no assurance that debt or equity financing, or cash generated by operations will be available or<br />
sufficient to meet these requirements or for other corporate purposes or, if debt or equity financing is available, that it will be on terms acceptable<br />
to the company. The inability of the company to access sufficient capital for its operations <strong>and</strong> growth could have a material adverse effect on the<br />
company’s business financial condition, results of operations <strong>and</strong> prospects.<br />
THIRD PARTY CREDIT RISK<br />
Credit risk is a risk of failure of performance by counter-parties. We attempt to mitigate this credit risk before contract initiation <strong>and</strong> ensuring product<br />
sales <strong>and</strong> delivery contracts are made with well-known <strong>and</strong> financially strong crude oil <strong>and</strong> natural gas marketers. The company may be exposed to third<br />
party credit risk through its contractual arrangements with its current counter-parties. In the event such entities fail to meet their contractual obligations<br />
to the company, such failures may have a material adverse effect on the company’s business, financial condition, results of operations <strong>and</strong> prospects.<br />
ENVIRONMENTAL<br />
All phases of the oil <strong>and</strong> gas <strong>and</strong> refining business present environmental risks <strong>and</strong> hazards <strong>and</strong> are subject to environmental regulation pursuant<br />
to a variety of federal, provincial, state <strong>and</strong> local laws <strong>and</strong> regulations. Compliance with such legislation can require significant expenditures <strong>and</strong><br />
a breach may result in the imposition of fines <strong>and</strong> penalties, some of which may be material. Environmental legislation is evolving in a manner<br />
expected to result in stricter st<strong>and</strong>ards <strong>and</strong> enforcement, larger fines <strong>and</strong> liability <strong>and</strong> potentially increased capital expenditures <strong>and</strong> operating costs.<br />
There has been much public debate with respect to Canada’s alternative strategies with respect to climate change <strong>and</strong> the control of greenhouse<br />
gases. Implementation of strategies for reducing greenhouse gases could have a material impact on the nature of oil, gas <strong>and</strong> refining operations,<br />
including those of the company. Given the evolving nature of the issues related to climate change <strong>and</strong> the control of greenhouse gases <strong>and</strong><br />
resulting requirements, it is not possible to predict either the nature of those requirements or the impact on the company <strong>and</strong> its operations <strong>and</strong><br />
financial condition. The company may be subject to remedial environmental <strong>and</strong> litigation costs resulting from potential unknown <strong>and</strong> unforeseeable<br />
environmental impacts arising from the company’s operations. While these costs have not been material to the company in the past, there is no<br />
guarantee that this will continue to be the case in the future as the company carries on with development of technologies.<br />
At our Refinery, we now make ultra-low sulphur diesel <strong>and</strong> gasoline. We are also m<strong>and</strong>ated to remove benzene from our refined gasoline commencing<br />
in <strong>2011</strong>. This project is ongoing however we were required to purchase benzene credits in <strong>2011</strong> <strong>and</strong> will continue to do so until commissioning of the<br />
project. Thereafter, our benzene purchase requirements will be reduced but not 100 percent mitigated. Our upstream <strong>and</strong> downstream businesses are<br />
closely regulated with respect to l<strong>and</strong> disturbance, water usage <strong>and</strong> green house gas emission. To meet these requirements, our operations personnel<br />
closely follow established environmental policies <strong>and</strong> procedures <strong>and</strong> regularly report to regulators. The quality of these reports has been affirmed by<br />
recent audits.
AR <strong>2011</strong><br />
PG 35<br />
ACCOUNTING POLICIES AND ESTIMATES<br />
ADOPTION OF INTERNATIONAL FINANCIAL <strong>REPORT</strong>ING STANDARDS<br />
On January 1, <strong>2011</strong>, the company adopted International Financial Reporting St<strong>and</strong>ards (“IFRS”) for financial reporting purposes, using a transition<br />
date of January 1, 2010. The financial statements for the year ended December 31, <strong>2011</strong>, including required comparative information, have been<br />
prepared in accordance with International Financial Reporting St<strong>and</strong>ards 1, First-time Adoption of International Financial Reporting St<strong>and</strong>ards.<br />
The following provides a summary reconciliation of <strong>Connacher</strong>’s 2010 net loss before taxes calculated in accordance with previous GAAP <strong>and</strong><br />
<strong>Connacher</strong>’s 2010 net loss after taxes calculated in accordance with IFRS, along with a discussion of the significant IFRS accounting policy changes.<br />
Summary Net Loss Reconciliation<br />
(Canadian dollar in thous<strong>and</strong>s) YTD 2010<br />
Net loss per previous GAAP $ (38,798)<br />
Exploration <strong>and</strong> evaluation expense (964)<br />
Depletion, depreciation, amortization <strong>and</strong> impairment 1,305<br />
Disposition of oil <strong>and</strong> gas properties (5,287)<br />
Compensation 44<br />
Unwinding of discount on decommissioning liabilities 812<br />
Interest in associate 3,140<br />
Unrealized loss on revaluation of Convertible Debentures (228)<br />
Income taxes (4,693)<br />
Net loss per IFRS $ (44,669)<br />
ACCOUNTING POLICY CHANGES<br />
The following discussion explains the significant differences between <strong>Connacher</strong>’s previous GAAP accounting policies <strong>and</strong> those applied by the<br />
company under IFRS. IFRS policies have been retrospectively <strong>and</strong> consistently applied except where specific IFRS 1 optional <strong>and</strong> m<strong>and</strong>atory<br />
exemptions permitted an alternative treatment upon transition to IFRS for first-time adopters. IFRS 1 requires the presentation of comparative<br />
information as at the January 1, 2010 (“transition date”) <strong>and</strong> subsequent comparative periods as well as the consistent <strong>and</strong> retrospective application<br />
of IFRS accounting policies. To assist with the transition, the provisions of IFRS 1 allow for certain m<strong>and</strong>atory exceptions <strong>and</strong> optional exemptions<br />
for first-time adopters. The significant m<strong>and</strong>atory exceptions <strong>and</strong> optional exemptions applied under IFRS 1 in preparing the consolidated financial<br />
statements are set out below followed by a discussion regarding the impact of individually significant items.<br />
Deemed cost election for oil <strong>and</strong> gas properties<br />
Under previous GAAP, the company followed the “full cost” method of accounting for petroleum <strong>and</strong> natural gas activities under which all costs directly<br />
associated with the acquisition of, the exploration for, <strong>and</strong> the development of petroleum <strong>and</strong> natural gas reserves were capitalized on a country–<br />
by–country cost centre basis. The company had one cost centre, Canada, for the upstream segment. Costs accumulated within this one cost centre<br />
were depleted using the unit–of–production method based on proved reserves determined using estimated future prices <strong>and</strong> costs. Upon transition<br />
to IFRS, the company was required to adopt new accounting policies for upstream activities, including the segregation of exploration <strong>and</strong> evaluation<br />
costs <strong>and</strong> petroleum <strong>and</strong> natural gas properties. Under IFRS, exploration <strong>and</strong> evaluation costs are those expenditures for which technical feasibility<br />
<strong>and</strong> commercial viability has not yet been determined, are presented separately on the balance sheet as exploration <strong>and</strong> evaluation assets <strong>and</strong> may<br />
or may not be amortized based on the company’s accounting policy. Petroleum <strong>and</strong> natural gas properties include those expenditures where technical<br />
feasibility <strong>and</strong> commercial viability has been determined, are presented as a part of property, plant <strong>and</strong> equipment on the balance sheet <strong>and</strong> are<br />
depleted <strong>and</strong> depreciated on a segregated basis based on the company’s accounting policy. The company adopted the IFRS 1 exemption whereby the<br />
company deemed its January 1, 2010 IFRS upstream asset costs to be equal to its previous GAAP historical upstream property, plant <strong>and</strong> equipment<br />
net book value. Accordingly, exploration <strong>and</strong> evaluation costs were deemed equal to the unproved properties balance <strong>and</strong> the petroleum <strong>and</strong> natural<br />
gas properties costs were deemed equal to the remaining upstream full cost pool balance. The petroleum <strong>and</strong> natural gas property costs were<br />
allocated for depletion, depreciation <strong>and</strong> impairment testing purposes on a pro rata basis using proved reserves values at the transition date.<br />
Leases<br />
The company has elected not to reassess whether an arrangement contains a lease under International Financial Reporting Interpretations Committee<br />
Interpretation 4 for contracts that were assessed under previous GAAP.<br />
Business Combinations<br />
IFRS 3, “Business Combinations” has not been applied to business combinations that occurred before the transition date.<br />
Borrowing Costs<br />
Borrowing costs directly attributable to the acquisition or construction of qualifying assets were not retrospectively restated prior to transition date.
AR <strong>2011</strong><br />
PG 36<br />
Estimates<br />
Hindsight was not used to create or revise estimates <strong>and</strong> accordingly, the estimates made by the company under previous GAAP are consistent with<br />
their application under IFRS.<br />
Additional exemptions applied<br />
The company applied additional exemptions for cumulative foreign currency translation differences, share-based compensation, decommissioning<br />
liabilities <strong>and</strong> accounting for investment in associate, which are explained in the respective paragraphs below.<br />
Exploration <strong>and</strong> Evaluation<br />
As explained above under “Deemed cost election for oil <strong>and</strong> gas properties”, the company reclassified $96.2 million <strong>and</strong> $120.8 million to exploration<br />
<strong>and</strong> evaluation assets at January 1, 2010 <strong>and</strong> December 31, 2010, respectively, based on the deemed carrying amounts representing unproved<br />
properties balance as determined under previous GAAP.<br />
Additionally, under IFRS, costs incurred prior to obtaining the legal rights to explore are expensed whereas under previous GAAP these costs were<br />
capitalized as part of property, plant <strong>and</strong> equipment. Accordingly, the company recognized exploration <strong>and</strong> evaluation expense in net earnings (loss)<br />
of $964,000 in the year ended December 31, 2010 <strong>and</strong> recorded the corresponding decrease to the property, plant <strong>and</strong> equipment. This adjustment<br />
also resulted in an equivalent decrease in cash flow from operating activities under IFRS compared to the reported amounts under previous GAAP.<br />
The effect of the above adjustment on deficit was a reduction of $722,000 after tax benefits of $242,000 for the year ended December 31, 2010.<br />
Depletion, Depreciation <strong>and</strong> Amortization<br />
Under previous GAAP, petroleum <strong>and</strong> natural gas properties were depleted using the unit-of-production method calculated for each one Canada cost<br />
centre. Under IFRS, petroleum <strong>and</strong> natural gas properties are depleted using the unit-of-production method based on estimated proved <strong>and</strong> probable<br />
reserves determined using estimated future prices <strong>and</strong> costs calculated at the established area level. Further, as permitted under IFRS, the company<br />
elected to amortize certain exploration <strong>and</strong> evaluation assets (undeveloped l<strong>and</strong>) over the lease term. Under previous GAAP, undeveloped l<strong>and</strong> was<br />
tested for impairment <strong>and</strong> any resulting impairment was included in the full cost pool for depletion purposes. As a result, depletion, depreciation <strong>and</strong><br />
amortization expense decreased by $1.3 million in the year ended December 31, 2010, with a corresponding increase to exploration <strong>and</strong> evaluation<br />
assets <strong>and</strong> property, plant <strong>and</strong> equipment.<br />
The effect of the above adjustment on deficit was a decrease of $1.0 million after tax benefits of $0.3 million for the year ended December 31, 2010.<br />
Impairment<br />
Under previous GAAP, capitalized costs of petroleum <strong>and</strong> natural gas properties <strong>and</strong> goodwill were tested for impairment separately whereas<br />
under IFRS, capitalized costs of petroleum <strong>and</strong> natural gas properties <strong>and</strong> goodwill are allocated to cash-generating units (“CGU’s”) for impairment<br />
testing purposes.<br />
Under previous GAAP, impairment of petroleum <strong>and</strong> natural gas properties was recognized if their carrying amount exceeded the undiscounted cash<br />
flows from proved reserves for a country cost centre. Impairment was measured as the amount by which the carrying amount exceeded the sum of<br />
the fair value of the proved <strong>and</strong> probable reserves <strong>and</strong> the costs of unproved properties. The company did not report any impairment under previous<br />
GAAP on December 31, 2009 <strong>and</strong> 2010.<br />
Under previous GAAP, goodwill was tested with reference to the reporting unit. The company had allocated goodwill to the upstream reporting unit<br />
<strong>and</strong> goodwill was not considered impaired. Under IFRS, impairment is recognized if the carrying amount for a CGU exceeds the recoverable amount.<br />
A CGU is defined as the smallest identifiable group of assets that generates cash inflows that are largely independent of the cash inflows from other<br />
assets or groups of assets. On the transition date, the company performed an impairment test by allocating all capitalized costs of petroleum <strong>and</strong><br />
natural gas properties, goodwill <strong>and</strong> directly related liabilities to applicable cash-generating units based on their ability to generate largely independent<br />
cash flows (a lower level than previous GAAP) <strong>and</strong> determined that an impairment charge of $113.9 million on January 1, 2010 was required. Of the<br />
total impairment charge, $103.7 million was allocated to goodwill <strong>and</strong> $10.2 million was allocated to petroleum <strong>and</strong> natural gas properties, with the<br />
corresponding increase to deficit of $111.3 million, net of a tax benefit of $2.6 million.<br />
Asset <strong>and</strong> Liabilities Held For Sale <strong>and</strong> Disposition of <strong>Oil</strong> <strong>and</strong> <strong>Gas</strong> Properties<br />
Under previous GAAP, the proceeds from disposition of petroleum <strong>and</strong> natural gas properties were deducted from the full cost pool without<br />
recognition of a gain or loss <strong>and</strong> the accounting st<strong>and</strong>ard for classification of assets <strong>and</strong> liabilities as held for sale was not applicable to the disposition<br />
of petroleum <strong>and</strong> natural gas properties, unless the impact of the disposition was expected to result in a change to the depletion, depreciation <strong>and</strong><br />
amortization rate of 20 percent or greater, in which case a gain or loss was recorded <strong>and</strong> assets <strong>and</strong> liabilities were classified as held for sale.<br />
Under IFRS, gains or losses are recorded on dispositions <strong>and</strong> are calculated as the difference between the proceeds <strong>and</strong> the net book value of the asset<br />
disposed of, <strong>and</strong> the requirements of the classification of assets <strong>and</strong> liabilities as held for sale are applicable to all petroleum <strong>and</strong> natural gas properties.
AR <strong>2011</strong><br />
PG 37<br />
The company classified its assets <strong>and</strong> liabilities relating to certain petroleum <strong>and</strong> natural gas properties as held for sale on December 31, 2010 <strong>and</strong><br />
recorded them at lower of their carrying amount or fair value less costs to sell. The adjustment resulted in a reclassification of carrying amount of<br />
property, plant <strong>and</strong> equipment totaling $54.3 million, exploration <strong>and</strong> evaluation assets totaling $5.7 million <strong>and</strong> decommissioning liability totaling<br />
$10.9 million to assets <strong>and</strong> liabilities classified as held for sale. At December 31, 2010, an impairment charge of $4.5 million was recognized based<br />
on the difference between the December 31, 2010 carrying amounts of the assets prior to reclassification <strong>and</strong> the estimated recoverable amount.<br />
The recoverable amount was determined using fair value less costs to sell which was based on the sale price subsequently agreed to binding sale<br />
agreements with third parties.<br />
During the year ended December 31, 2010, the company recognized a loss of $0.8 million on the sale of minor petroleum <strong>and</strong> natural gas properties<br />
<strong>and</strong> exploration <strong>and</strong> evaluation assets.<br />
The effect of the above adjustments on deficit was a reduction of $3.9 million after tax benefits of $1.3 million for the year ended December 31, 2010.<br />
Foreign Currency<br />
In accordance with IFRS 1, the company has elected to deem all foreign currency translation differences that arose prior to the transition date in<br />
respect of foreign operations <strong>and</strong> the company’s share of associate’s translation differences to be nil <strong>and</strong> reclassified amounts recorded in other<br />
comprehensive loss as determined in accordance with previous GAAP to deficit. As a result, accumulated other comprehensive loss was decreased by<br />
$16.2 million with a corresponding increase to deficit as at January 1, 2010.<br />
Compensation – Defined Benefit Plan<br />
The company elected to use the IFRS 1 exemption whereby the cumulative unamortized net actuarial gains <strong>and</strong> losses of the company’s defined<br />
benefit plan were charged to deficit on January 1, 2010. This resulted in a decrease of $722,000 to the accrued benefit obligation <strong>and</strong> a<br />
corresponding decrease to deficit.<br />
Decommissioning liabilities<br />
Under previous GAAP, the asset retirement obligation was measured at the estimated fair value determined using estimated future cash outflows<br />
discounted using a credit-adjusted risk free interest rate <strong>and</strong> the liability was not remeasured to reflect period end discount rates. Under IFRS, the<br />
asset retirement obligation has been named “decommissioning liabilities”, fair value is measured as the best estimate of the future expenditure to be<br />
incurred discounted at a risk free interest rate, decommissioning liabilities are remeasured using the period end discount rate.<br />
In conjunction with the IFRS 1 exemption regarding petroleum <strong>and</strong> natural gas properties discussed above, the company was required to remeasure<br />
its decommissioning liabilities upon transition to IFRS <strong>and</strong> recognize the difference in deficit. The application of this exemption resulted in a $20.9<br />
million increase to decommissioning liabilities on the company’s consolidated balance sheet as at January 1, 2010 <strong>and</strong> a charge to deficit of $15.6<br />
million net of tax benefit of $5.2 million. Subsequent IFRS remeasurements of decommissioning liabilities are recorded through property, plant <strong>and</strong><br />
equipment with an offsetting adjustment to decommissioning liabilities. As at December 31, 2010, excluding the January 1, 2010 adjustment, the<br />
company’s decommissioning liabilities increased by $10.9 million which primarily reflects the remeasurement of the obligation using the company’s<br />
discount rate of 3.2 percent as at December 31, 2010. The use of the lower discount rate resulted in a decrease in the provision for unwinding of the<br />
discount totaling $812,000 for the year ended December 31, 2010.<br />
Investment in Associate<br />
As at January 1, 2010 <strong>and</strong> December 31, 2010, the company owned 26.9 million Petrolifera common shares, representing 22 percent <strong>and</strong> 18.5<br />
percent, respectively, of Petrolifera’s issued <strong>and</strong> outst<strong>and</strong>ing common shares <strong>and</strong> 6.8 million Petrolifera share purchase warrants. Petrolifera was<br />
accounted for as an equity investment in associate. The following are the key differences in IFRS compared to previous GAAP.<br />
• As a part of the company’s transition to IFRS, the company recorded adjustments to its share of loss, other comprehensive loss <strong>and</strong> dilution loss<br />
with a corresponding effect on the investment account balance <strong>and</strong> deficit reflecting the adjustments to conform Petrolifera’s financial position <strong>and</strong><br />
results of operations in accordance with IFRS <strong>and</strong> the accounting policies adopted by the company on its transition date.<br />
• Under previous GAAP, the company did not record the investment in share purchase warrants separately <strong>and</strong> allocated the total cost of $11.9<br />
million for additional shares purchased in 2009 to an investment in equity-accounted for investment on the consolidated balance sheet whereas<br />
under IFRS, share purchase warrants meet the definition of a derivative asset that should be bifurcated from the host contract (investment in<br />
associate) <strong>and</strong> recorded at fair value on each reporting period end with changes recorded in net earnings (loss). As a result, the company recorded<br />
the fair value of share purchase warrants on January 1, 2010 by increasing other assets <strong>and</strong> decreasing deficit. In addition, the company recorded<br />
an unrealized loss of $2.2 million in 2010 representing the change in fair value of this derivative financial asset.<br />
• Under IFRS, assets relating to the investment in Petrolifera were classified as assets held for sale on December 31, 2010. Equity accounting<br />
ceased on December 31, 2010 <strong>and</strong> the carrying amount of the investment in associate was classified as assets held for sale <strong>and</strong> recorded at<br />
the lower of its carrying amount <strong>and</strong> fair value less costs to sell. Under previous GAAP, the accounting st<strong>and</strong>ard for classification of assets <strong>and</strong><br />
liabilities as held for sale was not applicable to the disposition of investment in associate <strong>and</strong> accordingly, no classification of assets held for sale<br />
was reported. However, under previous GAAP, the company recognized impairment to record the investment at its fair value.
AR <strong>2011</strong><br />
PG 38<br />
Taxes<br />
The company recorded the differences to the amounts reported for deferred taxes under previous GAAP compared to IFRS for flow-through shares,<br />
discount on issue of long-term debt, capitalized share-based compensation, inter-company capital losses <strong>and</strong> the effects of IFRS transition adjustments.<br />
Debt<br />
Under previous GAAP, the convertible debentures were treated as a compound financial instrument with a debt <strong>and</strong> equity component. Under IFRS, the<br />
equity component is considered an embedded derivative. As permitted under IFRS, the company designated the convertible debentures as “fair value through<br />
profit <strong>and</strong> loss” <strong>and</strong> accordingly, recorded convertible debentures at fair value at each reporting period end with changes reported within net earnings (loss).<br />
As a result, the equity portion of convertible debentures was reduced by $16.8 million with a corresponding decrease to deficit on January 1, 2010 <strong>and</strong><br />
December 31, 2010. In addition, the company recognized the effect of change in fair value by increasing the value of the convertible debentures by $3.6<br />
million on January 1, 2010 with a corresponding increase to deficit. The adjustment also resulted in an increase of finance charges in 2010.<br />
Reclassifications<br />
In order to comply with the presentation of net earnings (loss) adopted by the company under IFRS, in the downstream segment, the company<br />
classified $3.9 million from operating expenses to general <strong>and</strong> administrative expenses in 2010.<br />
Further, under previous GAAP, the unwinding of the discount on decommissioning liabilities was included as a part of depletion, depreciation <strong>and</strong><br />
accretion expense in the consolidated statements of operations <strong>and</strong> comprehensive loss. Under IFRS this amount totaling $2.9 million in 2010 has<br />
been reclassified to finance charges.<br />
Changes to the Statement of Cash flow<br />
The following is a reconciliation of the company’s cash flow from operating, investing <strong>and</strong> financing activities reported in accordance with previous<br />
GAAP to IFRS for the year ended December 31, 2010:<br />
(Canadian dollar in thous<strong>and</strong>s)<br />
Year ended December<br />
31, 2010<br />
Cash flow from operating activities under previous GAAP $ 10,785<br />
Exploration <strong>and</strong> evaluation expenses (964)<br />
Interest expense on long-term debt 55,637<br />
Change in working capital relating to interest expense on long-term debt 974<br />
Cash flow from operating activities under IFRS $ 66,432<br />
Cash flow used in investing activities under previous GAAP $ (269,763)<br />
Exploration <strong>and</strong> evaluation expenses 964<br />
Interest capitalized on long-term debt 35,408<br />
Cash flow used in investing activities under IFRS (233,391)<br />
Cash flow from financing activities under previous GAAP $ 25,793<br />
Interest expense paid (92,019)<br />
Cash flow used in financing activities under IFRS $ (66,226)<br />
Under previous GAAP, interest paid on long-term debt was reported as a part of operating activities. During Q4 <strong>2011</strong>, as permissible under under<br />
IFRS, the company elected to present interest payments on long-term debt as financing activities.<br />
Loss per share<br />
Basic <strong>and</strong> diluted loss per share under IFRS were impacted by the IFRS adjustments discussed above.<br />
CRITICAL ACCOUNTING ESTIMATES<br />
We make judgments, estimates <strong>and</strong> assumptions that affect the reported amounts of assets <strong>and</strong> liabilities <strong>and</strong> the disclosure of contingent assets<br />
<strong>and</strong> liabilities at the date of the consolidated financial statements <strong>and</strong> the reported amounts of revenues <strong>and</strong> expenses during the reporting period.<br />
Although these estimates are based on management’s best knowledge of the amount, event or actions, actual results ultimately may differ from those<br />
estimates. Accordingly, actual reported amounts may differ from estimated amounts as future confirming events occur.<br />
Estimation of petroleum <strong>and</strong> natural gas reserves<br />
Petroleum <strong>and</strong> natural gas reserve estimates are used in the unit–of–production depletion <strong>and</strong> depreciation calculation, determination of the timing<br />
of ab<strong>and</strong>onment costs <strong>and</strong> impairment analysis of upstream assets. The company’s proved plus probable reserves are estimated with reference<br />
to available geological, geophysical <strong>and</strong> engineering data. Estimates of petroleum <strong>and</strong> natural gas reserves are inherently imprecise, require the<br />
application of judgment <strong>and</strong> are subject to regular revision, either upward or downward, based on new information.
AR <strong>2011</strong><br />
PG 39<br />
Management is responsible for estimating the quantities of petroleum <strong>and</strong> natural gas reserves. Estimates are prepared in accordance with National<br />
Instrument 51-101, generally accepted industry practices <strong>and</strong> the st<strong>and</strong>ards of the Canadian <strong>Oil</strong> <strong>and</strong> <strong>Gas</strong> Evaluation H<strong>and</strong>book. On an annual basis,<br />
we have an independent reserves evaluation completed. GLJ Petroleum Consultants performed the annual evaluation effective December 31, <strong>2011</strong>.<br />
The Board of Directors has established a Reserves Committee to assist them in overseeing the annual review of our petroleum <strong>and</strong> natural gas<br />
reserves. The Reserves Committee comprises two independent Directors <strong>and</strong> meets with management periodically to review the reserves process <strong>and</strong><br />
results. The Reserves Committee appoints <strong>and</strong> meets with the independent reserve evaluation independent of management, to review the scope of<br />
their work, whether they have had access to sufficient information, the nature <strong>and</strong> satisfactory resolution of any material differences of opinion, <strong>and</strong><br />
their independence.<br />
Changes to estimates of petroleum <strong>and</strong> natural gas reserves affect prospectively the amounts of depletion, depreciation, amortization <strong>and</strong> impairment<br />
charged <strong>and</strong>, consequently, the carrying amounts of petroleum <strong>and</strong> natural gas properties <strong>and</strong> exploration <strong>and</strong> evaluation assets. The impact of future<br />
changes to estimates on the consolidated financial statements of subsequent periods could be material.<br />
Impairment of assets<br />
For the purposes of impairment analysis of the company’s assets, the key assumptions used in estimating cash flows are future commodity prices,<br />
expected production volumes <strong>and</strong> refinery throughput, cost structures <strong>and</strong> the outlook of market supply <strong>and</strong> dem<strong>and</strong> conditions appropriate to the<br />
local circumstances <strong>and</strong> environment. These assumptions <strong>and</strong> estimates are highly uncertain matters <strong>and</strong> are subject to change as new information<br />
becomes available. Changes in economic conditions can also affect the rate used to discount future cash flow estimates.<br />
Changes in assumptions could affect the carrying amounts of assets, <strong>and</strong> impairment charges <strong>and</strong> reversals will affect net earnings (loss).<br />
Decommissioning liabilities<br />
Provisions are recognized for the future ab<strong>and</strong>onment <strong>and</strong> reclamation of petroleum, natural gas <strong>and</strong> refining properties at the end of their economic<br />
lives. The estimated cost is recognized in net earnings (loss) over the life of the reserves on a unit–of–production basis. Changes in the estimates<br />
of costs to be incurred, reserves or in the rate of production will therefore affect net earnings (loss), generally over the remaining economic life of<br />
petroleum <strong>and</strong> natural gas assets.<br />
Estimates of the amounts of decommissioning provisions recognized are based on current legal <strong>and</strong> constructive requirements, technology <strong>and</strong> price<br />
levels. Because actual outflows can differ from estimates due to changes in laws, regulations, public expectations, technology, industry st<strong>and</strong>ards,<br />
prices <strong>and</strong> conditions, <strong>and</strong> can take place many years in the future, the carrying amounts of such provisions are regularly reviewed <strong>and</strong> adjusted to<br />
take account of such changes. The interest rate used to discount the cash flows is reviewed quarterly.<br />
Legal <strong>and</strong> other contingent matters<br />
In respect of these matters, the company is required to determine whether a loss is probable based on judgment <strong>and</strong> interpretation of laws <strong>and</strong><br />
regulations <strong>and</strong> determine if such a loss can be estimated. When any such loss is determined, it is charged to earnings. Management continually<br />
monitors known <strong>and</strong> potential contingent matters <strong>and</strong> makes appropriate provisions by charges to earnings when warranted by circumstance.<br />
Taxation<br />
Tax provisions are recognized when it is considered probable that there will be a future outflow of funds to a taxing authority. In such cases, provision<br />
is made for the amount that is expected to be settled, where this can be reasonably estimated. This requires the application of judgment as to the<br />
ultimate outcome, which can change over time depending on facts <strong>and</strong> circumstances. A change in estimate of the likelihood of a future outflow <strong>and</strong>/<br />
or in the expected amount to be settled would be recognized in net earnings (loss) in the period in which the change occurs.<br />
Deferred tax assets are recognized only to the extent it is considered probable that those assets will be recoverable. This involves an assessment<br />
of when those deferred tax assets are likely to be realized, <strong>and</strong> a judgment as to whether or not there will be sufficient taxable profits available to<br />
offset the tax assets when they do reverse. This requires assumptions regarding future profitability <strong>and</strong> is therefore inherently uncertain. To the extent<br />
assumptions regarding future profitability change, there can be an increase or decrease in the amounts recognized in respect of deferred tax assets<br />
as well as in the amounts recognized in net earnings (loss) in the period in which the change occurs.<br />
Tax provisions are based on enacted or substantively enacted laws. Changes in those laws could affect amounts recognized in net earnings (loss)<br />
both in the period of change, which would include any impact on cumulative provisions, <strong>and</strong> in future periods.<br />
Derivative financial instruments<br />
We may use derivative financial instruments to manage exposure to market risks relating to commodity prices, foreign currency exchange rates <strong>and</strong><br />
interest rates. Derivative financial instruments are not used for speculative purposes. We enter into financial transactions to help reduce exposure<br />
to price fluctuations with respect to commodity purchase <strong>and</strong> sale transactions to achieve targeted investment returns <strong>and</strong> growth objectives, while<br />
maintaining prescribed financial metrics. These transactions generally are swaps, collars or options <strong>and</strong> are generally entered into with major financial<br />
institutions or commodities trading institutions as counterparties. We may also use derivative financial instruments, such as interest rate swap
AR <strong>2011</strong><br />
PG 40<br />
agreements, to manage the fixed interest rate debt <strong>and</strong> related cost of borrowing. Derivative instruments that do not qualify as hedges, or are not<br />
designated as hedges, are recorded using the mark-to-market method of accounting whereby instruments are recorded in the Consolidated Balance<br />
Sheet as either an asset or liability, with changes in fair value recognized in net earnings (loss). Realized gains or losses from financial derivatives related<br />
to crude oil <strong>and</strong> natural gas prices are recognized in revenues as the related sales occur. Unrealized gains <strong>and</strong> losses are recognized in revenues at the<br />
end of each reporting period. The estimate of fair value of all derivative instruments is based on quoted market prices or, in their absence, third-party<br />
market indications <strong>and</strong> forecasts. The estimated fair value of financial assets <strong>and</strong> liabilities, by their very nature, is subject to measurement uncertainty.<br />
DISCLOSURE CONTROLS AND PROCEDURES<br />
The company’s Chief Executive Officer (“CEO”) <strong>and</strong> Chief Financial Officer (“CFO”) have designed, or caused to be designed under their supervision,<br />
disclosure controls <strong>and</strong> procedures to provide reasonable assurance that: (i) material information relating to the company is made known to the<br />
company’s CEO <strong>and</strong> CFO by others, particularly during the period in which the annual filings are being prepared; <strong>and</strong> (ii) information required to be<br />
disclosed by the company in its annual filings, interim filings or other reports filed or submitted by it under securities legislation is recorded, processed,<br />
summarized <strong>and</strong> reported within the time period specified in securities legislation. Such officers have evaluated, or caused to be evaluated under their<br />
supervision, the effectiveness of the company’s disclosure controls <strong>and</strong> procedures at the financial year end of the company <strong>and</strong> have concluded that<br />
the company’s disclosure controls <strong>and</strong> procedures are effective at the financial year end of the company for the foregoing purposes.<br />
INTERNAL CONTROLS OVER FINANCIAL <strong>REPORT</strong>ING<br />
The CEO <strong>and</strong> CFO have designed, or caused to be designed under their supervision, internal controls over financial reporting to provide reasonable<br />
assurance regarding the reliability of the company’s financial reporting <strong>and</strong> the preparation of financial statements for external purposes in accordance<br />
with Canadian GAAP. Such officers have evaluated, or caused to be evaluated under their supervision, the effectiveness of the company’s internal<br />
controls over financial reporting at the financial year end of the company <strong>and</strong> concluded that the company’s internal controls over financial reporting is<br />
effective at the financial year end of the company for the foregoing purpose.<br />
The company’s CEO <strong>and</strong> CFO are required to cause the company to disclose any change in the company’s internal controls over financial reporting<br />
that occurred during the company’s most recent interim period that has materially affected, or is reasonably likely to materially affect, the company’s<br />
internal controls over financial reporting. No material changes in the company’s internal controls over financial reporting were identified during such<br />
period that has materially affected, or are reasonably likely to materially affect, the company’s internal controls over financial reporting.<br />
It should be noted that a control system, including the company’s disclosure <strong>and</strong> internal controls <strong>and</strong> procedures, no matter how well conceived,<br />
can provide only reasonable, but not absolute, assurance that the objectives of the control system will be met <strong>and</strong> it should not be expected that the<br />
disclosure <strong>and</strong> internal controls <strong>and</strong> procedures will prevent all errors or fraud. In reaching a reasonable level of assurance, management necessarily is<br />
required to apply its judgment in evaluating the cost-benefit relationship of possible controls <strong>and</strong> procedures.<br />
ADVISORY SECTION<br />
FORWARD-LOOKING INFORMATION<br />
This report, including the outlook contained in the MD&A, contains forward-looking information including but not limited to, anticipated future operating <strong>and</strong><br />
financial results, expectations of future production, anticipated capital expenditures for 2012, the expected impact of new technologies such as SAGD+<br />
on production <strong>and</strong> SORs, the use of risk management sales contracts to mitigate market risk relating to commodity prices, foreign currency exchange<br />
rates <strong>and</strong> interest rates, the possible future redemption of <strong>Connacher</strong>’s Convertible Debentures, the ability of the Refinery to access new markets upon<br />
completion of the benzene removal project, the scheduled turnaround at the Refinery <strong>and</strong> oil s<strong>and</strong>s plants, seasonal fluctuations in production <strong>and</strong> the sale<br />
of gasoline, impact of failing to obtain, a delay in obtaining, or failure to retain necessary approvals <strong>and</strong> authorizations <strong>and</strong> future capital projects.<br />
Forward-looking information is based on management’s expectations regarding future growth, results of operations, production, future commodity<br />
prices <strong>and</strong> foreign exchange rates, future capital <strong>and</strong> other expenditures (including the amount, nature <strong>and</strong> sources of funding thereof), plans for <strong>and</strong><br />
results of drilling activity, environmental matters, business prospects <strong>and</strong> opportunities <strong>and</strong> future economic conditions.<br />
Forward-looking information involves significant known <strong>and</strong> unknown risks <strong>and</strong> uncertainties, which could cause actual results to differ materially from<br />
those anticipated. These risks include, but are not limited to operational risks in development, exploration, production <strong>and</strong> start up activities; delays<br />
or changes in plans with respect to exploration or development projects or capital expenditures; the uncertainty of reserve <strong>and</strong> resource estimates;<br />
the uncertainty of estimates <strong>and</strong> projections relating to production, costs <strong>and</strong> expenses, <strong>and</strong> health, safety <strong>and</strong> environmental risks; the risk of<br />
commodity price <strong>and</strong> foreign exchange rate fluctuations; risks associated with the impact of general economic conditions; sales volumes <strong>and</strong> risks <strong>and</strong><br />
uncertainties associated with securing <strong>and</strong> maintaining the necessary regulatory approvals <strong>and</strong> financing to proceed with the continued expansion of<br />
the Great Divide oil s<strong>and</strong>s project.
AR <strong>2011</strong><br />
PG 41<br />
The production outlook contained in the MD&A is based on certain assumptions regarding operational performance including, among others, steam<br />
generation levels <strong>and</strong> SORs, unplanned operational upsets, well productivity, realized netbacks which may accelerate or delay our capital program,<br />
including planned facility optimization programs <strong>and</strong> future market conditions <strong>and</strong> is subject to risk <strong>and</strong> uncertainties, including those risk <strong>and</strong><br />
uncertainties described above. Additional risks <strong>and</strong> uncertainties are described in further detail in <strong>Connacher</strong>’s Annual Information Form (“AIF”) for the<br />
year ended December 31, <strong>2011</strong> which is available at ww.sedar.com.<br />
Although <strong>Connacher</strong> believes that the expectations in such forward‐looking information are reasonable, there can be no assurance that such<br />
expectations shall prove to be correct. The forward‐looking information included in this report is expressly qualified in its entirety by this cautionary<br />
statement. The forward‐looking information included in this report is made as of the date of the MD&A <strong>and</strong> <strong>Connacher</strong> assumes no obligation to<br />
update or revise any forward‐looking information to reflect new events or circumstances, except as required by law.<br />
Per barrel of oil equivalent (boe) amounts have been calculated using a conversion rate of six thous<strong>and</strong> cubic feet of natural gas to one barrel of<br />
crude oil (6:1). The conversion is based on an energy equivalency conversion method primarily applicable to the burner tip <strong>and</strong> does not represent<br />
a value equivalency at the wellhead. Boes may be misleading, particularly if used in isolation. Additionally, given the value ratio based on the current<br />
price of crude oil as compared to natural gas is significantly different from the energy equivalency of 6:1, utilizing a conversion ratio of 6:1 may be<br />
misleading as an indication of value.<br />
NON-GAAP MEASUREMENTS<br />
The MD&A contains terms commonly used in the oil <strong>and</strong> gas industry, such as, netback, refinery margin, adjusted earnings before interest, taxes,<br />
depreciation <strong>and</strong> amortization (“adjusted EBITDA”) <strong>and</strong> cash flow. These terms are not defined by the financial measures used by <strong>Connacher</strong> to<br />
prepare its financial statements <strong>and</strong> are referred to herein as non-GAAP measures. These non-GAAP measures should not be considered an<br />
alternative to, or more meaningful than, cash provided by operating activities or net earnings (loss) as determined in accordance with Canadian GAAP<br />
as an indicator of <strong>Connacher</strong>’s performance. Management believes that in addition to net earnings (loss), netbacks, margins <strong>and</strong> adjusted EBITDA are<br />
useful financial measurements which assist in demonstrating the company’s ability to make interest payments, fund capital expenditures necessary<br />
for future growth or to repay debt. <strong>Connacher</strong>’s determination of netbacks, margins, adjusted EBITDA <strong>and</strong> cash flow may not be comparable to that<br />
reported by other companies.<br />
NETBACKS AND MARGINS<br />
Upstream netbacks, including by product, are calculated by deducting the related diluent, transportation, field operating costs <strong>and</strong> royalties from upstream<br />
revenues. Downstream margins are calculated by deducting crude oil purchases <strong>and</strong> operating <strong>and</strong> transportation costs from refining sales revenues.<br />
ADJUSTED EBITDA<br />
Adjusted EBITDA is calculated as net earnings (loss) before finance charges, current <strong>and</strong> deferred income tax provisions <strong>and</strong> recoveries, depletion,<br />
depreciation <strong>and</strong> amortization, exploration <strong>and</strong> evaluation expense, share-based compensation, foreign exchange gains/losses, unrealized gains/<br />
losses on risk management contracts, interest <strong>and</strong> other income, gain (loss) on disposition of assets, defined benefit plan expense, share of interest in<br />
<strong>and</strong> loss on associate <strong>and</strong> refinancing of long-term debt.<br />
CASH FLOW<br />
Cash flow includes all cash flows from operating activities <strong>and</strong> is calculated before changes in non-cash working capital, pension funding,<br />
decommissioning liabilities settled <strong>and</strong> after interest expense on long-term debt. The most comparable measure calculated in accordance with<br />
Canadian GAAP is cash flow from operating activities. Cash flow from operating activities is reconciled with the cash flow for the three months <strong>and</strong><br />
year ended December 31, <strong>2011</strong> <strong>and</strong> 2010 below.
AR <strong>2011</strong><br />
PG 42<br />
RECONCILIATIONS OF NON-GAAP MEASURES<br />
RECONCILIATIONS OF NETBACKS AND ADJUSTED EBITDA TO NET LOSS<br />
(Canadian dollar in thous<strong>and</strong>s) Three months ended December 31 Year ended December 31<br />
<strong>2011</strong> 2010 <strong>2011</strong> 2010<br />
Upstream netbacks $ 39,527 $ 32,599 $ 130,520 $ 89,362<br />
Downstream netback 7,645 8,084 41,992 29,067<br />
Realized gain (loss) on risk management<br />
195 (2,140) (9,125) (2,843)<br />
contracts<br />
General <strong>and</strong> administrative (8,540) (6,553) (34,224) (23,806)<br />
Defined benefit plan expense (recovery) 268 (39) 708 426<br />
Adjusted EBITDA $ 39,095 $ 31,951 $ 129,871 $ 92,206<br />
Interest <strong>and</strong> other income 380 83 979 256<br />
Defined benefit plan (expense) recovery (268) 39 (708) (426)<br />
Gain on disposition of assets 529 (1,243) 43,457 (811)<br />
Unrealized gain (loss) on risk management<br />
(20,328) (15,868) 11,252 (14,343)<br />
contracts<br />
Share-based compensation (734) (1,184) (3,453) (5,019)<br />
Finance charges (30,994) (25,635) (95,588) (69,445)<br />
Foreign exchange gain (loss) 10,678 26,935 (8,909) 41,641<br />
Depletion, depreciation, amortization <strong>and</strong><br />
(53,632) (28,242) (122,009) (79,842)<br />
impairment<br />
Income tax recovery (provision) (4,234) (1,958) 24 8,094<br />
Share of interest in <strong>and</strong> loss on disposition of<br />
(12) (10,494) (6,840) (16,016)<br />
associate<br />
Exploration <strong>and</strong> evaluation (expense) recovery 62 - (210) (964)<br />
Refinancing of long-term debt (19) - (61,971) -<br />
Net loss $ (59,477) $ (25,616) $ (114,105) $ (44,669)<br />
RECONCILIATIONS OF CASH FLOW FROM OPERATING ACTIVITIES TO CASH FLOW<br />
(Canadian dollar in thous<strong>and</strong>s) Three months ended December 31 Year ended December 31<br />
<strong>2011</strong> 2010 <strong>2011</strong> 2010<br />
Cash flow from operating activities $ 39,206 $ (2,774) $ 142,423 $ 66,432<br />
Changes in non-cash working capital 893 34,178 (14,048) 23,962<br />
Decommissioning liabilities settled (29) 140 1,018 647<br />
Defined pension plan contributions 7 - 504 517<br />
Interest expense on long-term debt (20,812) (22,453) (84,759) (55,637)<br />
Cash flow $ 19,265 $ 9,091 $ 45,138 $ 35,921<br />
CRUDE OIL, NGLs AND NATURAL GAS CONVERSIONS<br />
In this document, certain natural gas volumes have been converted to barrels of oil equivalent (“BOE”) on the basis of one barrel to six thous<strong>and</strong> cubic<br />
feet. BOE may be misleading, particularly if used in isolation. A conversion ratio of one bbl to six Mcf is based on an energy equivalency conversion<br />
method primarily applicable at the burner tip <strong>and</strong> does not necessarily represent value equivalency at the well head. Additionally, given the value ratio<br />
based on the current price of crude oil as compared to natural gas is significantly different from the energy equivalency of 6:1, utilizing conversion<br />
ratio of 6:1 may be misleading as an indication of value.
AR <strong>2011</strong><br />
PG 43<br />
QUARTERLY HIGHLIGHTS<br />
Fluctuations in results over the previous eight quarters are due principally to variations in oil <strong>and</strong> gas prices, production <strong>and</strong> sales volumes <strong>and</strong> foreign<br />
exchange rates relative to U.S. dollar denominated debt. For comparability, the following table presents the financial information for all of the quarters<br />
presented in the same format as was adopted in the quarter ended December 31, <strong>2011</strong>.<br />
FINANCIAL ($000 except per share amounts) 2010 2010 2010 2010 <strong>2011</strong> <strong>2011</strong> <strong>2011</strong> <strong>2011</strong><br />
Three Months Ended Mar 31 Jun 30 Sept 30 Dec 31 Mar 31 June 30 Sept 30 Dec 31<br />
Revenue, net of royalties $ 121,095 $ 132,877 $ 158,714 $ 177,245 $ 178,990 $ 234,556 $ 232,806 $ 226,454<br />
Adjusted EBITDA (1) 14,440 20,173 25,642 31,951 15,845 37,608 37,323 39,095<br />
Net earnings (loss) 8,505 (31,717) 4,159 (25,616) (14,101) (44,169) 3,642 (59,477)<br />
Basic <strong>and</strong> Diluted per share 0.02 (0.07) 0.01 (0.06) (0.03) (0.10) 0.01 (0.13)<br />
Capital expenditures 118,272 59,176 49,842 31,735 40,830 38,988 46,940 36,670<br />
Cash on h<strong>and</strong> 118,382 69,412 51,120 19,532 42,865 31,525 81,744 117,045<br />
Working capital surplus 127,416 100,202 62,047 138,644 80,902 18,954 50,801 16,876<br />
Long-term debt 856,495 889,797 873,032 847,387 843,089 829,310 865,540 856,068<br />
Shareholders’ equity $ 554,328 $ 530,086 503,251 523,187 $ 515,941 $ 467,057 $ 477,358 $ 421,076<br />
OPERATIONAL<br />
Upstream: Daily production volumes (2)<br />
Bitumen – bbl/d 6,936 6,211 6,758 13,238 13,200 13,720 13,454 13,173<br />
Crude oil – bbl/d 937 906 819 873 540 398 355 417<br />
Natural gas – Mcf/d 9,662 9,278 9,158 8,318 6,805 3,755 3,036 2,955<br />
Equivalent – boe/d (3) 9,483 8,663 9,103 15,498 14,874 14,744 14,315 14,083<br />
Product sales prices (4)<br />
Bitumen – $/bbl 51.98 43.13 42.68 45.08 41.78 54.49 40.98 53.04<br />
Crude oil – $/bbl 71.08 61.90 62.45 66.72 71.70 90.93 80.63 89.57<br />
Natural gas – $/Mcf 4.86 3.78 3.42 3.44 3.57 3.94 4.09 3.27<br />
Selected highlights – $/boe (3)<br />
Weighted average sales price (4) 49.99 41.44 40.74 44.09 41.31 54.15 41.39 52.96<br />
Royalties 3.57 2.73 2.72 2.76 2.15 3.99 2.33 3.24<br />
Operating costs 17.47 19.25 18.08 17.91 21.18 19.23 18.72 19.39<br />
Netback (1) 28.95 19.46 19.94 23.42 17.97 30.93 20.33 30.33<br />
Downstream: Refining<br />
Crude charged – bbl/d 9,347 9,373 9,903 10,137 9,764 9,860 9,638 10,295<br />
Refining utilization – % 98 99 104 107 103 104 101 108<br />
Margins – % (8) 12 13 9 6 10 14 7<br />
COMMON SHARES<br />
Shares outst<strong>and</strong>ing end of period (000) 428,246 429,103 429,120 447,168 447,858 448,058 448,260 448,260<br />
Weighted average shares outst<strong>and</strong>ing for the period<br />
Basic (000) 427,830 429,023 429,106 442,941 448,457 447,992 448,204 448,260<br />
Diluted (000) 430,077 429,023 431,487 442,941 448,457 447,992 449,351 448,260<br />
Volume traded (000) 167,483 182,419 98,105 137,128 180,297 127,468 106,243 214,710<br />
Common share price ($)<br />
High 1.65 1.88 1.52 1.35 1.66 1. 59 1.12 1.00<br />
Low 1.16 1.20 1.15 1.10 1.26 1.03 0.32 0.24<br />
Close (end of period) 1.49 1.29 1.20 1.33 1.43 1.05 0.33 0.76<br />
(1) A non-GAAP measure which is defined in the Advisory section of the MD&A. Reconciliations of Adjusted EBITDA on a quarterly basis are contained in the previously issued MD&A for the applicable quarter.<br />
(2) Represents bitumen, crude oil <strong>and</strong> natural gas produced in the period. Actual sales volumes may be different due to inventory changes during the period.<br />
(3) All references to barrels of oil equivalent (boe) are calculated on the basis of 6 Mcf: 1 bbl. This conversion is based on an energy equivalency conversion method primarily applicable at the burner tip <strong>and</strong> dooes<br />
may be misleading, particularly if used in isolation.<br />
(4) Before royalties <strong>and</strong> risk management contract gains or losses <strong>and</strong> after applicable diluent <strong>and</strong> transportation costs divided by actual sales volumes.
AR <strong>2011</strong><br />
PG 44<br />
Management’s Report<br />
To the Shareholders of <strong>Connacher</strong> <strong>Oil</strong> <strong>and</strong> <strong>Gas</strong> Limited:<br />
The consolidated financial statements of <strong>Connacher</strong> <strong>Oil</strong> <strong>and</strong> <strong>Gas</strong> Limited were prepared by <strong>and</strong> are the responsibility of management. The<br />
consolidated financial statements have been prepared in conformity with International Financial Reporting St<strong>and</strong>ards appropriate in the circumstances<br />
<strong>and</strong> include some amounts that are based on managements’ best estimates <strong>and</strong> judgments. Information contained elsewhere in the annual filing is<br />
consistent, where applicable, with information contained in the consolidated financial statements.<br />
The company maintains systems of internal accounting controls designed to provide reasonable assurance that all transactions are properly recorded<br />
in the company’s books <strong>and</strong> records, that policies <strong>and</strong> procedures are adhered to <strong>and</strong> that the assets are protected from unauthorized use. The<br />
systems of internal accounting controls are complemented by the selection, training <strong>and</strong> development of qualified staff.<br />
The consolidated financial statements have been audited by the independent accounting firm Deloitte & Touche LLP whose appointment is ratified<br />
annually by the shareholders at the annual shareholders’ meeting. The independent auditors perform such tests <strong>and</strong> related procedures as they deem<br />
necessary to arrive at an opinion on the fairness of the financial statements. The audit committee of the board of directors periodically meets with<br />
the independent auditors <strong>and</strong> management to obtain satisfaction that they are properly discharging their responsibilities. The independent auditors<br />
have unrestricted access to the audit committee, without management present, to discuss the results of their examination <strong>and</strong> the quality of financial<br />
reporting <strong>and</strong> internal accounting controls.<br />
Signed,<br />
“Peter D. Sametz”<br />
Interim Chief Executive Officer<br />
Signed,<br />
“Brenda G. Hughes”<br />
Chief Financial Officer<br />
March 15, 2012
AR <strong>2011</strong><br />
PG 45<br />
Independent Auditor’s Report<br />
To the Shareholders of <strong>Connacher</strong> <strong>Oil</strong> <strong>and</strong> <strong>Gas</strong> Limited:<br />
We have audited the accompanying consolidated financial statements of <strong>Connacher</strong> <strong>Oil</strong> <strong>and</strong> <strong>Gas</strong> Limited, which comprise the consolidated balance<br />
sheet as at December 31, <strong>2011</strong>, December 31, 2010 <strong>and</strong> January 1, 2010, <strong>and</strong> the consolidated statements of operations <strong>and</strong> comprehensive loss,<br />
consolidated statements of changes in shareholders’ equity <strong>and</strong> consolidated statements of cash flow for the years ended December 31, <strong>2011</strong> <strong>and</strong><br />
2010, <strong>and</strong> the notes to the consolidated financial statements.<br />
Management’s Responsibility for the Consolidated Financial Statements<br />
Management is responsible for the preparation <strong>and</strong> fair presentation of these consolidated financial statements in accordance with International<br />
Financial Reporting St<strong>and</strong>ards, <strong>and</strong> for such internal control as management determines is necessary to enable the preparation of consolidated<br />
financial statements that are free from material misstatement, whether due to fraud or error.<br />
Auditor’s Responsibility<br />
Our responsibility is to express an opinion on these consolidated financial statements based on our audits. We conducted our audits in accordance<br />
with Canadian generally accepted auditing st<strong>and</strong>ards. Those st<strong>and</strong>ards require that we comply with ethical requirements <strong>and</strong> plan <strong>and</strong> perform the<br />
audit to obtain reasonable assurance about whether the consolidated financial statements are free from material misstatement.<br />
An audit involves performing procedures to obtain audit evidence about the amounts <strong>and</strong> disclosures in the consolidated financial statements. The<br />
procedures selected depend on the auditor’s judgment, including the assessment of the risks of material misstatement of the consolidated financial<br />
statements, whether due to fraud or error. In making those risk assessments, the auditor considers internal control relevant to the entity’s preparation<br />
<strong>and</strong> fair presentation of the consolidated financial statements in order to design audit procedures that are appropriate in the circumstances, but not<br />
for the purpose of expressing an opinion on the effectiveness of the entity’s internal control. An audit also includes evaluating the appropriateness of<br />
accounting policies used <strong>and</strong> the reasonableness of accounting estimates made by management, as well as evaluating the overall presentation of the<br />
consolidated financial statements.<br />
We believe that the audit evidence we have obtained in our audits is sufficient <strong>and</strong> appropriate to provide a basis for our audit opinion.<br />
Opinion<br />
In our opinion, the consolidated financial statements present fairly, in all material respects, the financial position of <strong>Connacher</strong> <strong>Oil</strong> <strong>and</strong> <strong>Gas</strong> Limited as<br />
at December 31, <strong>2011</strong>, December 31, 2010 <strong>and</strong> January 1, 2010 <strong>and</strong> its financial performance <strong>and</strong> its cash flows for the years ended December 31,<br />
<strong>2011</strong> <strong>and</strong> 2010 in accordance with International Financial Reporting St<strong>and</strong>ards.<br />
Signed,<br />
“DELOITTE & TOUCHE LLP”<br />
Chartered Accountants<br />
March 15, 2012<br />
Calgary, Alberta
AR <strong>2011</strong><br />
PG 46<br />
Consolidated Balance Sheet<br />
Canadian dollar in thous<strong>and</strong>s<br />
As at Notes December 31, <strong>2011</strong> December 31, 2010 January 1, 2010<br />
ASSETS<br />
CURRENT ASSETS<br />
Cash $ 117,045 $ 19,532 $ 256,787<br />
Trade <strong>and</strong> accrued receivables 5 62,999 57,419 43,067<br />
Inventories 6 60,146 57,144 36,871<br />
Other assets 7 12,697 17,653 17,774<br />
Assets held for sale 8 – 88,157 –<br />
252,887 239,905 354,499<br />
NON–CURRENT ASSETS<br />
Other assets 7 676 615 3,419<br />
Investment in associate 8 – – 48,240<br />
Exploration <strong>and</strong> evaluation assets 9 117,429 110,949 96,162<br />
Property, plant <strong>and</strong> equipment 10 1,234,634 1,217,668 1,123,914<br />
1,352,739 1,329,232 1,271,735<br />
$ 1,605,626 $ 1,569,137 $ 1,626,234<br />
LIABILITIES AND SHAREHOLDERS’ EQUITY<br />
CURRENT LIABILITIES<br />
Trade <strong>and</strong> accrued payables 11 $ 126,367 $ 81,370 $ 104,804<br />
Risk management contracts 12 7,610 8,984 4,520<br />
Liabilities relating to assets held for sale 8 – 10,907 –<br />
Current portion of long–term debt 13 102,034 – –<br />
236,011 101,261 109,324<br />
NON–CURRENT LIABILITIES<br />
Risk management contracts 12 – 9,879 –<br />
Long–term debt 13 856,068 847,387 879,739<br />
Decommissioning liabilities 14 66,078 60,038 53,729<br />
Retirement benefit obligation 15 415 193 344<br />
Deferred income taxes 16 25,978 27,192 34,501<br />
948,539 944,689 968,313<br />
SHAREHOLDERS’ EQUITY<br />
Share capital 17 620,266 618,628 593,119<br />
Contributed surplus 18 38,841 36,107 31,040<br />
Deficit (233,709) (119,604) (74,935)<br />
Accumulated other comprehensive loss (4,322) (7,452) (627)<br />
Accumulated other comprehensive loss<br />
relating to assets held for sale<br />
8 – (4,492) –<br />
421,076 523,187 548,597<br />
$ 1,605,626 $ 1,569,137 $ 1,626,234<br />
The accompanying notes to the consolidated financial statements are an integral part of these statements.<br />
Approved by the Board:<br />
D.H. Bessell, Director<br />
W.C. Seth, Director
AR <strong>2011</strong><br />
PG 47<br />
Consolidated Statements of Operations <strong>and</strong><br />
Comprehensive Loss<br />
Canadian dollar in thous<strong>and</strong>s, except per share amounts<br />
For the year ended December 31 Notes <strong>2011</strong> 2010<br />
INCOME<br />
Revenue, net of royalties 4 $ 872,806 $ 589,931<br />
Interest <strong>and</strong> other income 979 256<br />
873,785 590,187<br />
EXPENSES<br />
Blending <strong>and</strong> costs of products sold 505,585 343,582<br />
Production <strong>and</strong> operating 131,589 101,148<br />
Transportation <strong>and</strong> h<strong>and</strong>ling 63,120 26,772<br />
General <strong>and</strong> administrative 34,224 23,806<br />
Share–based compensation 18.4 3,453 5,019<br />
Exploration <strong>and</strong> evaluation expenses 210 964<br />
Depletion, depreciation, amortization <strong>and</strong> impairment 122,009 79,842<br />
(Gain) loss on risk management contracts 12 (2,127) 17,186<br />
Finance charges 19 95,588 69,445<br />
Refinancing of long–term debt 13.3 61,971 –<br />
Foreign exchange loss (gain) 20 8,909 (41,641)<br />
(Gain) loss on disposition of assets 21 (43,457) 811<br />
Share of interest in <strong>and</strong> loss on disposition of associate 8.2 6,840 16,016<br />
987,914 642,950<br />
LOSS BEFORE INCOME TAX (114,129) (52,763)<br />
Income tax recovery 16 24 8,094<br />
NET LOSS (114,105) (44,669)<br />
OTHER COMPREHENSIVE INCOME (LOSS) AFTER TAX<br />
Items recognized in other comprehensive income (loss)<br />
Exchange loss (gain) on translating foreign operations 3,130 (7,452)<br />
Available for sale financial asset 21 (9,080) –<br />
Share of other comprehensive loss of associate 16 – (4,287)<br />
Items reclassified to net earnings (loss)<br />
Available for sale financial asset 21 9,080 –<br />
Share of other comprehensive loss of associate 8.2 4,492 422<br />
OTHER COMPREHENSIVE INCOME (LOSS) AFTER TAX 7,622 (11,317)<br />
TOTAL COMPREHENSIVE LOSS $ (106,483) $ (55,986)<br />
NET LOSS PER SHARE – basic <strong>and</strong> diluted 17 $ (0.25) $ (0.10)<br />
The accompanying notes to the consolidated financial statements are an integral part of these statements.
AR <strong>2011</strong><br />
PG 48<br />
Consolidated Statements of Changes in Shareholders’ Equity<br />
Canadian dollar in thous<strong>and</strong>s<br />
For the year ended December 31<br />
<strong>2011</strong> 2010<br />
(Canadian dollar in thous<strong>and</strong>s)<br />
SHARE CAPITAL<br />
Balance, beginning of year $ 618,628 $ 593,119<br />
Cash received on flow–through common shares issuance – 23,074<br />
Cash received on exercise of stock options 752 1,936<br />
Transfer from contributed surplus – stock options exercised 423 1,082<br />
Transfer from contributed surplus – share awards settled 534 480<br />
Share issue costs (71) (1,063)<br />
Balance, end of year $ 620,266 $ 618,628<br />
CONTRIBUTED SURPLUS<br />
Balance, beginning of year $ 36,107 $ 31,040<br />
Share–based compensation 3,691 6,629<br />
Transfer to share capital – stock options exercised (423) (1,082)<br />
Transfer to share capital – share awards settled (534) (480)<br />
Balance, end of year $ 38,841 $ 36,107<br />
DEFICIT<br />
Balance, beginning of year $ (119,604) $ (74,935)<br />
Net loss (1) (114,105) (44,669)<br />
Balance, end of year $ (233,709) $ (119,604)<br />
ACCUMULATED OTHER COMPREHENSIVE LOSS<br />
Balance, beginning of year (including classified as held for sale) $ (11,944) $ (627)<br />
Exchange differences on translating foreign operations (1) 3,130 (7,452)<br />
Available for sale financial assets (1) (9,080) –<br />
Share of other comprehensive loss of associate (1) – (4,287)<br />
Amounts reclassified to net earnings (loss) – Available for sale assets (1) 9,080 –<br />
Amounts reclassified to net earnings (loss)<br />
– Share of other comprehensive loss of associate (1) 4,492 422<br />
Balance, end of year $ (4,322) $ (11,944)<br />
Total Shareholders’ Equity $ 421,076 $ 523,187<br />
(1) Total comprehensive loss for <strong>2011</strong> is $106.5 million (2010 - $55.9 million).<br />
The accompanying notes to the consolidated financial statements are an integral part of these statements.
AR <strong>2011</strong><br />
PG 49<br />
Consolidated Statements of Cash Flow<br />
Canadian dollar in thous<strong>and</strong>s<br />
For the year ended December 31 Notes <strong>2011</strong> 2010<br />
OPERATING<br />
Net loss $ (114,105) $ (44,669)<br />
Adjustments for:<br />
Share–based compensation 18.4 3,453 5,019<br />
Depletion, depreciation, amortization <strong>and</strong> impairment 122,009 79,842<br />
Unrealized (gain) loss on risk management contracts 12 (11,252) 14,343<br />
Interest expense on long-term debt 84,759 55,637<br />
Finance charges – non-cash 9,141 11,539<br />
Refinancing of long–term debt 13.3 61,971 –<br />
Unrealized foreign exchange loss (gain) 20 22,980 (39,603)<br />
Realized foreign exchange gain on settlement of debt 13.3 (11,592) –<br />
(Gain) loss on disposition of assets 21 (43,457) 811<br />
Defined benefit plan expense 15 708 426<br />
Share of interest in <strong>and</strong> loss on associate 8.2 6,840 16,016<br />
Deferred income tax recovery 16 (1,558) (7,803)<br />
129,897 91,558<br />
Changes in non–cash working capital 23 14,048 (23,962)<br />
Defined benefit plan contributions 15 (504) (517)<br />
Decommissioning liabilities settled 14 (1,018) (647)<br />
Cash flow from operating activities 142,423 66,432<br />
INVESTING<br />
Expenditures on property, plant <strong>and</strong> equipment (134,228) (175,095)<br />
Exploration <strong>and</strong> evaluation expenditures (22,399) (25,220)<br />
Proceeds on disposition of assets 117,258 1,721<br />
Proceeds on sale of equity securities 21 21,064 –<br />
Changes in non–cash working capital 23 5,519 (34,797)<br />
Cash flow used in investing activities (12,786) (233,391)<br />
FINANCING<br />
Proceeds on issue of common shares 17 752 27,282<br />
Share issue costs 17 (71) (1,489)<br />
Interest paid on long-term debt (65,460) (92,019)<br />
Proceeds on issue of long–term debt 13 950,912 –<br />
Repayment of long–term debt 13 (899,402) –<br />
Long–term debt issue cost 13 (18,451) –<br />
Cash flow used in financing activities (31,720) (66,226)<br />
NET INCREASE (DECREASE) IN CASH 97,917 (233,185)<br />
Foreign exchange loss on cash balances held in foreign currency (404) (4,070)<br />
CASH, BEGINNING OF YEAR 19,532 256,787<br />
CASH, END OF YEAR $ 117,045 $ 19,532<br />
The accompanying notes to the consolidated financial statements are an integral part of these statements.
AR <strong>2011</strong><br />
PG 50<br />
Notes to the Consolidated Financial Statements<br />
For the years ended December 31, <strong>2011</strong> <strong>and</strong> 2010<br />
1. Nature of Operations<br />
<strong>Connacher</strong> <strong>Oil</strong> <strong>and</strong> <strong>Gas</strong> Limited (“<strong>Connacher</strong>”) is a public company listed on the Toronto Stock Exchange under the symbol CLL <strong>and</strong> headquartered in<br />
Calgary, Alberta, Canada. The consolidated financial statements, as at December 31, <strong>2011</strong> <strong>and</strong> for the year then ended, comprise those of <strong>Connacher</strong><br />
<strong>and</strong> its subsidiaries (collectively referred to as the “company”). The address of the company’s principal office is Suite 900, 322 – 6th Avenue S.W.,<br />
Calgary, Alberta. The company is engaged in the business of development, production <strong>and</strong> refining of bitumen, crude oil <strong>and</strong> natural gas.<br />
These consolidated financial statements were approved <strong>and</strong> authorized for issuance by the Board of Directors on March 15, 2012.<br />
2. Basis of PREPARATION<br />
2.1 Statement of compliance<br />
The consolidated financial statements have been prepared in accordance with International Financial Reporting St<strong>and</strong>ards (“IFRS”). These are the company’s<br />
first consolidated financial statements prepared under IFRS. As a result, IFRS 1, “First–time Adoption of International Financial Reporting St<strong>and</strong>ards” has<br />
been applied. In these financial statements, the term “previous GAAP” refers to Canadian generally accepted accounting principles prior to the adoption of<br />
IFRS. An explanation of the impacts on financial performance, financial position <strong>and</strong> cash flows on the transition to IFRS is provided in note 27.<br />
2.2 Basis of measurement<br />
These consolidated financial statements have been prepared on a historical cost basis except for the following which have been measured at fair value:<br />
• Risk management contracts;<br />
• Investment in equity securities <strong>and</strong> share purchase warrants;<br />
• Liabilities for cash–settled share–based payment arrangements;<br />
• Assets classified as held for sale where the carrying amount is higher than the fair value; <strong>and</strong><br />
• Convertible Debentures.<br />
2.3 Functional <strong>and</strong> presentation currency<br />
The consolidated financial statements are presented in Canadian dollars which is the functional currency of <strong>Connacher</strong>. The functional currency of the<br />
company’s subsidiary companies is primarily the US dollar.<br />
2.4 Use of estimates <strong>and</strong> judgments<br />
The timely preparation of consolidated financial statements requires management to make judgments, estimates <strong>and</strong> assumptions that affect the<br />
reported amounts of assets <strong>and</strong> liabilities at the date of the consolidated financial statements <strong>and</strong> the reported amounts of revenues <strong>and</strong> expenses<br />
during the reporting period. Although these estimates are based on management’s best knowledge of the amount, event or actions, actual results<br />
ultimately may differ from those estimates. Accordingly, actual reported amounts may differ from estimated amounts as future confirming events occur.<br />
Estimation of petroleum <strong>and</strong> natural gas reserves<br />
Petroleum <strong>and</strong> natural gas reserve estimates are used in the unit–of–production depletion <strong>and</strong> depreciation calculation, determination of the timing of<br />
ab<strong>and</strong>onment costs <strong>and</strong> impairment analysis of upstream assets. The company’s proved plus probable reserves are estimated annually by independent<br />
reserves engineers with reference to available geological, geophysical <strong>and</strong> engineering data. Estimates of petroleum <strong>and</strong> natural gas reserves are<br />
inherently imprecise, require the application of judgment <strong>and</strong> are subject to regular revision, either upward or downward, based on new information.<br />
The impact of future changes to estimates on the consolidated financial statements of subsequent periods could be material.<br />
Changes to estimates of petroleum <strong>and</strong> natural gas reserves affect prospectively the amounts of depletion, depreciation, amortization <strong>and</strong> impairment<br />
charged <strong>and</strong>, consequently, the carrying amounts of petroleum <strong>and</strong> natural gas properties <strong>and</strong> exploration <strong>and</strong> evaluation assets.<br />
Information about the carrying amounts of petroleum <strong>and</strong> natural gas properties <strong>and</strong> exploration <strong>and</strong> evaluation assets <strong>and</strong> the amounts charged to<br />
net earnings (loss), including depletion, depreciation, amortization <strong>and</strong> impairment, is presented in note 9 <strong>and</strong> 10.
AR <strong>2011</strong><br />
PG 51<br />
Impairment of assets<br />
For the purposes of impairment analysis of the company’s assets, the key assumptions used in estimating cash flows are future commodity prices,<br />
expected production volumes <strong>and</strong> refinery throughput, cost structures <strong>and</strong> the outlook of market supply <strong>and</strong> dem<strong>and</strong> conditions appropriate to the<br />
local circumstances <strong>and</strong> environment. These assumptions <strong>and</strong> estimates are highly uncertain matters <strong>and</strong> are subject to change as new information<br />
becomes available. Changes in economic conditions can also affect the rate used to discount future cash flow estimates.<br />
Changes in assumptions could affect the carrying amounts of assets <strong>and</strong> impairment charges <strong>and</strong> reversals will affect net earnings (loss).<br />
Information about the carrying amounts of assets <strong>and</strong> impairments is presented in notes 9 <strong>and</strong> 10.<br />
Decommissioning liabilities<br />
Provisions are recognized for the future ab<strong>and</strong>onment <strong>and</strong> reclamation of petroleum, natural gas <strong>and</strong> refining properties at the end of their economic<br />
lives. The estimated cost is recognized in net earnings (loss) over the life of the reserves on a unit–of–production basis. Changes in the estimates<br />
of costs to be incurred, reserves or in the rate of production will therefore affect net earnings (loss), generally over the remaining economic life of<br />
petroleum <strong>and</strong> natural gas assets.<br />
Estimates of the amounts of decommissioning provisions recognized are based on current legal <strong>and</strong> constructive requirements, technology <strong>and</strong> price<br />
levels. Because actual outflows can differ from estimates due to changes in laws, regulations, public expectations, technology, industry st<strong>and</strong>ards,<br />
prices <strong>and</strong> conditions, <strong>and</strong> can take place many years in the future, the carrying amounts of such provisions are regularly reviewed <strong>and</strong> adjusted to<br />
take account of such changes. The interest rate used to discount the cash flows is reviewed quarterly.<br />
Information about decommissioning liabilities is presented in note 14.<br />
Taxation<br />
Tax provisions are recognized when it is considered probable that there will be a future outflow of funds to a taxing authority. In such cases, provision<br />
is made for the amount that is expected to be settled, where this can be reasonably estimated. This requires the application of judgment as to the<br />
ultimate outcome, which can change over time depending on facts <strong>and</strong> circumstances. A change in estimate of the likelihood of a future outflow <strong>and</strong>/<br />
or in the expected amount to be settled would be recognized in net earnings (loss) in the period in which the change occurs.<br />
Deferred tax assets are recognized only to the extent it is considered probable that those assets will be recoverable. This involves an assessment<br />
of when those deferred tax assets are likely to be realized, <strong>and</strong> a judgment as to whether or not there will be sufficient taxable profits available to<br />
offset the tax assets when they do reverse. This requires assumptions regarding future profitability <strong>and</strong> is therefore inherently uncertain. To the extent<br />
assumptions regarding future profitability change, there can be an increase or decrease in the amounts recognized in respect of deferred tax assets<br />
as well as in the amounts recognized in net earnings (loss) in the period in which the change occurs.<br />
Tax provisions are based on enacted or substantively enacted laws. Changes in those laws could affect amounts recognized in net earnings (loss)<br />
both in the period of change, which would include any impact on cumulative provisions, <strong>and</strong> in future periods.<br />
Financial instruments<br />
The company records its financial instruments at fair value on inception <strong>and</strong> at each reporting period depending on their subsequent classification.<br />
The calculation of the fair value requires judgment around expected outcome <strong>and</strong> is based on multiple variables such as the company’s credit risk <strong>and</strong><br />
interest rate spread. The estimated fair value of the financial instruments, by their very nature, is subject to measurement uncertainty.<br />
Other significant areas of judgment<br />
The estimates of net realizable value of inventory involve estimating future selling prices <strong>and</strong> accordingly, are subject to measurement uncertainty.<br />
The amounts for pension assets, obligations <strong>and</strong> pension costs charged to net earnings (loss) depend on certain actuarial <strong>and</strong> economic assumptions,<br />
which are subject to measurement uncertainty.<br />
Amounts recorded for share–based compensation expense are based, in part, on the historical volatility of the company’s share price, which may not<br />
be indicative of future volatility. Accordingly, those amounts are subject to measurement uncertainty.<br />
3. SIGNIFICANT ACCOUNTING POLICIES<br />
3.1 Basis of consolidation<br />
The consolidated financial statements include the financial statements of <strong>Connacher</strong> <strong>and</strong> its subsidiaries, being those which are controlled by the<br />
company. Control exists when the company has the power to govern the financial <strong>and</strong> operating policies of an entity so as to obtain benefits from its<br />
activities. The financial statements of subsidiaries are included in the consolidated financial statements from the date that control commences until the<br />
date that control ceases, using consistent accounting policies. All inter–company balances <strong>and</strong> transactions, including gains <strong>and</strong> losses arising from<br />
such transactions, are eliminated.
AR <strong>2011</strong><br />
PG 52<br />
3.2 Inventories<br />
Inventories are stated at the lower of cost or net realizable value. Cost comprises direct purchase <strong>and</strong> blending costs, costs of production <strong>and</strong> other<br />
indirect costs <strong>and</strong> is determined using the weighted average cost method. Net realizable value is the estimated selling price in the ordinary course of<br />
business less costs to complete <strong>and</strong> sell.<br />
3.3 Exploration <strong>and</strong> Evaluation assets (“E&E”)<br />
E&E expenditures incurred prior to acquiring the legal right to explore are charged to expense as incurred <strong>and</strong> recorded as E&E expense in net<br />
earnings (loss).<br />
All costs directly associated with exploration <strong>and</strong> evaluation of oil <strong>and</strong> gas activities are initially capitalized. E&E costs are those expenditures where<br />
technical feasibility <strong>and</strong> commercial viability has not been yet been determined <strong>and</strong> include license <strong>and</strong> unproved property acquisition costs, geological<br />
<strong>and</strong> geophysical costs <strong>and</strong> costs of drilling exploratory wells.<br />
E&E costs are not amortized except for the costs associated with unproved l<strong>and</strong> which are amortized to expense over the lease term. E&E assets are<br />
transferred to property, plant <strong>and</strong> equipment when they are determined to meet technical feasibility <strong>and</strong> commercial viability.<br />
The carrying amount of E&E assets is tested for impairment in accordance with note 3.6 annually, upon transfer to property, plant <strong>and</strong> equipment,<br />
when an area is determined not to be technically feasible <strong>and</strong> commercially viable or the company decides not to continue with its activity.<br />
3.4 Property, plant <strong>and</strong> equipment (“PP&E”)<br />
Recognition <strong>and</strong> measurement<br />
Property, plant <strong>and</strong> equipment is initially recognized at cost which represents all costs directly associated with the development of petroleum <strong>and</strong><br />
natural gas reserves where technical feasibility <strong>and</strong> commercial viability have been determined. Such costs include drilling costs of development wells,<br />
tangible costs of facilities <strong>and</strong> infrastructure construction, costs of optimization <strong>and</strong> enhanced recovery projects, proved property acquisition costs,<br />
asset decommissioning costs, transfers from E&E assets <strong>and</strong> borrowing costs relating to qualifying assets.<br />
Expenditures on major maintenance repairs comprise the cost of replacement assets or parts of assets, inspection costs <strong>and</strong> overhaul costs. Where<br />
an asset or part of an asset that was separately depreciated is replaced <strong>and</strong> it is probable that future economic benefits associated with the item<br />
will flow to the company, the expenditure is capitalized <strong>and</strong> the carrying amount of the replaced asset is derecognized. Major inspection <strong>and</strong> overhaul<br />
costs associated with major maintenance programs are capitalized <strong>and</strong> amortized over the period to the next inspection. Normal overhaul <strong>and</strong> repair<br />
<strong>and</strong> maintenance costs are charged to net earnings (loss) when incurred.<br />
Property, plant <strong>and</strong> equipment are subsequently carried at cost less accumulated depletion, depreciation, amortization <strong>and</strong> impairment. Gains <strong>and</strong> losses<br />
on disposals are determined by comparing disposal proceeds with the carrying amounts of assets sold <strong>and</strong> are recognized in net earnings (loss).<br />
Depletion, depreciation, amortization <strong>and</strong> impairment<br />
Property, plant <strong>and</strong> equipment relating to petroleum <strong>and</strong> natural gas properties including related facilities are depleted <strong>and</strong> depreciated using the unit–<br />
of–production method over the proved <strong>and</strong> probable reserves before royalties <strong>and</strong> determined using forecast prices <strong>and</strong> costs. For the purpose of this<br />
calculation, natural gas is converted to oil on an energy equivalent basis. Estimated future costs to develop proved <strong>and</strong> probable reserves are included<br />
in costs subject to depletion. Costs of major development projects are excluded from depletion <strong>and</strong> depreciation until the asset is available for use.<br />
Property, plant <strong>and</strong> equipment relating to refining properties are depreciated <strong>and</strong> amortized using the straight–line method, based on the estimated<br />
useful lives of assets which range from 3 to 16 years.<br />
Property, plant <strong>and</strong> equipment relating to the corporate office include leasehold improvements <strong>and</strong> computer <strong>and</strong> office equipment. Leasehold<br />
improvements are amortized using the straight–line method over the lease term whereas computer <strong>and</strong> office equipment are amortized using the<br />
declining balance method at 20% to 30% per annum.<br />
The estimates of useful lives of property, plant <strong>and</strong> equipment are reviewed annually <strong>and</strong> if, necessary, changes are accounted for prospectively.<br />
Impairment<br />
The carrying amount of property, plant <strong>and</strong> equipment is reviewed for impairment, in accordance with note 3.6, whenever events or changes in<br />
circumstances indicate the carrying amount may not be recoverable.<br />
3.5 Business combinations <strong>and</strong> goodwill<br />
Business combinations are accounted for using the acquisition method. The acquired identifiable net assets are measured at their fair value at the<br />
date of acquisition. Any excess of the purchase price over the fair value of the net assets acquired is recognized as goodwill. Any deficiency of the<br />
purchase price below the fair value of the net assets acquired is recorded as a gain in net earnings (loss). Associated transaction costs are expensed<br />
when incurred.
AR <strong>2011</strong><br />
PG 53<br />
Goodwill is allocated to the applicable cash–generating unit as defined in note 3.6. Goodwill is not amortized <strong>and</strong> is tested for impairment annually<br />
on December 31 or whenever there is an indication that the cash-generating unit to which goodwill is allocated may be impaired, in accordance with<br />
note 3.6.<br />
3.6 Impairment<br />
Non–financial assets (E&E, PP&E <strong>and</strong> Goodwill)<br />
When impairment indicators exist or when impairment testing is required for non–financial assets, an impairment test is carried out in which the<br />
carrying amounts of those assets are compared to their recoverable amount, which is the higher of fair value less costs to sell (“FVLCS”) <strong>and</strong> value–<br />
in–use (“VIU”). For purposes of the impairment test, E&E, PP&E <strong>and</strong> goodwill are grouped together into the smallest group of assets that generates<br />
largely independent cash flows from other assets or groups of assets (the “cash–generating unit” or “CGU”).<br />
VIU is determined by estimating the discounted future cash flows expected to be derived from continuing use of the assets. In determining FVLCS,<br />
recent market transactions are taken into account, if available. If no such transactions can be identified, an appropriate valuation model is used. These<br />
calculations are corroborated by valuation multiples or other available fair value indicators.<br />
Impairment losses are recognized in net earnings (loss) <strong>and</strong> reported within depletion, depreciation, amortization <strong>and</strong> impairment. Impairment losses<br />
recognized in respect of a CGU are allocated first to reduce the carrying amount of any goodwill allocated to the CGU <strong>and</strong> then to reduce the carrying<br />
amount of the other assets in the CGU.<br />
An impairment loss in respect of goodwill is not reversed. In respect of other assets, impairment losses recognized in prior years are assessed at each<br />
reporting date for any indications that the loss has decreased or no longer exists. If the amount of the impairment loss decreases in a subsequent<br />
period <strong>and</strong> the decrease can be objectively related to an event occurring after the impairment was recognized, the impairment loss is reversed up to the<br />
original carrying amount of the asset that would have been determined, net of depletion, depreciation, amortization <strong>and</strong> impairment, if no impairment loss<br />
had been recognized. Such reversal is recognized in net earnings (loss) <strong>and</strong> reported within depletion, depreciation, amortization <strong>and</strong> impairment.<br />
Financial assets (Cash, Trade <strong>and</strong> accrued receivable <strong>and</strong> Investment in equity securities)<br />
A financial asset not carried at fair value through profit or loss is assessed at each reporting date to determine whether there is objective evidence<br />
that it is impaired. A financial asset is impaired if objective evidence indicates that a loss event has occurred after the initial recognition of the asset,<br />
<strong>and</strong> that the loss event had a negative effect on the estimated future cash flows of that asset that can be estimated reliably.<br />
The company considers evidence of impairment for trade <strong>and</strong> accrued receivables at a specific asset level. All individually significant trade <strong>and</strong><br />
accrued receivables are assessed for specific impairment. An impairment loss is calculated as the difference between its carrying amount <strong>and</strong> the<br />
present value of the estimated future cash flows discounted at the asset’s original effective interest rate. Losses are recognized in net earnings (loss)<br />
<strong>and</strong> reflected in an allowance account against trade <strong>and</strong> accrued receivables. When a subsequent event causes the amount of impairment loss to<br />
decrease, the decrease in impairment loss is reversed through net earnings (loss).<br />
3.7 Investment in associate<br />
An associate is an entity over which the company has the right to exercise significant influence, but not control, over the financial <strong>and</strong> operating<br />
policies. The investment in associate is accounted for using the equity method of accounting. Under the equity method, the investment is initially<br />
recorded at cost <strong>and</strong> subsequently adjusted for the post–acquisition changes in the company’s share of net assets of associate, after adjustment to<br />
align the accounting policies with those of the company. The company’s net earnings or loss reflects the company’s share of the net earnings or loss<br />
after tax of the associate.<br />
The company assesses the investment in associate for impairment whenever events or changes in circumstances indicate that the carrying amount<br />
may not be recoverable. If any such indication of impairment exists, the carrying amount of the investment is compared with its recoverable amount,<br />
being the higher of its fair value less costs to sell <strong>and</strong> value in use. Where the carrying amount exceeds the recoverable amount, the investment is<br />
written down to its recoverable amount.<br />
The company ceases to use the equity method of accounting on the date from which it no longer has significant influence over the associate, or when<br />
the investment becomes held for sale.<br />
Losses of an associate in excess of the company’s equity interest in that associate are recognized only to the extent that the company has incurred<br />
legal or constructive obligations or made payments on behalf of the associate.<br />
3.8 Income taxes<br />
Tax expense comprises current <strong>and</strong> deferred taxes. Tax expense is recognized in net earnings (loss) except when it relates to items recognized in<br />
other comprehensive income (loss). Income tax assets <strong>and</strong> liabilities are presented separately in the consolidated balance sheet except where there is<br />
a right of set–off within fiscal jurisdictions <strong>and</strong> an intention to settle such balances on a net basis.
AR <strong>2011</strong><br />
PG 54<br />
Current tax expense is based on the results for the period as adjusted for items that are not taxable or not deductible. Current tax is calculated<br />
using tax rates <strong>and</strong> laws that have been enacted or substantively enacted at the end of the reporting period. Management periodically evaluates<br />
positions taken in tax returns with respect to situations in which applicable tax regulation is subject to interpretation. Provisions are established where<br />
appropriate on the basis of amounts expected to be paid to the tax authorities.<br />
Deferred tax is recognized in the balance sheet using the liability method of accounting for income taxes, on temporary differences arising between<br />
the tax bases of assets <strong>and</strong> liabilities <strong>and</strong> their carrying amounts. Deferred tax is calculated using tax rates <strong>and</strong> laws that have been enacted or<br />
substantively enacted at the end of the reporting period, <strong>and</strong> which are expected to apply when the related deferred tax asset is realized or the<br />
deferred tax liability is settled.<br />
3.9 Provisions<br />
Decommissioning liabilities<br />
The company recognizes a decommissioning liability for ab<strong>and</strong>oning petroleum <strong>and</strong> natural gas wells, related facilities, compressors <strong>and</strong> plants,<br />
removal of equipment from leased acreage <strong>and</strong> for returning such l<strong>and</strong> to its original condition, in the period in which a well or related asset is drilled,<br />
constructed or acquired. The decommissioning liability is estimated using the present value of the estimated expected future cash outflows at a<br />
risk–free interest rate. The obligation is reviewed regularly by management, based upon current costs, laws <strong>and</strong> regulations, public expectations,<br />
technology, <strong>and</strong> industry st<strong>and</strong>ards. The liability is initially capitalized as part of the carrying amount of the related property, plant <strong>and</strong> equipment<br />
The effects of changes to the liability resulting from revisions to the timing or the amount of the original estimate of the provision are reflected on a<br />
prospective basis, generally by adjustment to the carrying amount of the related property, plant <strong>and</strong> equipment. Actual ab<strong>and</strong>onment <strong>and</strong> reclamation<br />
expenditures are charged against the liability as incurred <strong>and</strong> obligations related to properties disposed are removed.<br />
The company also has decommissioning obligations with respect to certain of its refinery assets due to various legal obligations to clean <strong>and</strong>/or dispose<br />
of various component parts of the refinery at the time they are retired. However, these component parts can be used for extended <strong>and</strong> indeterminate<br />
periods of time as long as they are properly maintained <strong>and</strong>/or upgraded. It is the Company’s practice <strong>and</strong> current intent to maintain its refinery assets<br />
<strong>and</strong> continue making improvements to the assets based on technological advances. As such, the present value of such obligations is minimal.<br />
Premium on flow–through common shares<br />
Under Canadian income tax legislation, a company is permitted to issue flow–through shares whereby the company is obligated to incur qualifying<br />
expenditures related to petroleum <strong>and</strong> natural gas exploration activities <strong>and</strong> to renounce the related income tax deductions to the investors. Generally,<br />
due to the benefit of transferring the tax deduction to the investors, the shares issued on flow–through basis are offered at prices higher than the<br />
prevailing quoted prices of the shares. Accordingly, the proceeds from issuance of these shares are allocated between share capital <strong>and</strong> the liability<br />
to incur these qualifying expenditures The amounts allocated to share capital represents the quoted price of the existing shares whereas the liability<br />
represents the difference between the quoted price of the existing shares <strong>and</strong> the amount the investor pays for the flow-through shares. The liability is<br />
reversed when qualifying expenditures are renounced <strong>and</strong> reported within deferred income tax in net earnings (loss).<br />
3.10 Employee benefits<br />
Employee retirement plans<br />
The company maintains a funded defined benefit pension plan <strong>and</strong> defined contribution savings plans.<br />
A valuation of the defined benefit plan is carried out annually by independent actuaries, using the projected unit credit method to calculate the<br />
defined benefit obligation. Pension cost primarily represents the increase in the actuarial present value of the obligation for pension benefits based<br />
on employee service during the year <strong>and</strong> the interest on this obligation in respect of employee service in previous years, net of the expected return<br />
on plan assets. Plan assets are valued at fair value. The present value of the accumulated benefit obligation is determined by actuaries. The expected<br />
return on plan assets is based on market expectations at the beginning of the fiscal period for returns over the entire life of the benefit obligation.<br />
Actuarial gains <strong>and</strong> losses are recognized as income or expense when the net cumulative unrecognized actuarial gains <strong>and</strong> losses at the end of the<br />
previous reporting year exceed 10% of the higher of the defined benefit obligation <strong>and</strong> the fair value of plan assets at that date. These gains <strong>and</strong><br />
losses are recognized in net earnings (loss) over the expected average remaining working lives of the employees participating in the plan.<br />
For defined contribution saving plans, the cost is the amount of employer contributions payable for the period.<br />
Share–based compensation plans<br />
Directors, employees <strong>and</strong> consultants of the company receive remuneration in the form of share–based payment transactions, whereby those<br />
individuals render services as consideration for equity instruments. The company maintains a stock option plan, share award incentive plan <strong>and</strong> share<br />
unit plan. Share–based compensation is initially recognized over the vesting period at the fair value on the date of grant with a corresponding increase<br />
to contributed surplus for equity–settled plans <strong>and</strong> to trade <strong>and</strong> accrued payables for cash–settled plans. Equity–settled plans are subsequently not<br />
remeasured whereas the cash–settled plans are remeasured to fair value at each reporting period–end. Fair value on the date of grant is estimated<br />
using either a Black–Scholes option pricing model or the closing price of the common shares, as defined in the plans. Upon the issue of shares under<br />
the plans, the proceeds received on exercise of stock options <strong>and</strong> the amounts previously recognized in contributed surplus for the plans are credited<br />
to share capital.
AR <strong>2011</strong><br />
PG 55<br />
3.11 Leases<br />
Agreements under which payments are made to owners in return for the right to use an asset for a period are accounted for as leases. Leases that<br />
transfer substantially all the risks <strong>and</strong> rewards of ownership are recognized at the commencement of the lease term as finance leases within property,<br />
plant <strong>and</strong> equipment <strong>and</strong> liabilities at the fair value of the leased asset or, if lower, at the present value of the minimum lease payments. Finance lease<br />
payments are apportioned between interest expense <strong>and</strong> a reduction of the liability. All other leases are recorded as operating leases, <strong>and</strong> the costs<br />
are recognized in net earnings (loss) on a straight–line basis.<br />
3.12 Foreign currency<br />
Foreign currency transactions<br />
Transactions denominated in foreign currencies are translated to the respective functional currencies of the entities at monthly average exchange rates.<br />
Monetary assets <strong>and</strong> liabilities denominated in foreign currencies at the reporting date are translated to the functional currency at the exchange rate<br />
prevailing on the reporting date. Foreign exchange gains <strong>and</strong> losses resulting from the translation <strong>and</strong> settlement are recognized in net earnings (loss).<br />
Foreign operations<br />
The assets <strong>and</strong> liabilities of foreign operations are translated to Canadian dollars at exchange rates at the reporting date, while their statements of<br />
operations, other comprehensive income (loss) <strong>and</strong> cash flows are translated at monthly average rates. The resulting foreign currency differences<br />
are recognized in other comprehensive income (loss). Upon divestment of all or part of an interest in, or upon liquidation of, a foreign operation, the<br />
cumulative currency translation differences are generally recognized in net earnings (loss). Foreign exchange gains or losses arising from monetary<br />
assets <strong>and</strong> liabilities that form part of the net investment in the foreign operation are recognized in other comprehensive income (loss).<br />
3.13 Financial instruments<br />
Financial instruments consist of financial assets, financial liabilities <strong>and</strong> derivative financial instruments <strong>and</strong> are initially recognized at fair value plus,<br />
in the case of a financial assets or financial liability not at fair value through profit or loss, transactions costs. Measurement in subsequent periods<br />
depends on whether the financial instrument has been classified as “fair value through profit or loss”, “loans <strong>and</strong> receivables”, “available–for–sale”,<br />
“held–to–maturity”, or “financial liabilities measured at amortized cost“ as follows:<br />
Financial assets<br />
Financial assets comprise cash, trade <strong>and</strong> accrued receivable <strong>and</strong> investment in equity securities.<br />
Trade <strong>and</strong> accrued receivables are classified as “loans <strong>and</strong> receivables” <strong>and</strong> recorded at amortized cost less any impairment.<br />
Investments in equity securities are classified as available–for–sale <strong>and</strong> are carried at fair value, less any impairment. Unrealized gains <strong>and</strong> losses<br />
other than impairments are recognized in other comprehensive income (loss). On disposal, net gains <strong>and</strong> losses previously deferred in accumulated<br />
other comprehensive income (loss) are recognized in net earnings (loss).<br />
Financial liabilities<br />
Financial liabilities comprise trade <strong>and</strong> accrued payables, Senior Notes, Convertible Debentures <strong>and</strong> the amounts outst<strong>and</strong>ing under the Revolving<br />
Credit Facility.<br />
Trade <strong>and</strong> accrued payables <strong>and</strong> Senior Notes are classified as “financial liabilities measured at amortized cost” <strong>and</strong> are measured at amortized cost<br />
using the effective interest rate method.<br />
Convertible Debentures are classified as “fair value through profit <strong>and</strong> loss” whereby they are carried at the fair value at each reporting date.<br />
Unrealized gains <strong>and</strong> losses on remeasurement to fair value at each reporting period–end are recognized in net earnings (loss).<br />
Transaction costs relating to the Revolving Credit Facility are amortized over its term using the straight line method. The Facility is measured at<br />
amortized cost, net of transaction costs, in the event that amounts are drawn <strong>and</strong> outst<strong>and</strong>ing under the Facility at the reporting period-end. In the<br />
event no amounts are outst<strong>and</strong>ing at the reporting period-end, unamortized transaction costs are included in other assets.<br />
Derivative financial instruments<br />
Derivative financial instruments comprise investments in share purchase warrants, risk management contracts <strong>and</strong> embedded derivatives.<br />
The investment in share purchase warrants is classified as “fair value through profit <strong>and</strong> loss” whereby it is carried at the fair value at the reporting<br />
date. Unrealized gains <strong>and</strong> losses on remeasurement to fair value at each reporting period–end are recognized in net earnings (loss).<br />
The company enters into certain risk management contracts in order to reduce its exposure to market risks from fluctuations in commodity prices,<br />
foreign currency <strong>and</strong> interest rates. These instruments are not used for speculative purposes. The company has not designated its risk management<br />
contracts as effective accounting hedges <strong>and</strong> thus has not applied hedge accounting. As a result, all risk management contracts are classified as<br />
“fair value through profit <strong>and</strong> loss” <strong>and</strong> recorded on the balance sheet at fair value at each reporting date. Realized gains or losses from financial<br />
risk management contracts are recognized in net earnings (loss) as the contracts are settled. Unrealized gains <strong>and</strong> losses are recognized in net
AR <strong>2011</strong><br />
PG 56<br />
earnings (loss) at the end of each respective reporting period based on the changes in fair value of the contracts. The estimated fair value of all risk<br />
management contracts is derived from third–party market indications <strong>and</strong> forecasts. Attributable transaction costs are recorded in net earnings (loss).<br />
The company accounts for its forward physical delivery sales <strong>and</strong> purchase contracts that are entered into <strong>and</strong> continued to be held for the purpose<br />
of receipt or delivery of non–financial items in accordance with its expected purchase, sale or usage requirements, as executory contracts. As such,<br />
these contracts are not considered derivative financial instruments <strong>and</strong> thus have not been recorded on the consolidated balance sheet. Settlements<br />
of these physical sales <strong>and</strong> purchase contracts are recognized in related revenues <strong>and</strong> expenses.<br />
Derivatives embedded within contracts that are not already required to be recognized at fair value, <strong>and</strong> that are not closely related to the host contract<br />
in terms of economic characteristics <strong>and</strong> risks, are separated from their host contract <strong>and</strong> recognized at fair value; associated gains <strong>and</strong> losses are<br />
recognized in net earnings (loss). The company has no material embedded derivatives.<br />
3.14 Revenue recognition<br />
Revenue from sales of bitumen, crude oil, natural gas <strong>and</strong> refined products is recognized at the fair value of consideration received or receivable, after<br />
deducting royalties, when title passes to the customer. For sales by upstream operations, this generally occurs when product is physically transferred<br />
into a pipe, delivery trucks are accepted by the customer, or railcars have been transloaded. For sales by downstream operations, it is either at the<br />
loading or delivery point, depending on contractual conditions.<br />
3.15 Finance charges<br />
Finance charges comprise interest expense on long–term debt, amortization of transaction costs <strong>and</strong> st<strong>and</strong>–by fees of the Facility, unwinding of the<br />
discount on decommissioning liabilities, unrealized gain/loss on revaluation of convertible debentures <strong>and</strong> share purchase warrants, bank charges <strong>and</strong><br />
any impairment losses recognized on financial assets.<br />
Finance charges directly attributable to the acquisition, construction or production of qualifying assets, which are assets that necessarily take a<br />
substantial period of time to get ready for their intended use, are added to the cost of those assets, until such time as the assets are substantially<br />
ready for their intended use. All other finance costs are recognized in net earnings (loss) in the period in which they are incurred using the effective<br />
interest method. Interest has been capitalized at the rate of interest applicable to the specific borrowings financing the asset, or where financed<br />
through general borrowings, at a capitalization rate representing the average interest rate on such borrowings.<br />
3.16 Earnings (loss) per share<br />
The company presents basic <strong>and</strong> diluted earnings (loss) per share data for its common shares. Basic earnings (loss) per share is calculated by dividing<br />
net earnings (loss) attributable to ordinary equity holders of the company by the weighted average number of common shares outst<strong>and</strong>ing during<br />
the period. Diluted earnings (loss) per share is determined by adjusting the earnings or loss attributable to common shareholders <strong>and</strong> the weighted<br />
average number of common shares outst<strong>and</strong>ing for the effects of dilutive instruments, which may include convertible debentures, stock options, share<br />
incentive awards <strong>and</strong> share units.<br />
3.17 Non–current assets classified as held for sale<br />
Non–current assets, or disposal groups comprising assets <strong>and</strong> liabilities, that are expected to be recovered primarily through sale rather than<br />
through continuing use, are classified as held for sale. Immediately before classification as held for sale, the assets, or components of a disposal<br />
group, are remeasured in accordance with the company’s accounting policies. Thereafter, the assets, or disposal group, are measured at the lower<br />
of their carrying amount <strong>and</strong> fair value less cost to sell. Impairment losses on initial classification as held for sale <strong>and</strong> subsequent gains or losses on<br />
remeasurement are recognized in net earnings (loss). Property, plant <strong>and</strong> equipment classified as held for sale are not depleted or depreciated <strong>and</strong><br />
investment in associate classified as held for sale is not equity accounted.<br />
3.18 Fair value measurements<br />
Fair value measurements are estimates of the amounts for which assets or liabilities could be exchanged at the measurement date, based on<br />
the assumption that such exchanges take place between knowledgeable, unrelated parties in unforced transactions. Where available, fair value<br />
measurements are derived from prices quoted in active markets for identical assets or liabilities. In the absence of such information, other observable<br />
inputs are used to estimate fair value. Where publicly available information is not available, fair value is determined using estimation techniques that take<br />
into account market perspectives relevant to the asset or liability so as far as they can reasonably be ascertained, based on predominantly unobservable<br />
inputs. For risk management contracts <strong>and</strong> for share–based compensation plans, fair value estimations are generally determined using models <strong>and</strong><br />
other valuation methods, the key inputs for which include future prices, volatility, price correlation, counterparty credit risk <strong>and</strong> market liquidity, as<br />
appropriate; for other assets <strong>and</strong> liabilities, fair value estimations are generally based on the net present value of expected future cash flows.<br />
3.19 Recent accounting pronouncements issued but not yet adopted<br />
The company has reviewed new <strong>and</strong> revised accounting pronouncements that have been issued but are not yet effective for the financial year<br />
beginning January 1, <strong>2011</strong> <strong>and</strong> determined that the following may have an impact on the company:
AR <strong>2011</strong><br />
PG 57<br />
IAS 1 Presentation of Financial Statements (“IAS 1”)<br />
IAS 1 was amended in June <strong>2011</strong> to provide guidance on the presentation of items contained in other comprehensive income (“OCI”) <strong>and</strong> their<br />
classification within OCI. The amendments are to be applied for annual periods beginning on or after July 1, 2012 with earlier adoption permitted. The<br />
amendments are not expected to have a significant impact on the company’s consolidated financial statements.<br />
IAS 12 Income Taxes (“IAS 12”)<br />
IAS 12 was amended in December 2010 to remove subjectivity in determining on which basis an entity measures the deferred tax relating to an<br />
asset. The amendment introduces a presumption that an entity will assess whether the carrying amount of an asset will be recovered through the sale<br />
of the asset. The amendment to IAS 12 is effective for reporting periods beginning on or after January 1, 2012. The company is currently evaluating<br />
the impact of this amendment to IAS 12 on its consolidated financial statements.<br />
IAS 19 Employee Benefits (“IAS 19”)<br />
IAS 19 was amended in June <strong>2011</strong> to change the accounting for defined benefit plans <strong>and</strong> termination benefits. The amendments require the<br />
immediate recognition of actuarial gains or losses. The amendments also m<strong>and</strong>ate additional presentation <strong>and</strong> disclosure requirements. The<br />
amendments are be applied for annual periods beginning on or after January 1, 2013 with earlier adoption permitted. The company is currently<br />
evaluating the impact of this st<strong>and</strong>ard on its consolidated financial statements.<br />
IFRS 7 Financial Instruments: Disclosures (“IFRS 7”)<br />
IFRS 7 was amended in October 2010 to provide additional disclosure on the transfer of financial assets including the possible effects of any residual<br />
risks that the transferring entity retains. These amendments are for annual periods beginning on or after July 1, <strong>2011</strong>. The company is currently<br />
evaluating the impact of these amendments to IFRS 7 on its consolidated financial statements.<br />
IFRS 9 Financial Instruments (“IFRS 9”)<br />
IFRS 9 was issued in November 2009 <strong>and</strong> is the first step to replace current IAS 39, “Financial Instruments: Recognition <strong>and</strong> Measurement”. IFRS<br />
9 uses a single approach to determine whether a financial asset is measured at amortized cost or fair value, replacing the multiple rules in IAS 39.<br />
The approach in IFRS 9 is based on how an entity manages its financial instruments in the context of its business model <strong>and</strong> the contractual cash<br />
flow characteristics of the financial assets. The new st<strong>and</strong>ard also requires a single impairment method to be used, replacing the multiple impairment<br />
methods in IAS 39. IFRS 9 is effective for annual periods beginning on or after January 1, 2015. The company is currently evaluating the impact of<br />
IFRS 9 on its consolidated financial statements.<br />
IFRS 10 Consolidated Financial Statements (“IFRS 10”)<br />
IFRS 10 establishes principles for the presentation <strong>and</strong> preparation of consolidated financial statements when an entity controls one or more other<br />
entities. IFRS 10 supersedes IAS 27 “Consolidated <strong>and</strong> Separate Financial Statements” <strong>and</strong> SIC–12 “Consolidation—Special Purpose Entities” <strong>and</strong> is<br />
effective for annual periods beginning on or after January 1, 2013. Earlier application is permitted. The company is currently evaluating the impact of<br />
this st<strong>and</strong>ard on its consolidated financial statements.<br />
IFRS 11 Joint Arrangements (“IFRS 11”)<br />
IFRS 11 establishes principles for financial reporting by parties to a joint arrangement. IFRS 11 supersedes current IAS 31 “Interests in Joint Ventures<br />
<strong>and</strong> SIC–13 Jointly Controlled Entities—Non–Monetary Contributions by Venturers” <strong>and</strong> is effective for annual periods beginning on or after January 1,<br />
2013. Earlier application is permitted. The company is currently evaluating the impact of this st<strong>and</strong>ard on its consolidated financial statements.<br />
IFRS 12 Disclosure of Interests in Other Entities (“IFRS 12”)<br />
IFRS 12 applies to entities that have an interest in a subsidiary, a joint arrangement, an associate or an unconsolidated structured entity. IFRS 12 is<br />
effective for annual periods beginning on or after January 1, 2013. Earlier application is permitted. The company is currently evaluating the impact of<br />
this st<strong>and</strong>ard on its consolidated financial statements.<br />
IAS 28 Investments in Associates <strong>and</strong> Joint Ventures (“IAS 28”)<br />
IAS 28 was amended in <strong>2011</strong> <strong>and</strong> prescribes the accounting for investments in associates <strong>and</strong> sets out the requirements for the application of the equity<br />
method when accounting for investments in associates <strong>and</strong> joint ventures. IAS 28 is effective for annual periods beginning on or after January 1, 2013.<br />
Earlier application is permitted. The company is currently evaluating the impact of this amendment to IAS 28 on its consolidated financial statements.<br />
IFRS 13 Fair Value Measurements (“IFRS 13”)<br />
IFRS 13 defines fair value, sets out in a single IFRS framework for measuring fair value <strong>and</strong> requires disclosures about fair value measurements. IFRS<br />
13 is to be applied for annual periods beginning on or after January 1, 2013. Earlier application is permitted. The company is currently evaluating the<br />
impact of this st<strong>and</strong>ard on its consolidated financial statements.
AR <strong>2011</strong><br />
PG 58<br />
Financial Instruments - Presentation (“IAS 32”)<br />
In December <strong>2011</strong>, certain amendments to IAS 32 were issued which address inconsistencies when applying the offsetting criteria outlined in this<br />
st<strong>and</strong>ard. These amendments clarify certain of the criteria required to be met in order to permit the offsetting of financial assets <strong>and</strong> financial liabilities.<br />
These amendments are required to be adopted retrospectively for periods beginning January 1, 2014. The company is currently evaluating the impact<br />
of this st<strong>and</strong>ard on its consolidated financial statements.<br />
4. SEGMENT <strong>REPORT</strong>ING<br />
Management has segmented the company’s business based on differences in products <strong>and</strong> services <strong>and</strong> management responsibility. The company’s<br />
business is conducted predominantly through two major operating segments – upstream in Canada <strong>and</strong> downstream in USA, through a wholly–owned<br />
subsidiary, Montana Refining Company, Inc. (‘‘MRCI’’). Upstream includes exploration for <strong>and</strong> the development <strong>and</strong> production of bitumen, crude oil <strong>and</strong><br />
natural gas. Downstream includes refining of primarily crude oil to produce <strong>and</strong> market gasoline, jet fuel, diesel fuels, asphalt <strong>and</strong> ancillary products.<br />
4.1 Segment revenue <strong>and</strong> results<br />
Performance is measured based on segment operating income. This measure excludes interest <strong>and</strong> other income, gain (loss) on disposition of assets,<br />
unrealized gain (loss) on risk management contracts, share-based compensation, employee benefit plan expense, finance charges, foreign exchange<br />
gain (loss), depletion, depreciation, amortization <strong>and</strong> impairment, share of interest in <strong>and</strong> loss on disposition of associate, exploration <strong>and</strong> evaluation<br />
expenses <strong>and</strong> costs of refinancing long–term debt.<br />
The accounting policies of the segments are the same as the company’s accounting policies provided in note 3. Transfer prices between operating<br />
segments are on an arm’s length basis in a manner similar to transactions with third parties.<br />
Information regarding revenue <strong>and</strong> results of each reportable segment is presented below followed by the reconciliations:<br />
Revenue, net of royalties<br />
For the year ended December 31 <strong>2011</strong> 2010<br />
(Canadian dollar in thous<strong>and</strong>s)<br />
Segment<br />
revenue<br />
Segment<br />
revenue<br />
Inter–<br />
segment<br />
revenue<br />
Revenue<br />
from<br />
external<br />
customers<br />
Inter–<br />
segment<br />
revenue<br />
Revenue<br />
from<br />
external<br />
customers<br />
Upstream – Canada $ 446,904 $ – $ 446,904 $ 270,033 $ – $ 270,033<br />
Downstream – USA 441,143 (15,241) 425,902 334,165 (14,267) 319,898<br />
Total $ 888,047 $ (15,241) $ 872,806 $ 604,198 $ (14,267) $ 589,931<br />
Results<br />
For the year ended December 31 <strong>2011</strong> 2010<br />
(Canadian dollar in thous<strong>and</strong>s)<br />
Upstream Downstream Total Upstream Downstream Total<br />
Canada<br />
USA<br />
Canada<br />
USA<br />
Segment operating income $ 90,180 $ 39,691 $ 129,871 $ 68,183 $ 24,023 $ 92,206<br />
Depletion, depreciation, amortization <strong>and</strong> impairment $ 110,872 $ 9,278 $ 120,150 $ 67,042 $ 10,470 $ 77,512<br />
In <strong>2011</strong> <strong>and</strong> 2010, the company recorded an impairment charge of $24.7 million <strong>and</strong> $4.5 million, respectively, within the upstream segment.<br />
See note 10 for more details.<br />
Reconciliation of depletion, depreciation, amortization <strong>and</strong> impairment<br />
For the year ended December 31<br />
<strong>2011</strong> 2010<br />
(Canadian dollar in thous<strong>and</strong>s)<br />
Segment depletion, depreciation, amortization <strong>and</strong> impairment $ 120,150 $ 77,512<br />
Corporate depreciation 1,859 2,330<br />
Consolidated depletion, depreciation, amortization <strong>and</strong> impairment $ 122,009 $ 79,842
AR <strong>2011</strong><br />
PG 59<br />
Reconciliation of segment operating income to net loss before taxes<br />
For the year ended December 31<br />
<strong>2011</strong> 2010<br />
(Canadian dollar in thous<strong>and</strong>s)<br />
Upstream segment operating income $ 90,180 $ 68,183<br />
Downstream segment operating income 39,691 24,023<br />
Interest <strong>and</strong> other income 979 256<br />
Gain (loss) on disposition of assets 43,457 (811)<br />
Unrealized gain (loss) on risk management contracts 11,252 (14,343)<br />
Employee benefit plan expense (708) (426)<br />
Stock–based compensation (3,453) (5,019)<br />
Finance charges (95,588) (69,445)<br />
Foreign exchange (loss) gain (8,909) 41,641<br />
Depletion, depreciation, amortization <strong>and</strong> impairment (122,009) (79,842)<br />
Share of interest in <strong>and</strong> loss on disposition of associate (6,840) (16,016)<br />
Exploration <strong>and</strong> evaluation expenses (210) (964)<br />
Refinancing of long–term debt (61,971) –<br />
Net loss before taxes $ (114,129) $ (52,763)<br />
4.2 Capital expenditures<br />
For the year ended December 31<br />
<strong>2011</strong> 2010<br />
(Canadian dollar in thous<strong>and</strong>s)<br />
Upstream – Canada $ 136,520 $ 189,612<br />
Downstream – USA 18,653 8,575<br />
Corporate – Canada 1,454 2,128<br />
Capital expenditures – total $ 156,627 $ 200,315<br />
4.3 Entity–wide disclosures<br />
Information about products<br />
The following provides the information relating to the company’s external revenue from its major products:<br />
For the year ended December 31<br />
<strong>2011</strong> 2010<br />
(Canadian dollar in thous<strong>and</strong>s)<br />
Diluted bitumen $ 430,027 $ 241,747<br />
Crude oil 10,372 15,516<br />
Natural gas 6,505 12,770<br />
<strong>Gas</strong>oline 175,066 138,252<br />
Asphalt 125,287 93,980<br />
Diesel <strong>and</strong> jet fuel 118,136 83,885<br />
Other refined products 7,413 3,781<br />
Total revenue from external customers $ 872,806 $ 589,931<br />
Information about geographical areas<br />
The company operates in two principal geographical areas (Canada <strong>and</strong> USA). The information regarding revenue from external customers of these<br />
locations is presented above. The following table provides information regarding non–current assets (excluding asset classified as held for sale $nil<br />
(2010 : $88.2 million) relating to these locations:<br />
As at December 31<br />
<strong>2011</strong> 2010<br />
(Canadian dollar in thous<strong>and</strong>s)<br />
Canada $ 1,260,073 $ 1,248,016<br />
USA 92,666 81,216<br />
Total $ 1,352,739 $ 1,329,232<br />
Information about major customers<br />
Revenue from one customer of the company’s upstream segment represents approximately $201.4 million of the company’s total revenue in <strong>2011</strong>.<br />
Revenue from two customers of the company’s upstream segment represents approximately $157.8 million <strong>and</strong> $72.3 million of the company’s total<br />
revenue in 2010.
AR <strong>2011</strong><br />
PG 60<br />
5. Trade <strong>and</strong> ACCRUED RECEIVABLES<br />
As at<br />
December 31, <strong>2011</strong> December 31, 2010 January 1, 2010<br />
(Canadian dollar in thous<strong>and</strong>s)<br />
Trade receivables $ 16,257 $ 16,904 $ 14,295<br />
Accrued revenue 45,848 39,942 16,358<br />
Other receivables 894 527 12,385<br />
Due from associate – 46 29<br />
$ 62,999 $ 57,419 $ 43,067<br />
6. INVENTORIES<br />
As at<br />
December 31, <strong>2011</strong> December 31, 2010 January 1, 2010<br />
(Canadian dollar in thous<strong>and</strong>s)<br />
Diluted bitumen <strong>and</strong> diluents $ 9,201 $ 4,106 $ -<br />
Finished products 31,536 38,056 18,185<br />
Input materials:<br />
Crude oil, feedstocks <strong>and</strong> unfinished products 9,891 8,327 13,456<br />
Chemicals <strong>and</strong> supplies 9,518 6,655 5,230<br />
$ 60,146 $ 57,144 $ 36,871<br />
The cost of inventories recognized as an expense during <strong>2011</strong> was $719.4 million (2010: $510.2 million).<br />
As a result of improved commodity prices, the company reversed the previous write–down totaling $1.4 million in 2010. These reversals are included<br />
in “blending <strong>and</strong> costs of products sold”. There were no material write–downs or reversal of write–downs in <strong>2011</strong>.<br />
7. OTHER Assets<br />
As at<br />
December 31, <strong>2011</strong> December 31, 2010 January 1, 2010<br />
(Canadian dollar in thous<strong>and</strong>s)<br />
Prepayments <strong>and</strong> others $ 11,899 $ 5,585 $ 4,080<br />
Deposits 321 10,948 10,355<br />
Unamortized transaction costs relating to the Facility 1,153 939 1,440<br />
Income taxes refundable – 796 2,607<br />
Share purchase warrants (note 8.2) – – 2,711<br />
Total 13,373 18,268 21,193<br />
Less: non–current portion (676) (615) (3,419)<br />
Current portion $ 12,697 $ 17,653 $ 17,774<br />
8. Assets, LIABILITIES <strong>and</strong> Equity Classified as HELD For Sale<br />
The major classes of assets <strong>and</strong> liabilities classified as held for sale are as follows:<br />
As at December 31<br />
Notes <strong>2011</strong> 2010<br />
(Canadian dollar in thous<strong>and</strong>s)<br />
Assets classified as held for sale<br />
Property, plant <strong>and</strong> equipment 8.1 $ – $ 54,348<br />
Exploration <strong>and</strong> evaluation assets 8.1 – 5,652<br />
Investment in associate 8.2 – 27,683<br />
Investment in share purchase warrants 8.2 – 474<br />
Assets classified as held for sale $ – $ 88,157<br />
Liabilities associated with assets classified as held for sale<br />
Decommissioning liabilities 8.1 $ – $ 10,907<br />
Equity associated with assets classified as held for sale<br />
Accumulated other comprehensive loss 8.2 $ – $ 4,492
AR <strong>2011</strong><br />
PG 61<br />
8.1 Petroleum <strong>and</strong> natural gas properties<br />
As a part of the company’s program to rationalize its conventional petroleum <strong>and</strong> natural gas properties, on November 15, 2010, the company’s<br />
management committed to a plan to sell its conventional petroleum <strong>and</strong> natural gas properties located in Northern Alberta <strong>and</strong> Southwest<br />
Saskatchewan. Accordingly, the carrying amount of the assets <strong>and</strong> liabilities relating to these properties was classified as held for sale on December<br />
31, 2010. The sale of these properties was completed in <strong>2011</strong> for the net proceeds of $78.3 million resulting in a gain of $28.4 million.<br />
Assets classified as held for sale are not depleted, depreciated or amortized.<br />
8.2 Investment in associate<br />
The following table shows the changes in the balance of investment in associate:<br />
For the year ended December 31<br />
<strong>2011</strong> 2010<br />
(Canadian dollar in thous<strong>and</strong>s)<br />
Balance, beginning of year $ – $ 48,240<br />
Effects of transactions recorded in net earnings (loss)<br />
Share of loss – (1,999)<br />
Dilution loss – (3,832)<br />
Accumulated impairment – (9,763)<br />
– (15,594)<br />
Share of other comprehensive loss before tax – (4,963)<br />
Balance, end of year, classified as held for sale $ – $ 27,683<br />
As at December 31, 2010, <strong>Connacher</strong> owned 26.9 million common shares, representing 18.5 percent, of Petrolifera Petroleum Limited’s (“Petrolifera”)<br />
issued <strong>and</strong> outst<strong>and</strong>ing common shares <strong>and</strong> 6.8 million Petrolifera share purchase warrants. Petrolifera’s common shares <strong>and</strong> common share<br />
purchase warrants were listed on Toronto Stock Exchange. Petrolifera was engaged in petroleum <strong>and</strong> natural gas exploration, development <strong>and</strong><br />
production facilities in South America. The investment in common shares was recorded as an investment in associate <strong>and</strong> the investment in share<br />
purchase warrants was recorded as the derivative financial asset held for trading <strong>and</strong> recorded at fair value.<br />
In April 2010, Petrolifera closed a public offering of 23,678,500 common shares at a price of $0.85 per common share for gross proceeds of<br />
$20.1 million (the “Offering”). <strong>Connacher</strong> did not subscribe for shares in the Offering <strong>and</strong> accordingly, <strong>Connacher</strong>’s equity interest in Petrolifera<br />
was reduced to 18.5 percent from 22 percent. The reduction in the ownership interest resulted in a dilution loss of $3.8 million in the year ended<br />
December 31, 2010. In addition, $422,000 was transferred from other comprehensive loss to net earnings (loss) representing share of other<br />
comprehensive loss of Petrolifera.<br />
The assets relating to the associate were classified as an asset held for sale on December 31, 2010, following management’s commitment to support<br />
the sale of all of the issued <strong>and</strong> outst<strong>and</strong>ing common shares of Petrolifera to Gran Tierra Energy Inc. (“Gran Tierra Energy”). Gran Tierra Energy<br />
entered into a Plan of Arrangement (the “Arrangement”) with Petrolifera on January 17, <strong>2011</strong>, pursuant to which Gran Tierra Energy acquired all of the<br />
issued <strong>and</strong> outst<strong>and</strong>ing common shares <strong>and</strong> common share purchase warrants of Petrolifera.<br />
Equity accounting ceased on December 31, 2010 upon reclassification as an asset held for sale. An impairment loss of $9.8 million on the<br />
remeasurement of the investment in Petrolifera to the lower of its carrying amount <strong>and</strong> its fair value less costs to sell was recognized in 2010.<br />
Upon the completion of a share exchange under the Arrangement in March <strong>2011</strong>, the company received 3.3 million common shares <strong>and</strong> 841,000<br />
common share purchase warrants of Gran Tierra Energy (see note 21). <strong>Connacher</strong> de-recognized the investment in Petrolifera in March <strong>2011</strong> <strong>and</strong><br />
recorded a loss of $6.8 million, including a $4.5 million transfer from other comprehensive income (loss).<br />
In consideration for the assistance provided by the company in 2005 to Petrolifera in securing two Peruvian licenses for exploratory l<strong>and</strong>s <strong>and</strong> for<br />
the provision of financial guarantees respecting Petrolifera’s annual work commitments on the two licensed blocks, <strong>Connacher</strong> was awarded a 10<br />
percent carried working interest (“CWI”) through the drilling of the first well on each block. Petrolifera had the right of first purchase of this CWI should<br />
<strong>Connacher</strong> elect to sell it at some future date. The CWI is convertible at <strong>Connacher</strong>’s election into a two percent gross overriding royalty on each<br />
license, after the drilling of the first well on each block. In <strong>2011</strong>, <strong>Connacher</strong> was fully released from the provision of financial guarantees. Also, in<br />
<strong>2011</strong>, Petrolifera relinquished its interest in one of the two Peruvian licenses. The company continues to own the CWI relating to the remaining license<br />
<strong>and</strong> related rights after the completion of the transaction under the Arrangement.
AR <strong>2011</strong><br />
PG 62<br />
9. EXPLORATION <strong>and</strong> Evaluation assets (“E&E”)<br />
(Canadian dollar in thous<strong>and</strong>s)<br />
Upstream Segment – Canada<br />
Cost<br />
Balance, January 1, 2010 $ 96,162<br />
Additions 25,220<br />
Disposition (172)<br />
Transferred to assets classified as held for sale (note 8.1) (8,688)<br />
Balance, December 31, 2010 112,522<br />
Additions 22,399<br />
Disposition (13,107)<br />
Balance, December 31, <strong>2011</strong> $ 121,814<br />
Accumulated amortization <strong>and</strong> impairment<br />
Balance, January 1, 2010 $ –<br />
Charge for the year 4,609<br />
Transferred to assets classified as held for sale (note 8.1) (3,036)<br />
Balance, December 31, 2010 1,573<br />
Charge for the year 3,637<br />
Disposition (825)<br />
Balance, December 31, <strong>2011</strong> $ 4,385<br />
Carrying amount<br />
As at January 1, 2010 $ 96,162<br />
As at December 31, 2010 $ 110,949<br />
As at December 31, <strong>2011</strong> $ 117,429<br />
E&E assets include unproved l<strong>and</strong> <strong>and</strong> the company’s oil s<strong>and</strong>s projects which are pending the determination of technical feasibility <strong>and</strong><br />
commercial viability.<br />
In <strong>2011</strong>, the company sold certain unproved properties relating to its oil s<strong>and</strong>s <strong>and</strong> conventional operations for the net proceeds of $29.3 million <strong>and</strong><br />
recorded a gain of $17.4 million.<br />
All of the company’s E&E assets are collateralized to secure long–term debt. See note 13.
AR <strong>2011</strong><br />
PG 63<br />
10. PROPERTY, Plant <strong>and</strong> Equipment<br />
(Canadian dollar in thous<strong>and</strong>s)<br />
Petroleum <strong>and</strong> natural<br />
gas properties (Upstream)<br />
Refining (Downstream) Corporate Total<br />
Cost<br />
Balance, January 1, 2010 $ 1,029,396 $ 105,789 $ 12,272 $ 1,147,457<br />
Additions 207,219 8,575 2,128 217,922<br />
Dispositions (4,036) – – (4,036)<br />
Change in decommissioning liabilities (note 14) 16,023 – – 16,023<br />
Foreign currency translation changes – (5,887) – (5,887)<br />
Transferred to assets classified as held for sale<br />
(59,679) – – (59,679)<br />
(note 8.1)<br />
Balance, December 31, 2010 1,188,923 108,477 14,400 1,311,800<br />
Additions 115,946 18,653 1,454 136,053<br />
Change in decommissioning liabilities (note 14) 4,976 – – 4,976<br />
Dispositions (8,986) – – (8,986)<br />
Foreign currency translation changes – 2,932 – 2,932<br />
Balance, December 31, <strong>2011</strong> $ 1,300,859 $ 130,062 $ 15,854 $ 1,446,775<br />
Accumulated depletion, depreciation <strong>and</strong> impairment<br />
Balance, January 1, 2010 $ – $ 18,075 $ 5,468 $ 23,543<br />
Depletion <strong>and</strong> depreciation 61,604 10,470 2,330 74,404<br />
Impairment charge 4,476 – – 4,476<br />
Dispositions (1,676) – – (1,676)<br />
Foreign currency translation changes – (1,284) – (1,284)<br />
Transferred to assets classified as held for sale<br />
(5,331) – – (5,331)<br />
(note 8.1)<br />
Balance, December 31, 2010 59,073 27,261 7,798 94,132<br />
Depletion <strong>and</strong> depreciation 82,905 9,278 1,859 94,042<br />
Impairment charge 24,700 – – 24,700<br />
Dispositions (1,590) – – (1,590)<br />
Foreign currency translation changes – 857 – 857<br />
Balance, December 31, <strong>2011</strong> $ 165,088 $ 37,396 $ 9,657 $ 212,141<br />
Carrying amount<br />
At January 1, 2010 $ 1,029,396 $ 87,714 $ 6,804 $ 1,123,914<br />
At December 31, 2010 $ 1,129,850 $ 81,216 $ 6,602 $ 1,217,668<br />
At December 31, <strong>2011</strong> $ 1,135,771 $ 92,666 $ 6,197 $ 1,234,634<br />
In May <strong>2011</strong>, the company acquired certain petroleum <strong>and</strong> natural gas properties for cash consideration of $9.7 million. The acquisition resulted in the<br />
allocation of $11.9 million to upstream property, plant <strong>and</strong> equipment <strong>and</strong> $2.2 million to decommissioning liabilities.<br />
In <strong>2011</strong>, the company sold certain petroleum <strong>and</strong> natural gas properties relating to its conventional operations for the net proceeds of $9.7 million<br />
<strong>and</strong> recorded a gain of $2.3 million.<br />
Due to the reduction of reserves relating to its conventional petroleum <strong>and</strong> natural gas properties, the company performed an impairment test of<br />
its Central Alberta CGU (part of upstream segment) as at December 31, <strong>2011</strong> <strong>and</strong> recognized an impairment charge of $24.7 million (included<br />
in depletion, depreciation, amortization <strong>and</strong> impairment) based on the difference between the carrying amount <strong>and</strong> the recoverable amount. The<br />
recoverable amount was determined using the value in use calculated using a 10% discounted cash flows.<br />
Due to a substantial decrease in natural gas prices, the company performed an impairment test of its Northwest Alberta CGU (part of upstream<br />
segment) as at December 31, 2010 <strong>and</strong> recognized an impairment charge of $4.5 million based on the difference between the carrying amount <strong>and</strong><br />
the recoverable amount. The recoverable amount was determined using the fair value less costs to sell which was derived from the sale price agreed<br />
under the binding sale agreement with the third party.<br />
The net carrying amount at December 31, <strong>2011</strong>, includes $21.2 million (2010: $8.6 million) of Refining (Downstream) assets in the course of<br />
construction <strong>and</strong> not subject to depreciation.<br />
Property, plant <strong>and</strong> equipment with a carrying cost of $1,223 million (2010: $1,205 million) is collateralized to secure long–term debt. See note 13.
AR <strong>2011</strong><br />
PG 64<br />
11. Trade <strong>and</strong> ACCRUED PAYABLES<br />
As at<br />
December 31, <strong>2011</strong> December 31, 2010 January 1, 2010<br />
(Canadian dollar in thous<strong>and</strong>s)<br />
Trade payables $ 19,509 $ 10,973 $ 14,355<br />
Accrued interest payable 32,587 13,280 15,946<br />
Other accrued liabilities 70,093 54,514 70,303<br />
Other payables 2,967 2,284 4,200<br />
Taxes payable 1,211 319 –<br />
$ 126,367 $ 81,370 $ 104,804<br />
12. FINANCIAL INSTRUMENTS<br />
The company’s financial instruments include its cash, trade <strong>and</strong> accrued receivables, risk management contracts, trade <strong>and</strong> accrued payables <strong>and</strong><br />
long–term debt. Information relating to these financial instruments including fair values is provided below.<br />
12.1 Fair value measurements for financial instruments<br />
Fair value estimates are made at a specific point in time, based on relevant market information <strong>and</strong> information about the financial instrument. These<br />
estimates cannot be determined with precision as they are subjective in nature <strong>and</strong> involve uncertainties <strong>and</strong> matters of judgment.<br />
The following table shows the comparison of the carrying <strong>and</strong> fair values of the company’s financial instruments:<br />
December 31, <strong>2011</strong> December 31, 2010 January 1, 2010<br />
(Canadian dollar in thous<strong>and</strong>s)<br />
Carrying Fair Value Carrying Fair Value Carrying Fair Value<br />
Amount<br />
Amount<br />
Amount<br />
Loans <strong>and</strong> receivables<br />
Cash (1) $ 117,045 $ 117,045 $ 19,532 $ 19,532 $ 256,787 $ 256,787<br />
Trade <strong>and</strong> accrued receivables (1) 62,999 62,999 57,419 57,419 43,067 43,067<br />
Fair value through profit <strong>and</strong> loss (“FVTPL”)<br />
Derivative financial assets (2) – – 474 474 2,711 2,711<br />
Risk management contracts liabilities (3) 7,610 7,610 18,863 18,863 4,520 4,520<br />
Convertible debentures (2) 98,564 98,564 96,548 96,548 92,046 92,046<br />
Other liabilities<br />
Trade <strong>and</strong> accrued payables (1) 126,367 126,367 81,370 81,370 104,804 104,804<br />
Long–term debt excluding convertible debentures (4) $ 859,538 $ 830,443 $ 750,839 $ 803,872 $ 787,693 $ 800,000<br />
(1) The fair values of cash, trade <strong>and</strong> accrued receivables <strong>and</strong> trade <strong>and</strong> accrued payables approximate their carrying amounts due to the short–term maturity of those instruments.<br />
(2) The fair values of the derivative financial assets <strong>and</strong> convertible debentures are based on quoted market prices, a Level 1 measurement.<br />
(3) The fair values of the risk management contracts liabilities were derived from observable market prices or indices, a Level 2 measurement.<br />
(4) The fair values of long–term debt excluding convertible debentures have been determined based on market information.<br />
12.2 Risk exposures<br />
The company is exposed to market risks related to the volatility of commodity prices, foreign exchange rates <strong>and</strong> interest rates. In certain instances,<br />
the company uses derivative instruments to manage the company’s exposure to these risks. The company is also exposed to credit risk on accounts<br />
receivable, to counterparties to risk management contracts <strong>and</strong> to liquidity risk relating to debt <strong>and</strong> the fulfillment of its financial obligations. The<br />
company employs risk management strategies <strong>and</strong> policies to ensure that any exposures to risk are in compliance with the company’s business<br />
objectives <strong>and</strong> risk tolerance levels. Risk management is ultimately established by the company’s Board of Directors <strong>and</strong> is implemented <strong>and</strong><br />
monitored by senior management of the company.<br />
Credit risk<br />
Credit risk is the risk that the contracting entity will not fulfill its obligations under a contract when they are due. The company generally extends<br />
unsecured credit to customers <strong>and</strong> therefore, the collection of accounts receivable may be affected by changes in economic or other conditions.<br />
Management believes this risk is mitigated by the size <strong>and</strong> creditworthiness of the companies to which credit has been extended. The company has<br />
not historically experienced any material credit loss in the collection of accounts receivable.
AR <strong>2011</strong><br />
PG 65<br />
Accounts receivable are due primarily from crude oil <strong>and</strong> natural gas purchasers in the petroleum <strong>and</strong> natural gas industry <strong>and</strong> Government <strong>and</strong><br />
large wholesale <strong>and</strong> retail purchasers of refined products. Accounts receivable are subject to normal industry credit risks. The company periodically<br />
assesses the financial strength of its purchasers <strong>and</strong> will adjust its marketing plan to mitigate credit risks. This assessment involves a review of<br />
external credit ratings <strong>and</strong> an internal credit review, based on the purchaser’s past financial performance. The company considers all amounts due over<br />
90 days as past due. As at December 31, <strong>2011</strong>, approximately $1.5 million (2010 : $1.1 million) of accounts receivable were past due primarily from<br />
taxation authorities, all of which were considered to be collectible.<br />
The company is also exposed to credit risk from counterparties to risk management contracts. This risk is managed by limiting counterparties to<br />
investment grade banking institutions; there has been no history of impairment with these counterparties.<br />
The maximum exposure to credit risk relating to the above classes of financial assets at December 31, <strong>2011</strong> <strong>and</strong> 2010 is the carrying amount of<br />
these assets.<br />
Liquidity risk<br />
Liquidity risk is the risk that the company will not have sufficient funds to repay its debts <strong>and</strong> fulfill its financial obligations. To manage this risk,<br />
the company pre–funds major development projects, monitors expenditures against pre–approved budgets to control costs, regularly monitors its<br />
operating cash flow, working capital <strong>and</strong> bank balances against its business plan, maintains accessible revolving banking lines of credit <strong>and</strong> maintains<br />
prudent insurance programs to minimize exposure to insurable losses. Additionally, the long term nature of the company’s debt repayment obligations<br />
is aligned to the long term nature of its assets. Principal repayments are not required on the Second Lien Senior Notes until their maturity in 2018 <strong>and</strong><br />
2019. The company also has a revolving credit facility of $100 million (note 13.4), which gives <strong>Connacher</strong> additional short–term financial flexibility for<br />
its working capital requirements. The following table shows the maturities of <strong>Connacher</strong>’s financial liabilities:<br />
As at December 31, <strong>2011</strong><br />
Total Within 1 year 2–5 years 6–7 years<br />
(Canadian dollar in thous<strong>and</strong>s)<br />
Non–derivative liabilities:<br />
Accounts payable <strong>and</strong> accrued liabilities $ 126,367 $ 126,367 $ – $ –<br />
Long–term debt <strong>and</strong> interest payment obligations (1) 1,556,982 180,559 312,679 1,063,744<br />
Derivative–based liabilities:<br />
Risk management contracts $ 7,610 $ 7,610 $ – $ –<br />
(1) USD denominated principal <strong>and</strong> interested payments are converted into Canadian dollars using exchange rate prevailing on December 31, <strong>2011</strong>.<br />
Market risk <strong>and</strong> sensitivity analysis<br />
Market risk is the risk that the fair value or future cash flows of a financial instrument will fluctuate because of changes in market prices. The objective<br />
of market risk management is to manage <strong>and</strong> control market price exposures within acceptable limits, while maximizing returns. Market risk is<br />
comprised of commodity price risk, interest rate risk <strong>and</strong> foreign currency risk.<br />
Commodity price risk<br />
The company is exposed to commodity price risk as a result of potential changes in the market prices of its bitumen <strong>and</strong> refined product sales <strong>and</strong><br />
its crude oil <strong>and</strong> natural gas sales <strong>and</strong> purchases. In accordance with policies approved by the Board of Directors, derivative contracts, including<br />
commodity futures contracts, price swaps <strong>and</strong> collars may be utilized to reduce exposure to price fluctuations associated with a portion of these sales<br />
or purchases. The following table summarizes the net position of the company’s risk management contracts:<br />
As at December 31<br />
<strong>2011</strong> 2010<br />
(Canadian dollar in thous<strong>and</strong>s)<br />
Current liabilities (assets)<br />
Crude oil contracts $ 11,001 $ 8,241<br />
Refined products contracts (5,593) –<br />
Natural gas contracts 2,202 743<br />
Current liabilities 7,610 8,984<br />
Non–current liabilities<br />
Crude oil contracts – 9,879<br />
Non–current liabilities – 9,879<br />
Risk management contract liabilities $ 7,610 $ 18,863
AR <strong>2011</strong><br />
PG 66<br />
The following tables summarize the details of the risk management contract positions:<br />
December 31, <strong>2011</strong> – Crude oil contracts<br />
Volume (bbl/d) Term Type Price<br />
(WTI U.S.$/bbl)<br />
Liability (Asset) as at<br />
December 31, <strong>2011</strong><br />
(Canadian dollar<br />
in thous<strong>and</strong>s)<br />
2,000 Jan 1, 2012 – Dec 31, 2012 Swap $ 90.60 6,084<br />
2,000 Apr 1, <strong>2011</strong> – Mar 31, 2012 Call option $ 96.00 1,140<br />
2,000 Apr 1, <strong>2011</strong> – Mar 31, 2012 Put option $ 80.00 (97)<br />
2,000 Jul 1, <strong>2011</strong> – Jun 30, 2012 Call option $ 100.00 2,220<br />
2,000 Jul 1, <strong>2011</strong> – Jun 30, 2012 Put option $ 80.00 (556)<br />
2,000 Jan 1, 2012 – Dec 31, 2012 Call option $ 120.00 1,908<br />
2,000 Jan 1, 2012 – Dec 31, 2012 Put option $ 80.00 (2,425)<br />
1,000 Jul 1, 2012 – Dec 31, 2012 Call option $ 98.00 2,155<br />
1,000 Jul 1, 2012 – Dec 31, 2012 Put option $ 80.00 (893)<br />
1,000 Jul 1, 2012 – Dec 31, 2012 Swap $ 90.50 1,465<br />
Balance, as at December 31, <strong>2011</strong> 11,001<br />
December 31, <strong>2011</strong> – Refined products contracts<br />
Volume (bbl/d) Term Type Price (Asset) as at December<br />
31, <strong>2011</strong><br />
(Canadian dollar<br />
in thous<strong>and</strong>s)<br />
1,000 bbl/d Jan 1, 2012 – Mar 31, 2012 <strong>Gas</strong>oline Swap Floating price (1) + U.S. $27.50 $ (1,240)<br />
1,000 bbl/d Jan 1, 2012 – Dec 31, 2012 Diesel Swap Floating price (1) + U.S. $32.25 (3,837)<br />
1,000 bbl/d Apr 1, <strong>2011</strong> – Jun 30, 2012 <strong>Gas</strong>oline Swap Floating price (1) + U.S. $21.25 (516)<br />
Balance, as at December 31, <strong>2011</strong> $ (5,593)<br />
(1) For the calculation period, the company receives floating price which is an average WTI per barrel plus specified margin <strong>and</strong> pays average Nymex RBOB per gallon for gasoline or Platts-US Market Scan Gulf<br />
Coast per gallon for diesel.<br />
December 31, <strong>2011</strong> – Natural gas contracts<br />
Volume (GJ/d) Term Type Price<br />
(AECO CAD$/GJ)<br />
Liability (Asset) as at<br />
December 31, <strong>2011</strong><br />
(Canadian dollar<br />
in thous<strong>and</strong>s)<br />
5,000 Jan 1, 2012 – Dec 31 2012 Call option $ 4.30 $ (50)<br />
5,000 Jan 1, 2012 – Dec 31 2012 Put option $ 3.70 1,801<br />
5,000 Jan 1, 2012 – Dec 31 2012 Call option $ 4.00 (74)<br />
5,000 Jan 1, 2012 – Dec 31 2012 Put option $ 2.80 525<br />
Balance, as at December 31, <strong>2011</strong> $ 2,202<br />
Subsequent to December 31, <strong>2011</strong>, the company entered into the following additional risk management contracts:<br />
• Crude oil collar – Jan 1, 2013 – Dec 31, 2013 – 300 bbl/d at a minimum of WTI $90/bbl <strong>and</strong> a maximum of WTI $118.30/bbl;<br />
• Crude oil collar – Jan 1, 2013 – Dec 31, 2013 – 1,000 bbl/d at a minimum of WTI $90/bbl <strong>and</strong> a maximum of WTI $117.80/bbl;<br />
• Crude oil collar – Jul 1, 2012 – Sept 30, 2012 – 1,000 bbl/d at a minimum of WTI $100/bbl <strong>and</strong> a maximum of WTI $118/bbl;<br />
• Crude oil collar – Oct 1, 2012 – Dec 31, 2012 – 1,000 bbl/d at a minimum of WTI $100/bbl <strong>and</strong> a maximum of WTI $116.50/bbl;<br />
• Crude oil swap – April 1, 2012 – June 30, 2012 – 1,000 bbl/d at C$109.40/bbl;<br />
• <strong>Gas</strong>oline swap – April 1, 2012 – June 30, 2012 – 815 bbl/d at WTI per barrel plus US$23.00/bbl;<br />
• Natural gas collar – Mar 1, 2012 – Jun 30, 2012 – 2,500 GJ/d at a minimum of AECO $1.85/GJ <strong>and</strong> a maximum of AECO $2.90/GJ; <strong>and</strong><br />
• Natural gas collar – Jul 1, 2012 – Oct 30, 2012 – 2,500 GJ/d at a minimum of AECO $1.85/GJ <strong>and</strong> a maximum of AECO $3.20/GJ.
AR <strong>2011</strong><br />
PG 67<br />
December 31, 2010 – Crude oil contracts<br />
Volume (bbl/d) Term Type Price<br />
(WTI U.S.$/bbl)<br />
Liability (Asset) as at<br />
December 31, 2010<br />
(Canadian dollar<br />
in thous<strong>and</strong>s)<br />
1,000 Jan 1, <strong>2011</strong> – Mar 31, <strong>2011</strong> Swap $ 86.10 $ 561<br />
1,000 Jan 1, <strong>2011</strong> – Mar 31, <strong>2011</strong> Swap $ 88.10 382<br />
2,000 Apr 1, <strong>2011</strong> – Jun 30, <strong>2011</strong> Swap $ 85.25 1,552<br />
2,000 Jan 1, <strong>2011</strong> – Dec 31, <strong>2011</strong> Swap (1) $ 90.60 10,392<br />
2,000 Jan 1, <strong>2011</strong> – Mar 31, <strong>2011</strong> Call option $ 100.25 162<br />
2,000 Jan 1, <strong>2011</strong> – Mar 31, <strong>2011</strong> Put option $ 80.00 (82)<br />
2,000 Apr 1, <strong>2011</strong> – Mar 31, 2012 Call option $ 96.00 5,918<br />
2,000 Apr 1, <strong>2011</strong> – Mar 31, 2012 Put option $ 80.00 (2,796)<br />
2,000 Jul 1, <strong>2011</strong> – Jun 30, 2012 Call option $ 100.00 5,591<br />
2,000 Jul 1, <strong>2011</strong> – Jun 30, 2012 Put option $ 80.00 (3,560)<br />
Balance, as at December 31, 2010 $ 18,120<br />
(1) On December 30, <strong>2011</strong>, the counterparty had a right to extend the maturity date of the contract for additional one year from January 1, 2012 to December 31, 2012 at US$ 90.60/bbl. The counter party<br />
exercised its right to extend the contract on December 30, <strong>2011</strong>.<br />
December 31, 2010 – Natural gas contracts<br />
Volume (GJ/d) Term Type Price<br />
(AECO CAD$/GJ)<br />
Liability as at<br />
December 31, 2010<br />
(Canadian dollar<br />
in thous<strong>and</strong>s)<br />
4,000 Sept 1, 2010 – Aug 31, <strong>2011</strong> Swap $ 3.87 $ 187<br />
4,000 Oct 1, 2010 – Sept 30, <strong>2011</strong> Swap $ 4.20 556<br />
Balance, as at December 31, 2010 $ 743<br />
The following table summarizes the amounts recorded in net earnings (loss) with respect to the risk management contracts:<br />
For the year ended December 31 <strong>2011</strong> 2010<br />
(Canadian dollar in thous<strong>and</strong>s) Upstream Downstream Total Upstream Downstream Total<br />
Unrealized (gain) loss $ (5,659) $ (5,593) $ (11,252) $ 14,343 $ – $ 14,343<br />
Realized (gain) loss 10,161 (1,036) 9,125 2,300 543 2,843<br />
(Gain) loss on risk management contracts $ 4,502 $ (6,629) $ (2,127) $ 16,643 $ 543 $ 17,186<br />
As at December 31, <strong>2011</strong>, had the forward price for WTI been U.S. $1/bbl higher or lower, the impact relating to the crude oil <strong>and</strong> refined products<br />
risk management contracts would have been to increase or decrease, respectively, net loss before income taxes by $1.9 million.<br />
As at December 31, <strong>2011</strong>, had the forward price for AECO been CAD $0.10/GJ higher or lower, the impact relating to the natural gas risk<br />
management contracts would have been to decrease or increase, respectively, net loss before income taxes by $275,000.<br />
Interest rate risk<br />
Interest rate risk refers to the risk that the future cash flows of a financial instrument will fluctuate because of changes in market interest rates. The<br />
company’s Second Lien Senior Notes <strong>and</strong> Convertible Debentures have fixed interest rate obligations <strong>and</strong>, therefore, are not subject to changes<br />
in interest rates. The Revolving Credit Facility bears floating interest rate. At December 31, <strong>2011</strong>, the company had no debt outst<strong>and</strong>ing under the<br />
Facility. Therefore, the potential increase or decrease in net earnings or loss for each one percent change in interest rate was nil.<br />
Currency risk<br />
Currency risk is the risk that the fair value or future cash flows of a financial instrument will fluctuate because of changes in foreign exchange rates.<br />
The company is exposed to fluctuations in foreign currency on its financial instruments primarily as a result of its U.S. dollar denominated long–term<br />
debt, crude oil sales based on U.S. dollar indices <strong>and</strong> commodity price contracts that are settled in U.S. dollars. The effect on the company’s financial<br />
instruments of a $0.01 change in the U.S. to Canadian dollar exchange rate would have resulted in a $4.7 million change in foreign exchange gain/<br />
loss at December 31, <strong>2011</strong>. The company’s downstream operations operate with a U.S. dollar functional currency, which gives rise to currency<br />
exchange rate risk on translation of MRCI’s operations. The impact is recorded in other comprehensive income/loss. The effect on the company’s<br />
financial instruments of a $0.01 change in the U.S. to Canadian dollar exchange rate would have resulted in $54,000 change in other comprehensive<br />
income (loss) at December 31, <strong>2011</strong>. The company manages these exchange rate risks by occasionally entering into fixed rate currency exchange<br />
contracts on future U.S. dollar payments <strong>and</strong> U.S. dollar sales receipts. In <strong>2011</strong>, the company entered in a fixed rate forward contract to buy US$ 5<br />
million at 1.019 on July 22, 2012 to minimize its exposure to the foreign exchange fluctuations on its interest payments due in 2012. The unrealized<br />
gain of $5,000 relating to this contract was recorded as a part of finance charges <strong>and</strong> other assets in <strong>2011</strong>. Subsequent to December 31, <strong>2011</strong>, the<br />
company entered a fixed rate forward contract to buy US$ 5 million at 1.0175 on July 20, 2012.
AR <strong>2011</strong><br />
PG 68<br />
13. Long–Term Debt<br />
As at December 31, <strong>2011</strong> December 31, 2010 January 1, 2010<br />
(Canadian dollar in thous<strong>and</strong>s)<br />
Notes<br />
Second Lien Senior Notes, due August 1, 2019<br />
13.1 $ 559,350 $ – $ –<br />
(US$550 million)<br />
Second Lien Senior Notes, due August 1, 2018<br />
13.1 350,000 – –<br />
(CAD$350 million)<br />
Second Lien Senior Notes, due December 15, 2015<br />
13.2 3,474 584,168 617,294<br />
(US$3.4 million)<br />
First Lien Senior Notes, due July 15, 2014 (US$Nil)<br />
13.2 – 198,920 210,200<br />
Senior Notes, due July 15, 2014 (US$ 100,000)<br />
Convertible Debentures, due June 30, 2012<br />
13.5 98,564 96,548 92,046<br />
(CAD$100 million)<br />
Total debt 1,011,388 879,636 919,540<br />
Unamortized discount <strong>and</strong> transaction costs (53,286) (32,249) (39,801)<br />
Current portion of long–term debt (102,034) – –<br />
Long–term debt $ 856,068 $ 847,387 $ 879,739<br />
13.1 Second Lien Senior Notes issued in <strong>2011</strong><br />
In May <strong>2011</strong>, the company issued US$550 million face value 8.5% Senior Secured Second Lien Notes due August 1, 2019 <strong>and</strong> CAD$350 million<br />
face value 8.75% Senior Secured Second Lien Notes due August 1, 2018 (the “New Notes”) at par <strong>and</strong> capitalized transaction costs of $17.6 million<br />
relating to their issuance.<br />
Interest is payable semi–annually on February 1 <strong>and</strong> August 1 each year the New Notes are outst<strong>and</strong>ing. The New Notes are secured on a second<br />
priority basis by liens on all of the company’s existing <strong>and</strong> future property, excluding certain pipeline assets in the USA.<br />
Proceeds received from the sale of collateralized assets (excluding oil <strong>and</strong> gas properties for which no reserves are assigned) are required to be<br />
re–invested in existing exploration <strong>and</strong> evaluation <strong>and</strong> petroleum <strong>and</strong> natural gas properties, to acquire new oil <strong>and</strong> gas properties or to repay the<br />
Revolving Credit Facility (note 13.4). If such proceeds are not used for these purposes within one year, the company is required to make an offer to<br />
repurchase the New Notes at par to the extent such proceeds exceed $25 million plus any re–invested <strong>and</strong> repaid amounts. Following an offer to<br />
purchase the New Notes in connection with an asset sale, the company may redeem all or part of the US–dollar denominated New Notes at 108.5<br />
percent <strong>and</strong> Canadian–dollar denominated New Notes at 108.75 percent with any remaining asset sale proceeds. As of December 31, <strong>2011</strong>, all<br />
asset sale proceeds have been re–invested in exploration <strong>and</strong> evaluation <strong>and</strong> petroleum <strong>and</strong> natural gas properties.<br />
Provisions in the indenture allow the company to redeem the New Notes as follows:<br />
• at any time prior to August 1, 2014, the company may redeem up to 35% of the US–dollar denominated New Notes at a price of 108.5 percent<br />
<strong>and</strong> up to 35% of the Canadian–dollar denominated New Notes at the price of 108.75 percent with proceeds of certain equity offerings of at least<br />
$10 million;<br />
• at any time prior to August 1, 2015, the company may redeem some or all of the New Notes at their principal amount plus a make whole premium<br />
plus applicable interest;<br />
• after August 1, 2015, the US–dollar denominated New Notes may be redeemed at redemption prices ranging from 104.25 percent, reducing to<br />
100 percent on August 1, 2017, <strong>and</strong> thereafter; <strong>and</strong><br />
• after August 1, 2015, the Canadian–dollar denominated New Notes may be redeemed at redemption prices ranging from 104.375 percent<br />
reducing to 100 percent on August 1, 2017 <strong>and</strong> thereafter.<br />
In the event of a Change of Control of the company, the holders of the New Notes have the right to require the company to purchase the New Notes<br />
at a price of not less than 101 percent of the principal amount to be repurchased.<br />
13.2 First Lien Senior Notes due 2014 <strong>and</strong> <strong>and</strong> Second Lien Senior Notes due 2015<br />
In conjunction with the completion of the issuance of the New Notes described in note 13.1, in <strong>2011</strong>, the company repurchased US$ 783.5 million of<br />
the face value of the outst<strong>and</strong>ing First Lien Senior Notes due 2014 <strong>and</strong> Second Lien Senior Notes due 2015 (the “Old Notes”) for cash consideration<br />
of US$ 854.7 million (CAD$ 835.9 million). See note 13.3 for the accounting of costs associated with this transaction.<br />
As of December 31, <strong>2011</strong>, the company has fully redeemed its First Lien Senior Notes due 2014. The remaining amount outst<strong>and</strong>ing under Second<br />
Lien Senior Notes due 2015 are classified as current liabilities as the company redeemed these Notes in January 2012 for total cash consideration<br />
of $3.6 million.
AR <strong>2011</strong><br />
PG 69<br />
13.3 Refinancing of long–term debt <strong>and</strong> realized foreign exchange gain<br />
As a result of the issuance of the New Notes <strong>and</strong> the purchase <strong>and</strong> redemption of the Old Notes in <strong>2011</strong>, the company performed an analysis<br />
to determine whether the transaction was to be accounted for as a modification or an extinguishment of debt. The company determined that this<br />
transaction resulted partially in a modification <strong>and</strong> partially as an extinguishment. Accordingly, the company recorded costs of refinancing of $36.1<br />
million as a discount on the New Notes <strong>and</strong> approximately $61.9 million was expensed. The company also realized a foreign exchange gain of $11.6<br />
million upon redemption of this debt.<br />
13.4 Revolving Credit Facility<br />
As at December 31, 2010, the company had a revolving credit facility of US$50 million. In <strong>2011</strong>, the company entered into an Amended <strong>and</strong> Restated<br />
Senior Secured Revolving Credit Facility (the “Facility”). The company incurred <strong>and</strong> capitalized transaction costs of approximately $817,000 on<br />
amendment of the Facility (2010 : $251,000).<br />
The Facility provides for revolving credit financing of up to $100 million, subject to borrowing base availability, including sub–facilities for letters of<br />
credit, swingline loans <strong>and</strong> borrowings in Canadian dollars <strong>and</strong> U.S. dollars. The Facility has an accordion feature whereby the Company can increase<br />
the Facility to $125.0 million. All outst<strong>and</strong>ing loans under the Facility are due <strong>and</strong> payable in full on May 31, 2014.<br />
In the case of Canadian dollar drawings, borrowings under the Facility bear interest at a rate per annum equal to the Canadian Prime Rate plus the<br />
applicable margin; in the case of US dollar drawings at US Base Rate plus the applicable margin. The applicable margin for borrowings under the<br />
Facility are subject to steps up <strong>and</strong> steps down based on average ratings the company’s debt as published by Moody’s <strong>and</strong> St<strong>and</strong>ard <strong>and</strong> Poors.<br />
In addition to paying interest on outst<strong>and</strong>ing principal under the Facility, the company is required to pay a st<strong>and</strong>by fee in respect of the unutilized<br />
commitments thereunder, which fee is determined based on utilization of the Facility with rates established in the Facility in a similar manner to<br />
the interest margins. The company must also pay customary letter of credit fees equal to the applicable margin. As at December 31, <strong>2011</strong>, the<br />
Company’s interest rate on the Facility was approximately 6.5% per annum. The Facility contains a requirement to maintain a ratio of consolidated<br />
total debt to total capitalization of under 75% (with convertible debt treated as equity <strong>and</strong> with up to $120 million added to equity for IFRS conversion<br />
adjustments) <strong>and</strong> borrowings under the Facility cannot exceed two times trailing adjusted EBITDA. The company has been in compliance with all<br />
covenants throughout 2010 <strong>and</strong> <strong>2011</strong>.<br />
All obligations under the Facility are unconditionally guaranteed by the company, are secured by substantially all of the assets of the company,<br />
including a first priority security interest on all of the current <strong>and</strong> future property, with the exception of certain pipeline assets in the USA.<br />
In <strong>2011</strong>, the company borrowed <strong>and</strong> repaid $62.9 million under the Facility. As at December 31, <strong>2011</strong>, the company had letters of credit outst<strong>and</strong>ing<br />
under the Facility of $2.2 million. No other amounts were outst<strong>and</strong>ing under the Facility.<br />
13.5 Convertible Debentures, Due June 30, 2012<br />
In May 2007, <strong>Connacher</strong> issued subordinated unsecured Convertible Debentures with a face value of $100,050,000. Interest is payable semi–<br />
annually on June 30 <strong>and</strong> December 31 at the rate of 4.75 percent. The Convertible Debentures mature on June 30, 2012, unless converted prior to<br />
that date. The Convertible Debentures are convertible at any time into common shares, at the option of the holder, at a conversion price of $5.00 per<br />
share. The Convertible Debentures are traded on Toronto Stock Exchange.<br />
The Convertible Debentures are redeemable on or after June 30, 2010 by the company, in whole or in part, at a redemption price equal to 100<br />
percent of the principal amount of the Convertible Debentures to be redeemed, plus accrued <strong>and</strong> unpaid interest, provided that the market price of the<br />
company’s common shares is at least 120 percent of the conversion price of the Convertible Debentures.<br />
The Convertible Debenture is considered a hybrid instrument for accounting purposes with a liability <strong>and</strong> a conversion option. The conversion option<br />
is considered an embedded derivative as the company has a choice to settle in cash in lieu of issuing shares in the event the debenture holders<br />
exercise their option to convert the debentures. The company elected not to bifurcate this embedded derivative <strong>and</strong> designated the entire Convertible<br />
Debentures as “fair value through profit <strong>and</strong> loss” <strong>and</strong> accordingly, recorded Convertible Debentures at fair value at each reporting period end with<br />
changes reported within net earnings (loss).<br />
In <strong>2011</strong>, the company recorded unrealized loss of $2.0 million (2010: $4.5 million) on remeasurement of the Convertible Debentures to fair value. The<br />
changes in the fair value of Convertible Debentures attributable to movements in the company’s credit risk are detailed in the table below:<br />
For the year ended December 31<br />
<strong>2011</strong> 2010<br />
(Canadian dollar in thous<strong>and</strong>s)<br />
Cumulative change in the fair value $ 2,235 $ 7,671<br />
Annual change in the fair value $ 5,436 $ 7,083<br />
The movement in fair value due to credit risk is calculated as the amount of change in fair value that is not attributable to changes in market<br />
conditions that give risk to market risk.
AR <strong>2011</strong><br />
PG 70<br />
The amount the company would contractually be required to pay at maturity was $1.5 million <strong>and</strong> $3.5 million more than the carrying amount as at<br />
December 31, <strong>2011</strong> <strong>and</strong> 2010, respectively.<br />
14. Decommissioning LIABILITIES<br />
The following table summarizes the details of decommissioning liabilities:<br />
For the year ended December 31<br />
<strong>2011</strong> 2010<br />
(Canadian dollar in thous<strong>and</strong>s)<br />
Balance, beginning of year $ 70,945 $ 53,729<br />
Liabilities incurred 2,415 11,560<br />
Liabilities acquired (note 10) 2,229 –<br />
Liabilities settled (1,018) (647)<br />
Liabilities disposed (10,483) (263)<br />
Change in estimates 332 4,463<br />
Unwinding of discount 1,658 2,103<br />
Balance, end of year 66,078 70,945<br />
Classified as held for sale – current portion (note 8) – (10,907)<br />
Balance, non–current portion $ 66,078 $ 60,038<br />
As a result of the analysis of the estimates of cash flows <strong>and</strong> timing to ab<strong>and</strong>on <strong>and</strong> reclaim petroleum <strong>and</strong> natural gas properties <strong>and</strong> changes in<br />
interest rates, the company recorded an increase in decommissioning liabilities of $0.3 million in <strong>2011</strong> (2010 : $4.5 million). At December 31, <strong>2011</strong>,<br />
the estimated total undiscounted amount at current cost required to settle the decommissioning liabilities was $67.6 million (2010 : $77.4 million).<br />
These payments are expected to be made over the the next 8 to 25 years. This amount has been discounted using risk–free rates of interest ranging<br />
between 1.66 percent to 2.42 percent, depending on the estimated time to ab<strong>and</strong>on the asset.<br />
15. RETIREMENT BENEFIT Obligation<br />
The company maintains the following retirement/savings plans for its employees: a defined benefit pension plan for USA based employees <strong>and</strong> a<br />
defined contribution savings plans for its USA <strong>and</strong> Canadian based employees.<br />
15.1 Defined benefit pension plan for USA employees<br />
The company’s USA subsidiary, MRCI, maintains a non–contributory defined benefit retirement plan (the “Defined Benefit Plan”) covering MRCI’s<br />
employees. MRCI’s policy is to make regular contributions in accordance with the funding requirements of the United States Employee Retirement<br />
Income Security Act of 1974, as determined by regular actuarial valuations. The company’s defined benefit obligation is based on the employees’<br />
years of service <strong>and</strong> compensation, effective from <strong>and</strong> after, March 31, 2006, the date that <strong>Connacher</strong> acquired MRCI. The information relating to the<br />
Defined Benefit Plan is as follows:<br />
The amounts recognized in the balance sheet are as follows:<br />
As at December 31<br />
<strong>2011</strong> 2010<br />
(Canadian dollar in thous<strong>and</strong>s)<br />
Present value of obligation $ 4,329 $ 2,607<br />
Fair value of plan assets (1,620) (1,299)<br />
2,709 1,308<br />
Unrecognized actuarial loss (2,294) (1,115)<br />
Liability recognized in balance sheet $ 415 $ 193<br />
The amounts recognized in net earnings (loss) are as follows:<br />
For the year ended December 31<br />
<strong>2011</strong> 2010<br />
(Canadian dollar in thous<strong>and</strong>s)<br />
Current service cost $ 603 $ 409<br />
Interest on obligation 156 121<br />
Expected return on plan assets (105) (93)<br />
Net actuarial loss (gain) recognized 54 (11)<br />
Total expense included in general <strong>and</strong> administrative expenses $ 708 $ 426<br />
Actual return on plan assets $ (1) $ 133
AR <strong>2011</strong><br />
PG 71<br />
Changes in present value of the defined benefit obligation are as follows:<br />
For the year ended December 31<br />
<strong>2011</strong> 2010<br />
(Canadian dollar in thous<strong>and</strong>s)<br />
Defined benefit obligation, beginning of year $ 2,607 $ 1,225<br />
Current service cost 603 409<br />
Interest cost 156 121<br />
Actuarial loss 1,104 1,193<br />
Benefits paid (216) (166)<br />
Foreign exchange loss (gain) 75 (175)<br />
Defined benefit obligation, end of year $ 4,329 $ 2,607<br />
Changes in fair value of plan assets are as follows:<br />
For the year ended December 31<br />
<strong>2011</strong> 2010<br />
(Canadian dollar in thous<strong>and</strong>s)<br />
Fair value of plan assets, beginning of year $ 1,299 $ 881<br />
Expected return on plan assets 105 93<br />
Actuarial (loss) gain on plan asset (106) 40<br />
Employer contributions 504 517<br />
Benefits paid (216) (166)<br />
Foreign exchange gain (loss) 34 (66)<br />
Fair value of plan assets, end of year $ 1,620 $ 1,299<br />
The company contributed US $1.5 million to the plan in 2012.<br />
MRCI is responsible for administering the Defined Benefit Plan <strong>and</strong> has retained the services of an independent <strong>and</strong> professional investment<br />
manager, as fund manager, for the related investment portfolio. Among the factors considered in developing the investment policy are the Defined<br />
Benefit Plan’s primary investment goal, rate of return objective, investment risk, investment time horizon, role of asset classes <strong>and</strong> asset allocation.<br />
The expected rate of return on plan assets is based on historical <strong>and</strong> projected rates of return for each asset class in the plan investment portfolio.<br />
The objective of the plan’s asset allocation policy is to manage the funded status of the plan at an appropriate level of risk, giving consideration to the<br />
security of the assets <strong>and</strong> the potential volatility of market returns <strong>and</strong> the resulting effect on both contribution requirements <strong>and</strong> pension expense.<br />
The long–term return is expected to achieve or exceed the return from a composite benchmark comprised of passive investments in appropriate<br />
market indices. The asset allocation structure is subject to diversification requirements <strong>and</strong> constraints which reduce risk by limiting exposure to<br />
individual equity investments, credit rating categories <strong>and</strong> foreign currency exposures. The composition of the plan asset is as follows:<br />
As at December 31 <strong>2011</strong> 2010<br />
Equity securities (percent) 58 58<br />
Fixed income securities (percent) 38 38<br />
Cash <strong>and</strong> cash equivalents (percent) 4 4<br />
Total 100 100<br />
Principal assumptions at the end of the reporting year (expressed as weighted averages):<br />
As at December 31 <strong>2011</strong> 2010<br />
Discount rate at December 31 (percent) 4.9 6.3<br />
Expected return on plan assets at December 31 (percent) 7.3 8.9<br />
Future salary increases (percent) 3.0 3.0<br />
Expected future service life (years) 16.8 15.7
AR <strong>2011</strong><br />
PG 72<br />
Estimated future benefits payments under the plan are as follows:<br />
(Canadian dollar in thous<strong>and</strong>s) As at December 31, <strong>2011</strong><br />
2012 $ 872<br />
2013 125<br />
2014 100<br />
2015 79<br />
2016 137<br />
2017 to 2021 1,932<br />
Total $ 3,245<br />
Amounts for the current <strong>and</strong> previous three years are as follows:<br />
As at December 31<br />
<strong>2011</strong> 2010 2009<br />
(Canadian dollar in thous<strong>and</strong>s)<br />
Defined benefit obligation $ 4,329 $ 2,607 $ 1,225<br />
Plan assets (1,620) (1,299) (881)<br />
Deficit $ 2,709 $ 1,308 $ 344<br />
Experience adjustments on plan liabilities $ 1,104 $ 1,193 $ (755)<br />
Experience adjustments on plan assets $ (106) $ 40 $ 72<br />
15.2 Defined contribution savings plan for USA Employees<br />
MRCI also maintains a defined contribution (US tax code “401(k)”) savings plan that covers all of its employees. MRCI’s contributions are based on<br />
employees’ compensation <strong>and</strong> partially match employee contributions. In <strong>2011</strong>, MRCI contributed $325,000 (2010 - $367,000) to this plan to satisfy,<br />
in full, its obligation under this plan. The contribution was recognized as follows:<br />
For the year ended December 31<br />
<strong>2011</strong> 2010<br />
(Canadian dollar in thous<strong>and</strong>s)<br />
Production <strong>and</strong> operating expense $ 258 $ 309<br />
General <strong>and</strong> administrative expense 67 58<br />
Total $ 325 $ 367<br />
15.3 Defined contribution savings plan for Canadian employees<br />
The company also maintains a defined contribution savings plan for its Canadian employees, whereby the company matches employee contributions<br />
to a maximum of eight percent of each employee’s salary. In <strong>2011</strong>, the company contributed $1.5 million (2010 – $1.4 million) to this plan to satisfy,<br />
in full, its obligation under this plan. The contribution was recognized as follows:<br />
For the year ended December 31<br />
<strong>2011</strong> 2010<br />
(Canadian dollar in thous<strong>and</strong>s)<br />
Production <strong>and</strong> operating expense $ 773 $ 746<br />
General <strong>and</strong> administrative expense 682 623<br />
Total $ 1,455 $ 1,369<br />
16. INCOME TAXES<br />
Income tax provision (recovery) recognized in net earnings (loss)<br />
For the year ended December 31<br />
<strong>2011</strong> 2010<br />
(Canadian dollar in thous<strong>and</strong>s)<br />
Current income tax (provision) recovery $ (1,534) $ 291<br />
Deferred income tax recovery 1,558 7,803<br />
Total income tax recovery $ 24 $ 8,094<br />
Income tax recovery recognized in other comprehensive income (loss)<br />
For the year ended December 31<br />
(Canadian dollar in thous<strong>and</strong>s) Before tax Tax<br />
<strong>2011</strong><br />
After tax Before tax Tax<br />
2010<br />
After tax<br />
Share of other comprehensive income (loss) of associate $ – $ – $ – $ (4,963) $ 676 $ (4,287)
AR <strong>2011</strong><br />
PG 73<br />
The provision for income taxes in net loss reflects an effective tax rate which differs from the expected statutory tax rate. These differences are<br />
presented below:<br />
For the years ended December 31<br />
<strong>2011</strong> 2010<br />
(Canadian dollar in thous<strong>and</strong>s)<br />
Loss before income taxes $ 114,129 $ 52,763<br />
Applicable tax rate 26.51% 28.05%<br />
Expected income tax expense recovery 30,256 14,800<br />
Impact of reduction in Canadian tax rates (1,735) (1,609)<br />
Impact of rate adjustment on US operations (2,576) (416)<br />
Foreign taxes (280) (752)<br />
Capital taxes (52) (437)<br />
Non taxable portion of foreign exchange gains <strong>and</strong> other (4,680) 2,159<br />
Impairment <strong>and</strong> dilution loss in associate (1,813) (2,772)<br />
Non deductible stock–based compensation costs (915) (1,408)<br />
Effect of unused tax losses not recognized as deferred tax assets (9,083) (1,471)<br />
Non-deductible portion of refinancing costs (9,098) –<br />
Total income tax recovery $ 24 $ 8,094<br />
Applicable tax rate is the aggregate of the federal income tax rate of 16.5% (2010 : 18%) <strong>and</strong> provincial tax rate of 10.01% (2010 : 10.05%). The<br />
reduction in provincial rates year over year are due to an increased allocation of income to Alberta which is taxable at 10%.<br />
The following is the analysis of deferred tax liabilities <strong>and</strong> assets:<br />
<strong>2011</strong> Opening<br />
balance<br />
Recognized in<br />
net loss<br />
Recognized<br />
directly<br />
in equity<br />
Recognized in<br />
other compprehensive<br />
Income (loss)<br />
Foreign<br />
exchange<br />
loss<br />
Recognized<br />
in trade<br />
<strong>and</strong> accrued<br />
Payables<br />
Deferred income tax liability<br />
Property, plant <strong>and</strong> equipment $ 175,180 $ 37,819 $ – $ – $ 344 $ – $ 213,343<br />
Long–term debt 8,164 517 – – – – 8,681<br />
183,344 38,336 – – 344 – 222,024<br />
Deferred income tax asset<br />
Losses carried forward 127,836 43,891 – – – – 171,727<br />
Financing <strong>and</strong> share issue costs 4,885 1,008 – – – – 5,893<br />
Decommissioning liabilities 15,926 598 – – – – 16,524<br />
Investment in Petrolifera 274 (274) – – – – –<br />
Risk management contracts <strong>and</strong> others 7,231 (5,329) – – – – 1,902<br />
156,152 39,894 – – – – 196,046<br />
Net deferred income tax liability $ 27,192 $ (1,558) $ – $ – $ 344 $ – $ 25,978<br />
Closing<br />
balance<br />
2010 Opening<br />
balance<br />
Recognized<br />
in net loss<br />
Recognized<br />
directly<br />
in equity<br />
Recognized in<br />
other compprehensive<br />
Income (loss)<br />
Foreign<br />
exchange<br />
loss<br />
Recognized in<br />
trade <strong>and</strong><br />
accrued<br />
Payables<br />
(note 17.1)<br />
Deferred income tax liability<br />
Property, plant <strong>and</strong> equipment $ 136,551 $ 37,033 $ – $ – $ (676) $ 2,272 $ 175,180<br />
Long–term debt 3,472 4,692 – – – – 8,164<br />
140,023 41,725 – – (676) 2,272 183,344<br />
Deferred income tax asset<br />
Losses carried forward 85,422 42,414 – – – – 127,836<br />
Financing <strong>and</strong> share issue costs 7,871 (3,412) 426 – – – 4,885<br />
Decommissioning liabilities 13,475 2,451 – – – – 15,926<br />
Investment in Petrolifera (3,181) 2,779 – 676 – – 274<br />
Risk management contracts <strong>and</strong> others 1,935 5,296 – – – – 7,231<br />
105,522 49,528 426 676 – – 156,152<br />
Net deferred income tax liability $ 34,501 $ (7,803) $ (426) $ (676) $ (676) $ 2,272 $ 27,192<br />
Closing<br />
balance
AR <strong>2011</strong><br />
PG 74<br />
The following provide the details of unrecognized deductible temporary differences, unused losses <strong>and</strong> unused tax credits for which no deferred tax<br />
asset has been recognized:<br />
As at December 31<br />
<strong>2011</strong> 2010<br />
(Canadian dollar in thous<strong>and</strong>s)<br />
Non-capital losses $ 1,138 $ 1,138<br />
Capital losses 155,700 82,202<br />
Successor Canadian resource tax pools 4,151 4,151<br />
Unused tax credits $ 3,388 $ 3,388<br />
The unrecognized non-capital losses expire in 2026, capital losses <strong>and</strong> successor Canadian resource tax pool do not have a set expiration <strong>and</strong> the<br />
unused tax credits expire in 2029 <strong>and</strong> 2030.<br />
The company has specific tax matters under discussion with tax authorities, the outcome of which is uncertain. Where the outcome of these matters is<br />
different from the amounts currently recorded, such differences will be recorded in net earnings (loss) in the period in which such determination is made.<br />
17. SHARE CAPITAL<br />
Authorized: unlimited number of common voting shares with no par value<br />
Authorized: unlimited number of first preferred shares with no par value of which none are outst<strong>and</strong>ing<br />
Authorized: unlimited number of second preferred shares with no par value of which none are outst<strong>and</strong>ing<br />
17.1 Issued <strong>and</strong> outst<strong>and</strong>ing common share capital<br />
For the year ended December 31 <strong>2011</strong> 2010<br />
Number Canadian dollar in<br />
thous<strong>and</strong>s<br />
Number Canadian dollar in<br />
thous<strong>and</strong>s<br />
Balance, beginning of year 447,167,694 $ 618,628 427,031,362 $ 593,119<br />
Issued for cash on flow–through basis<br />
net of premium of $2,272 – – 17,480,000 23,074<br />
Shares issued upon exercise of stock options 810,088 752 2,017,836 1,936<br />
Transfer from contributed surplus – share awards 282,209 534 638,496 480<br />
Transfer from contributed surplus – stock options 423 1,082<br />
Share issue cost, net of tax – (71) – (1,063)<br />
Balance, end of year 448,259,991 $ 620,266 447,167,694 $ 618,628<br />
Weighted average common shares outst<strong>and</strong>ing<br />
basic <strong>and</strong> diluted 448,024,574 432,257,947<br />
In October 2010, the company issued 17,480,000 common shares on a flow–through basis at a price of $1.45 per common share for gross proceeds<br />
of $25.3 million <strong>and</strong> renounced the qualifying expenditures to investors effective December 31, 2010. A premium of $2.3 million representing<br />
the difference between the gross proceeds <strong>and</strong> the share price of the company on the date of issue was initially recognized in trade <strong>and</strong> accrued<br />
payables <strong>and</strong> was subsequently recorded as a deferred tax provision on the renouncement of the qualifying expenditures on December 31, 2010.<br />
18. Stock Option Plan, SHARE AWARD INCENTIVE Plan <strong>and</strong> SHARE UNIT Plan<br />
18.1 Stock Option Plan<br />
The company has a Stock Option Plan for all officers, employees <strong>and</strong> consultants permitting the issue from time to time of options entitling the<br />
holders to acquire common shares. Options are granted at the discretion of the Board of Directors. The options have a term of five years to maturity<br />
<strong>and</strong> vest annually over a two to three year period. The maximum number of common shares reserved for issuance pursuant to the Stock Option Plan<br />
is ten percent of the issued common shares of the company from time to time, less four million common shares reserved for issuance under Share<br />
Award Incentive Plan <strong>and</strong> less the number of common shares reserved for issuance for outst<strong>and</strong>ing grants pursuant to the Share Unit Plan.
AR <strong>2011</strong><br />
PG 75<br />
The following table shows the changes in stock options <strong>and</strong> the related weighted average exercise prices:<br />
For the year ended December 31 <strong>2011</strong> 2010<br />
Number of Options<br />
Weighted Average<br />
Exercise Price<br />
Number of Options<br />
Weighted Average<br />
Exercise Price<br />
Outst<strong>and</strong>ing, beginning of year 24,413,668 $ 1.50 22,579,045 $ 1.72<br />
Granted 5,075,064 1.18 10,263,154 1.36<br />
Exercised (810,088) 0.93 (2,017,836) 0.96<br />
Forfeited (3,129,409) 1.39 (3,153,695) 2.15<br />
Expired (475,500) 4.36 (3,257,000) 2.31<br />
Outst<strong>and</strong>ing, end of year 25,073,735 $ 1.41 24,413,668 $ 1.50<br />
Exercisable, end of year 17,668,872 $ 1.49 13,166,750 $ 1.73<br />
The weighted average share price on the date of exercise for the options exercised in <strong>2011</strong> was $1.38 per common share (2010 : $1.47).<br />
The following table summarizes stock options outst<strong>and</strong>ing <strong>and</strong> exercisable under the plan.<br />
As at December 31 <strong>2011</strong> 2010<br />
Range of Exercise Prices<br />
Number<br />
Outst<strong>and</strong>ing<br />
Number<br />
Outst<strong>and</strong>ing<br />
Weighted<br />
Average<br />
Exercise Price<br />
Weighted<br />
Average<br />
Remaining<br />
Contractual Life<br />
Weighted<br />
Average Exercise<br />
Price<br />
Weighted<br />
Average<br />
Remaining<br />
Contractual Life<br />
$ 0.28 – $ 0.99 3,926,926 $ 0.72 2.9 3,598,599 $ 0.75 3.3<br />
$ 1.00 – $ 1.99 18,699,151 1.27 3.2 17,691,857 1.26 3.9<br />
$ 2.00 – $ 2.99 15,000 2.10 1.8 15,000 2.10 2.8<br />
$ 3.00 – $ 3.99 2,253,649 3.62 0.6 2,573,703 3.62 1.5<br />
$ 4.00 – $ 4.99 179,009 4.16 0.6 366,509 4.14 1.0<br />
$ 5.00 – $ 5.99 – – – 168,000 5.04 0.2<br />
25,073,735 $ 1.41 2.9 24,413,668 $ 1.50 3.5<br />
At the date of grant, the weighted average fair value of stock options granted in <strong>2011</strong> was $0.45 per option (2010 : $0.66 per option). The fair value of<br />
stock options granted was estimated on the date of grant using the Black–Scholes option pricing model using the following weighted average assumptions.<br />
For the year ended ended December 31 <strong>2011</strong> 2010<br />
Weighted average share <strong>and</strong> exercise price ($ per share) $ 1.18 $ 1.36<br />
Risk free interest rate (percent) 1.8 1.9<br />
Expected option life (year) 3.0 3.0<br />
Expected volatility (percent) 54 72<br />
Dividend yield (percent) – –<br />
Forfeiture rate (percent) 6.5 6.0<br />
The expected volatility measured at the st<strong>and</strong>ard deviation of continuously compounded share returns was based on statistical analysis of the daily<br />
share prices over the last two years (2010 : three years).<br />
18.2 Share Award Incentive Plan<br />
Under the Share Award Incentive Plan, share units may be granted to non–employee directors of the company in amounts determined by the Board of<br />
Directors on the recommendation of the Governance Committee. Share units have a one year vesting period <strong>and</strong> are settled by issuing common shares<br />
from treasury, subject to certain limitations. The Board of Directors may alternatively elect to pay cash equal to the fair market value of the common<br />
shares to be delivered to non–employee directors, upon vesting of such share units, in lieu of delivering common shares. The awards granted in <strong>2011</strong><br />
<strong>and</strong> 2010 were expected to be settled by delivery of common shares <strong>and</strong> accordingly, were considered an equity–settled awards for accounting<br />
purposes. The maximum number of common shares reserved for issuance under the Share Award Incentive Plan is four million common shares.<br />
The following table summarizes the changes in Share Award Incentive Plan:<br />
For the year ended December 31 <strong>2011</strong> 2010<br />
Outst<strong>and</strong>ing, beginning of year 380,598 648,916<br />
Granted 375,000 380,598<br />
Vested <strong>and</strong> settled by issuing common shares (282,209) (638,496)<br />
Vested <strong>and</strong> settled in cash (1) (124,431) –<br />
Cancelled (36,458) (10,420)<br />
Outst<strong>and</strong>ing, end of year 312,500 380,598<br />
(1) In satisfaction of withholding tax requirements.
AR <strong>2011</strong><br />
PG 76<br />
The estimated fair value of each award granted under the Share Award Incentive Plan was $1.36 (2010 : $1.29), which is equal to the share price<br />
at the date of the grant. The outst<strong>and</strong>ing awards of 312,500 <strong>and</strong> 380,598 as at December 31, <strong>2011</strong> <strong>and</strong> 2010, respectively, were fully vested <strong>and</strong><br />
settled in January 2012 <strong>and</strong> <strong>2011</strong>, respectively.<br />
18.3 Share Unit Plan<br />
In <strong>2011</strong>, the shareholders approved a Share Unit Plan for the company. The Share Unit Plan allows for the granting of Restricted Share Units<br />
(“RSUs”) <strong>and</strong> Performance Share Units (“PSUs”) to officers <strong>and</strong> employees of the company. An RSU represents the right of the holder to receive<br />
one fully–paid common share for each unit granted. A PSU represents the right of the holder to receive between 0 <strong>and</strong> 2 fully–paid common shares<br />
for each unit granted on the vesting date, depending on the performance factor applied thereto. The Board of Directors may alternatively elect to<br />
pay cash upon vesting of such share units, in lieu of delivering common shares. The units granted in <strong>2011</strong> are expected to be settled by delivery of<br />
common shares <strong>and</strong> accordingly, are considered equity–settled awards for accounting purposes. The maximum number of common shares that may<br />
be reserved from time to time for issuance under the Share Unit Plan is five million common shares. RSUs or PSUs granted under the Plan generally<br />
vest annually over a three year period.<br />
The following table summarizes the changes in Share Unit Plan:<br />
For the year ended December 31 <strong>2011</strong> 2010<br />
Outst<strong>and</strong>ing, beginning of year – –<br />
Granted 645,616 –<br />
Vested <strong>and</strong> Settled – –<br />
Forfeited (56,172) –<br />
Outst<strong>and</strong>ing, end of year 589,444 –<br />
Vested, end of year – –<br />
The estimated fair value of each RSUs granted under the Share Unit Plan was $1.05, which is equal to the share price at the date of the grant. A<br />
forfeiture rate of 6% was used in calculating the share–based compensation in <strong>2011</strong>. The outst<strong>and</strong>ing RSUs vest 50% on July 1, 2012 <strong>and</strong> 50% on<br />
July 1, 2013. No PSUs were granted in <strong>2011</strong> under the Share Unit Plan.<br />
18.4 Share–based compensation<br />
For the year ended December 31<br />
<strong>2011</strong> 2010<br />
(Canadian dollar in thous<strong>and</strong>s)<br />
Stock Option Plan $ 2,980 $ 6,095<br />
Share Award Incentive Plan 453 534<br />
Share Unit Plan 258 –<br />
Total share–based compensation 3,691 6,629<br />
Less: Share–based compensation capitalized (238) (1,610)<br />
Share–based compensation expensed $ 3,453 $ 5,019<br />
18.5 Contributed surplus<br />
For the year ended December 31<br />
<strong>2011</strong> 2010<br />
(Canadian dollar in thous<strong>and</strong>s)<br />
Balance, beginning of year $ 36,107 $ 31,040<br />
Share–based compensation 3,691 6,629<br />
Transfer to share capital – stock options exercised (423) (1,082)<br />
Transfer to share capital – share awards settled (534) (480)<br />
Balance, end of year $ 38,841 $ 36,107
AR <strong>2011</strong><br />
PG 77<br />
19. FINANCE Charges<br />
For the year ended December 31<br />
<strong>2011</strong> 2010<br />
(Canadian dollar in thous<strong>and</strong>s)<br />
Interest expense on long–term debt:<br />
Senior Notes $ 85,133 $ 91,922<br />
Convertible Debentures 4,751 4,751<br />
Revolving Credit Facility 275 72<br />
Amortization of transaction costs relating to the Facility 427 752<br />
St<strong>and</strong>–by fees relating to the Facility 796 999<br />
Bank charges <strong>and</strong> other fees 386 397<br />
Unrealized loss on derivative financial asset (note 21) 152 2,237<br />
Unwinding of discount on decommissioning liabilities (note 14) 1,658 2,103<br />
Unrealized loss on remeasurement of convertible debentures (note 13.5) 2,015 4,502<br />
Unrealized gain on foreign exchange contract (note 12) (5) –<br />
95,588 107,735<br />
Less: Interest capitalized on qualified assets – (38,290)<br />
Finance charges $ 95,588 $ 69,445<br />
Capitalized interest relates to the construction of the qualifying assets <strong>and</strong> has been included as a part of cost of upstream petroleum <strong>and</strong> natural gas<br />
properties. Effective October 1, 2010, capitalization of interest ceased.<br />
20. Foreign EXCHANGE (Gain) LOSS<br />
For the year ended December 31<br />
<strong>2011</strong> 2010<br />
(Canadian dollar in thous<strong>and</strong>s)<br />
Unrealized foreign exchange loss (gain) on translation of:<br />
U.S. denominated long–term debt $ 19,275 $ (42,552)<br />
Foreign currency denominated cash balances 364 3,241<br />
Other foreign currency denominated monetary items 3,341 (292)<br />
Unrealized foreign exchange loss (gain) 22,980 (39,603)<br />
Realized foreign exchange gain (note 13.3) (14,071) (2,038)<br />
Foreign exchange loss (gain) $ 8,909 $ (41,641)<br />
21. Gain (LOSS) On Disposition of Assets<br />
The following table shows the gain (loss) on disposition of assets recognized:<br />
For the year ended December 31<br />
<strong>2011</strong> 2010<br />
(Canadian dollar in thous<strong>and</strong>s)<br />
Gain on disposition of asset classified as held for sale (note 8.1) $ 28,357 $ –<br />
Gain on disposition of exploration <strong>and</strong> evaluation assets (note 9) 17,361 366<br />
Gain (loss) on disposition of property, plant <strong>and</strong> equipment (note 10) 2,345 (1,177)<br />
Loss on sale of equity securities (4,606) –<br />
Net gain (loss) on disposition of assets $ 43,457 $ (811)<br />
Upon completion of the exchange of an investment in associate as described in note 8.2 in March <strong>2011</strong>, the company acquired 3.3 million common<br />
shares <strong>and</strong> 841,000 common share purchase warrants of Gran Tierra Energy Inc. The common shares <strong>and</strong> common share purchase warrants of<br />
Gran Tierra Energy were listed on Toronto Stock Exchange. The investment in common shares was recorded at $25.7 million on the exchange with<br />
subsequent fair value measurement changes of $9.1 million recorded in other comprehensive loss. The investment was sold in <strong>2011</strong> for net cash<br />
proceeds of $21.1 million resulting in a loss of $4.6 million recorded in net earnings (loss), including the transfer of the $9.1 million from other<br />
comprehensive loss. Each common share purchase warrant entitled the company to purchase one common share of Gran Tierra Energy for $9.62 per<br />
common share. The common share purchase warrants expired unexercised in <strong>2011</strong>, resulting in a loss of $152,000.<br />
22. CAPITAL Management<br />
The company is exposed to financial risks on its financial instruments <strong>and</strong> in the way it finances its capital requirements. The company works to<br />
minimize its exposures to these risks through forward financial planning <strong>and</strong> with the use of financial derivatives. <strong>Connacher</strong>’s objectives in managing<br />
its cash, debt <strong>and</strong> equity <strong>and</strong> its future capital requirements are to safeguard its ability to meet its financial obligations, to maintain a flexible capital
AR <strong>2011</strong><br />
PG 78<br />
structure that allows multiple financing options when a financing need or opportunity arises <strong>and</strong> to optimize its use of long–term debt <strong>and</strong> equity at an<br />
appropriate level of risk. The company manages its capital structure <strong>and</strong> follows a financial strategy that considers economic <strong>and</strong> industry conditions,<br />
the risk characteristics <strong>and</strong> the long–term nature of its underlying assets <strong>and</strong> its growth opportunities. It strives to continuously improve its credit rating<br />
with the objective of reducing its cost of capital. <strong>Connacher</strong>’s current capital structure is summarized below:<br />
As at December 31<br />
<strong>2011</strong> 2010<br />
(Canadian dollar in thous<strong>and</strong>s)<br />
Long–term debt (1) $ 856,068 $ 847,387<br />
Shareholders’ equity 421,076 523,187<br />
Total long–term debt plus equity (“capitalization”) $ 1,277,144 $ 1,370,574<br />
Long–term debt to capitalization (2) 67% 62%<br />
(1) Long–term debt is stated at its carrying amount, which is net of transaction costs.<br />
(2) Calculated as long–term debt divided by the book value of shareholders’ equity plus long–term debt.<br />
The long–term debt agreements contain certain provisions, which restrict the company’s ability to incur additional indebtedness, pay dividends, make<br />
certain payments <strong>and</strong> dispose of collateralized assets.<br />
23. CASH flow information<br />
Changes in non–cash working capital<br />
As at December 31<br />
<strong>2011</strong> 2010<br />
(Canadian dollar in thous<strong>and</strong>s)<br />
Trade <strong>and</strong> accrued receivables $ (4,752) $ (15,618)<br />
Inventories (2,277) (21,802)<br />
Other assets 6,061 (173)<br />
Trade <strong>and</strong> accrued payables 20,535 (21,166)<br />
Total $ 19,567 $ (58,759)<br />
Relating to:<br />
Operations $ 14,048 $ (23,962)<br />
Investing 5,519 (34,797)<br />
Total $ 19,567 $ (58,759)<br />
Non–cash transaction<br />
In <strong>2011</strong>, the company received 3.3 million common shares <strong>and</strong> 841,000 common share purchase warrants of Gran Tierra Energy in exchange for the<br />
interest in associate. See note 8.2 <strong>and</strong> 21. There were no significant non–cash transactions in 2010.<br />
24. RELATED PARTY Transactions<br />
Subsidiaries<br />
Details of the company’s subsidiaries at the end of December 31, <strong>2011</strong>, December 31, 2010 <strong>and</strong> January 1, 2010 are as follows:<br />
Name of subsidiary Principal activity Place of incorporation<br />
<strong>and</strong> operation<br />
Proportion of<br />
ownership interest<br />
Great Divide Holding Corporation Holding company Canada 100<br />
Great Divide Pipeline Corporation Petroleum <strong>and</strong> natural gas USA 100<br />
Great Divide Pipeline Limited Petroleum <strong>and</strong> natural gas Canada 100<br />
Montana Refining Company, Inc Refining USA 100<br />
Balances <strong>and</strong> transactions between <strong>Connacher</strong> <strong>and</strong> its subsidiaries have been eliminated on consolidation <strong>and</strong> are not disclosed in this note. Details<br />
of transactions between the company <strong>and</strong> other related parties are disclosed below.<br />
Associate<br />
Under the terms of an Administrative Services Agreement, dated January 1, 2008 with Petrolifera, <strong>Connacher</strong> provided certain general <strong>and</strong><br />
administrative services to Petrolifera. The fee for this service was $15,000 per month. Petrolifera paid <strong>Connacher</strong> $45,000 in <strong>2011</strong> (2010: $180,000)<br />
under the Administrative Services Agreement. Petrolifera also reimbursed <strong>Connacher</strong> for certain other out–of–pocket expenses incurred by<br />
<strong>Connacher</strong> on Petrolifera’s behalf. The agreement was terminated upon closing of the transaction under the Plan of Arrangement. See note 8.2.<br />
The company also rented a portion of its office building to Petrolifera on sublease. The company recovered rental expenses of $30,000 in <strong>2011</strong><br />
(2010: $137,000). The sublease was terminated upon completion of the transaction under the Plan of Arrangement. See note 8.2.
AR <strong>2011</strong><br />
PG 79<br />
Compensation of key management personnel<br />
Key management personnel include directors <strong>and</strong> executive officers of <strong>Connacher</strong>. The compensation paid or payable to key management for services<br />
is shown below:<br />
For the year ended December 31<br />
<strong>2011</strong> 2010<br />
(Canadian dollar in thous<strong>and</strong>s)<br />
Short–term employee benefits $ 4,309 $ 4,353<br />
Post–employment benefits 197 229<br />
Termination benefits – 312<br />
Other long–term benefits 96 103<br />
Share–based payments 1,217 2,031<br />
$ 5,819 $ 7,028<br />
The company has management contracts with executive officers that require the company to pay a lump sum payment in case of loss of employment<br />
under certain circumstances as prescribed in these contracts. Subsequent to December 31, <strong>2011</strong>, the company paid approximately $5.5 million under<br />
these contracts as compensation for loss of employment.<br />
The stock options, awards <strong>and</strong> units held by key management personnel under the Stock Option Plan, Share Award Incentive Plan <strong>and</strong> Share Unit<br />
Plan were as follows:<br />
As at December 31 <strong>2011</strong> 2010<br />
Stock options<br />
Number of options (number in 000) 7,583 7,776<br />
Weighted average exercise price ($ per share) $ 1.75 $ 1.86<br />
Weighted average remaining life (years) 2.4 3.0<br />
Share awards<br />
Number of awards (number in 000) 313 381<br />
Weighted average remaining life (years) 4 4<br />
Share units<br />
Number of units (number in 000) 141 –<br />
Weighted average remaining life (years) 4.6 –<br />
25. Operating LEASE Arrangements<br />
Lease arrangements<br />
Operating leases relate to the lease of office space, rail cars <strong>and</strong> other equipment with terms ranging from 1 to 7 years. Certain of the leases entitle<br />
the company to renew the lease at the end of its lease term at then current market rates. The company does not have any material purchase options<br />
within its operating lease arrangements.<br />
Payments recognized as expense or capitalized<br />
For the year ended December 31<br />
<strong>2011</strong> 2010<br />
(Canadian dollar in thous<strong>and</strong>s)<br />
Minimum lease payments expensed – production, operating <strong>and</strong> transportation $ 1,574 $ 725<br />
Minimum lease payments expensed – general <strong>and</strong> administrative 5,390 2,714<br />
Minimum lease rentals received under sublease (151) (575)<br />
Total expense charged 6,813 2,864<br />
Minimum lease payments capitalized as a part of property, plant <strong>and</strong> equipment 606 1,409<br />
Total minimum lease payments recognized under operating lease $ 7,419 $ 4,273<br />
Non–cancellable operating lease commitments<br />
As at December 31<br />
<strong>2011</strong> 2010<br />
(Canadian dollar in thous<strong>and</strong>s)<br />
No later than 1 year $ 5,284 $ 3,243<br />
Later than 1 year but no later than 5 years 20,212 11,738<br />
Later than 5 years 1,545 4,923<br />
Total minimum lease payments under operating lease $ 27,041 $ 19,904
AR <strong>2011</strong><br />
PG 80<br />
26. Commitments<br />
Capital expenditure commitments<br />
As at December 31<br />
<strong>2011</strong> 2010<br />
(Canadian dollar in thous<strong>and</strong>s)<br />
Commitments relating to the acquisition of property, plant <strong>and</strong> equipment $ – $ 1,566<br />
Service <strong>and</strong> maintenance commitments<br />
The company is also contractually committed under certain contracts for the service <strong>and</strong> maintenance of facilities <strong>and</strong> equipment. The following table<br />
provides the details of these commitments:<br />
As at December 31<br />
<strong>2011</strong> 2010<br />
(Canadian dollar in thous<strong>and</strong>s)<br />
No later than 1 year $ 8,487 $ 4,104<br />
Later than 1 year but no later than 5 years 20,584 12,171<br />
Later than 5 years 16,800 38,702<br />
Total commitments $ 45,871 $ 54,977<br />
The primary service <strong>and</strong> maintenance commitment of the company included above relates to power infrastructure costs of $31.8 million as at<br />
December 31, <strong>2011</strong>.<br />
27. First TIME ADOPTION of IFRS<br />
As described in note 2, these are the company’s first consolidated financial statements prepared in accordance with IFRS. As a result, these<br />
consolidated financial statements have been prepared in accordance with IFRS 1, “First–time Adoption of International Financial Reporting St<strong>and</strong>ards”.<br />
IFRS 1 requires the presentation of comparative information as at the January 1, 2010 (the “transition date”) <strong>and</strong> subsequent comparative periods<br />
using the consistent <strong>and</strong> retrospective application of IFRS accounting policies. However, to assist with the transition, the provisions of IFRS 1 allow<br />
for certain m<strong>and</strong>atory exceptions <strong>and</strong> optional exemptions from the requirement of retrospective application of accounting policies <strong>and</strong> st<strong>and</strong>ards on<br />
first–time adoption of IFRS. Accordingly, these consolidated financial statements were prepared using the accounting policies stated in note 3 of the<br />
consolidated financial statements <strong>and</strong> were retrospectively <strong>and</strong> consistently applied except where specific IFRS 1 m<strong>and</strong>atory exceptions <strong>and</strong> optional<br />
exemptions required or permitted an alternative treatment upon transition to IFRS for first–time adopters. The significant m<strong>and</strong>atory exceptions <strong>and</strong><br />
optional exemptions applied under IFRS 1 in preparing these consolidated financial statements are set out below:<br />
Deemed cost election for petroleum <strong>and</strong> natural gas properties<br />
Under previous GAAP, the company followed the “full cost” method of accounting for petroleum <strong>and</strong> natural gas activities under which all costs directly<br />
associated with the acquisition of, the exploration for, <strong>and</strong> the development of petroleum <strong>and</strong> natural gas reserves were capitalized on a country–<br />
by–country cost centre basis. The company had one cost centre, Canada, for the upstream segment. Costs accumulated within this one cost centre<br />
were depleted using the unit–of–production method based on proved reserves determined using estimated future prices <strong>and</strong> costs. Upon transition<br />
to IFRS, the company was required to adopt new accounting policies for upstream activities, including the segregation of exploration <strong>and</strong> evaluation<br />
costs <strong>and</strong> petroleum <strong>and</strong> natural gas properties. Under IFRS, exploration <strong>and</strong> evaluation costs are those expenditures for which technical feasibility<br />
<strong>and</strong> commercial viability has not yet been determined, are presented separately on the balance sheet as exploration <strong>and</strong> evaluation assets <strong>and</strong> may<br />
or may not be amortized based on the company’s accounting policy. Petroleum <strong>and</strong> natural gas properties include those expenditures where technical<br />
feasibility <strong>and</strong> commercial viability has been determined, are presented as a part of property, plant <strong>and</strong> equipment on the balance sheet <strong>and</strong> are<br />
depleted <strong>and</strong> depreciated on a segregated basis based on the company’s accounting policy. The company adopted the IFRS 1 exemption whereby the<br />
company deemed its January 1, 2010 IFRS upstream asset costs to be equal to its previous GAAP historical upstream property, plant <strong>and</strong> equipment<br />
net book value. Accordingly, exploration <strong>and</strong> evaluation costs were deemed equal to the unproved properties balance <strong>and</strong> the petroleum <strong>and</strong> natural<br />
gas properties costs were deemed equal to the remaining upstream full cost pool balance. The petroleum <strong>and</strong> natural gas property costs were<br />
allocated for depletion, depreciation <strong>and</strong> impairment testing purposes on a pro rata basis using proved reserves values at the transition date.<br />
Leases<br />
The company elected not to reassess whether an arrangement contained a lease under IFRIC 4, “Determining whether an Arrangement contains a<br />
Lease”, for contracts that were assessed under previous GAAP.<br />
Business combinations<br />
IFRS 3, “Business Combinations” was not applied to business combinations that occurred before the transition date.<br />
Borrowing costs<br />
Borrowing costs directly attributable to the acquisition or construction of qualifying assets were not retrospectively restated prior to the transition date.
AR <strong>2011</strong><br />
PG 81<br />
Estimates<br />
Hindsight was not used to create or revise estimates <strong>and</strong> accordingly, the estimates made by the company under previous GAAP are consistent with<br />
their application under IFRS.<br />
Additional exemptions applied<br />
The company applied additional exemptions for cumulative foreign currency translation differences, share-based compensation, asset retirement<br />
obligations/decommissioning liabilities <strong>and</strong> accounting for its investment in associate, which are explained in notes 27.4, 27.5, 27.6 <strong>and</strong> 27.7, respectively.<br />
The following reconciliations present the adjustments made to the company’s previous GAAP financial results of operations <strong>and</strong> financial position to<br />
comply with IFRS 1. A summary of the significant accounting policy changes <strong>and</strong> applicable exemptions are discussed following the reconciliations.<br />
Reconciliations include the company’s consolidated balance sheets as at December 31, 2010 <strong>and</strong> January 1, 2010 <strong>and</strong> the consolidated statements<br />
of operations <strong>and</strong> comprehensive loss for the year ended December 31, 2010.<br />
Reconciliation of Consolidated Balance Sheet<br />
As at January 1, 2010<br />
(Canadian dollar in thous<strong>and</strong>s)<br />
IFRS Adjustments<br />
Previous E&E Impairment<br />
Foreign Compen– ARO Associate Taxes Debt IFRS<br />
GAAP<br />
Currency sation<br />
ASSETS Notes 27.1 27.2 27.4 27.5 27.6 27.7 27.8 27.9<br />
CURRENT ASSETS<br />
Cash $ 256,787 $ – $ – $ – $ – $ – $ – $ – $ – $ 256,787<br />
Trade <strong>and</strong> accrued receivables 43,067 – – – – – – – – 43,067<br />
Inventories 36,871 – – – – – – – – 36,871<br />
Other assets 17,774 – – – – – – – – 17,774<br />
Deferred tax assets 2,348 – – – – – – (2,348) – –<br />
356,847 – – – – – – (2,348) – 354,499<br />
NON–CURRENT ASSETS<br />
Other assets 708 – – – – – 2,711 – – 3,419<br />
Investment in associate 50,379 – – – – – (2,139) – – 48,240<br />
Exploration <strong>and</strong> evaluation assets – 96,162 – – – – – – – 96,162<br />
Property, plant <strong>and</strong> equipment 1,230,256 (96,162) (10,180) – – – – – – 1,123,914<br />
Goodwill 103,676 – (103,676) – – – – – – –<br />
1,385,019 – (113,856) – – – 572 – – 1,271,735<br />
$ 1,741,866 $ – $ (113,856) $ – $ – $ – $ 572 $ (2,348) $ – $ 1,626,234<br />
LIABILITIES AND SHAREHOLDERS’ EQUITY<br />
CURRENT LIABILITIES<br />
Trade <strong>and</strong> accrued payables $ 105,620 $ – $ – $ – $ (816) $ – $ – $ – $ – $ 104,804<br />
Risk management contracts 4,520 – – – – – – – – 4,520<br />
110,140 – – – (816) – – – – 109,324<br />
NON–CURRENT LIABILITIES<br />
Long–term debt 876,181 – – – – – – – 3,558 879,739<br />
Decommissioning liabilities 32,848 – – – – 20,881 – – – 53,729<br />
Retirement benefit obligation 1,066 – – – (722) – – – – 344<br />
Deferred income taxes 50,043 – (2,545) – – (5,237) 72 (7,832) – 34,501<br />
960,138 – (2,545) – (722) 15,644 72 (7,832) 3,558 968,313<br />
SHAREHOLDERS’ EQUITY<br />
Share capital 590,845 – – – – – – 2,274 – 593,119<br />
Equity component of convertible<br />
16,817 – – – – – – – (16,817) –<br />
debentures<br />
Contributed surplus 30,560 – – – 480 – – – 31,040<br />
Retained Earnings (Deficit) 49,544 – (111,311) (16,178) 1,058 (15,644) 1,127 3,210 13,259 (74,935)<br />
Accumulated other<br />
comprehensive loss (16,178) – – 16,178 – – (627) – (627)<br />
671,588 – (111,311) – 1,538 (15,644) 500 5,484 (3,558) 548,597<br />
$ 1,741,866 $ – $ (113,856) $ – $ – $ – $ 572 $ (2,348) $ – $ 1,626,234
AR <strong>2011</strong><br />
PG 82<br />
Reconciliation of Consolidated Balance Sheet<br />
As at December 31, 2010<br />
(Canadian dollar in thous<strong>and</strong>s)<br />
Previous<br />
GAAP<br />
E&E<br />
AHFS &<br />
Disposi–<br />
tion<br />
Foreign<br />
Currency<br />
IFRS Adjustments<br />
DD&A <strong>and</strong><br />
Impairment<br />
Compensation<br />
ARO Associate Taxes Debt IFRS<br />
ASSETS Notes 27.1 27.2 27.3 27.4 27.5 27.6 27.7 27.8 27.9<br />
CURRENT ASSETS<br />
Cash $ 19,532 $ – $ – $ – $ – $ – $ – $ – $ – $ – $ 19,532<br />
Trade <strong>and</strong> accrued receivables 57,419 – – – – – – – – – 57,419<br />
Inventories 57,144 – – – – – – – – – 57,144<br />
Other assets 17,653 – – – – – – – – – 17,653<br />
Deferred tax assets 4,497 – – – – – – – (4,497) – –<br />
Assets held for sale – – – 60,000 – – – 28,157 – – 88,157<br />
156,245 – – 60,000 – – – 28,157 (4,497) – 239,905<br />
NON–CURRENT ASSETS<br />
Other assets 615 – – – – – – – – – 615<br />
Investment in associate 27,938 – – – – – – (27,938) – – –<br />
Exploration <strong>and</strong> evaluation assets – 120,844 (4,609) (5,286) – – – – – – 110,949<br />
Property, plant <strong>and</strong> equipment 1,395,524 (121,808) (4,266) (60,001) – (53) 11,685 – (3,413) – 1,217,668<br />
Goodwill 103,676 – (103,676) – – – – – – – –<br />
1,527,753 (964) (112,551) (65,287) – (53) 11,685 (27,938) (3,413) – 1,329,232<br />
$ 1,683,998 $ (964) $ (112,551) $ (5,287) $ – $ (53) $ 11,685 $ 219 $ (7,910) $ – $ 1,569,137<br />
LIABILITIES AND SHAREHOLDERS’ EQUITY<br />
CURRENT LIABILITIES<br />
Trade <strong>and</strong> accrued payables $ 81,886 $ – $ – $ – $ – $ (516) $ – $ – $ – $ – $ 81,370<br />
Risk management contracts 8,984 – – – – – – – – – 8,984<br />
Liabilities relating to<br />
assets held for sale – – – 10,907 – – – – – – 10,907<br />
90,870 – – 10,907 – (516) – – – – 101,261<br />
NON–CURRENT LIABILITIES<br />
Risk management contracts 9,879 – – – – – – – – – 9,879<br />
Long–term debt 843,601 – – – – – – – – 3,786 847,387<br />
Decommissioning liabilities 39,191 – – (10,907) – – 31,754 – – – 60,038<br />
Retirement benefit obligation 915 – – – – (722) – – – – 193<br />
Deferred income tax 49,359 (242) (2,237) (1,331) – – (6,108) (636) (11,613) – 27,192<br />
942,945 (242) (2,237) (12,238) – (722) 25,646 (636) (11,613) 3,786 944,689<br />
SHAREHOLDERS’ EQUITY<br />
Share capital 611,599 – – – – (522) – – 7,551 – 618,628<br />
Equity component of debentures 16,817 – – – – – – – – (16,817) –<br />
Contributed surplus 35,503 – – – – 604 – – – – 36,107<br />
Retained earnings (Deficit) 10,746 (722) (110,314) (3,956) (16,178) 1,103 (13,961) 4,495 (3,848) 13,031 (119,604)<br />
Accumulated other<br />
comprehensive loss (24,482) – – – 16,178 – – 852 – – (7,452)<br />
Accumulated other comprehensive<br />
loss for assets held for sale – – – – – – – (4,492) – – (4,492)<br />
650,183 (722) (110,314) (3,956) – 1,185 (13,961) 855 3,703 (3,786) 523,187<br />
$ 1,683,998 $ (964) $ (112,551) $ (5,287) $ – $ (53) $ 11,685 $ 219 $ (7,910) $ – $ 1,569,137
AR <strong>2011</strong><br />
PG 83<br />
Reconciliation of Consolidated Statement of Operations <strong>and</strong> Comprehensive Loss<br />
For the year ended December 31, 2010<br />
(Canadian dollar in thous<strong>and</strong>s)<br />
Previous<br />
GAAP<br />
E&E<br />
DD&A <strong>and</strong><br />
Impair-ment<br />
AHFS &<br />
Disposi–tion<br />
IFRS Adjustments<br />
Compensation<br />
ARO Associate Taxes Reclass Debt IFRS<br />
INCOME Notes 27.1 27.2 27.3 27.5 27.6 27.7 27.8 27.10 27.9<br />
Revenue $ 589,931 $ – $ – $ – $ – $ – $ – $ – $ – $ – $ 589,931<br />
Interest <strong>and</strong> other income 256 – – – – – – – – – 256<br />
590,187 – – – – – – – – – 590,187<br />
EXPENSES<br />
Blending <strong>and</strong> costs of products sold 347,467 – – – – – – – (3,885) – 343,582<br />
Production <strong>and</strong> operating 101,148 – – – – – – – – – 101,148<br />
Transportation <strong>and</strong> h<strong>and</strong>ling 26,772 – – – – – – – – 26,772<br />
General <strong>and</strong> administrative 19,921 – – – – – – 3,885 – 23,806<br />
Share–based compensation 5,063 – – – (44) – – – – – 5,019<br />
Exploration <strong>and</strong> evaluation 964 – – – – – – – – 964<br />
Depletion, depreciation, amortization 79,586 – (1,305) 4,476 – – – – (2,915) – 79,842<br />
<strong>and</strong> impairment<br />
Loss on risk management contracts 17,186 – – – – – – – – – 17,186<br />
Finance charges 64,877 – – – (812) 2,237 – 2,915 228 69,445<br />
Foreign exchange gains (41,641) – – – – – – – – – (41,641)<br />
Loss on disposition of assets – – – 811 – – – – – – 811<br />
Share of interest in associate 21,393 – – – – – (5,377) – – – 16,016<br />
641,772 964 (1,305) 5,287 (44) (812) (3,140) – – 228 642,950<br />
EARNINGS (LOSS) BEFORE TAX (51,585) (964) 1,305 (5,287) 44 812 3,140 – – (228) (52,763)<br />
Income tax (expense) recovery 12,787 242 (308) 1,331 – 871 228 (7,057) – – 8,094<br />
NET EARNINGS (LOSS) (38,798) (722) 997 (3,956) 44 1,683 3,368 (7,057) – (228) (44,669)<br />
OTHER COMPREHENSIVE LOSS<br />
AFTER TAX<br />
Exchange differences on translating (7,452) – – – – – – – – – (7,452)<br />
foreign operations<br />
Share of other comprehensive loss (852) – – – – – (3,435) – – – (4,287)<br />
of associate<br />
Transfer on loss of ownership – – – – – – 422 – – – 422<br />
OTHER COMPREHENSIVE<br />
(8,304) – – – – – (3,013) – – – (11,317)<br />
LOSS AFTER TAX<br />
TOTAL COMPREHENSIVE LOSS $ (47,102) $ (722) $ 997 $ (3,956) $ 44 $ 1,683 $ 355 $ (7,057) $ – $ (228) $ (55,986)<br />
LOSS PER SHARE<br />
Previous<br />
IFRS<br />
GAAP<br />
Basic <strong>and</strong> diluted (note 27.12) $ (0.09) $ (0.10)<br />
27. FIRST time adoption of IFRS (continued)<br />
27.1 Exploration <strong>and</strong> Evaluation (“E&E”)<br />
As explained above under “Deemed cost election for petroleum <strong>and</strong> natural gas properties”, the company reclassified $96.2 million <strong>and</strong> $120.8 million<br />
to exploration <strong>and</strong> evaluation assets at January 1, 2010 <strong>and</strong> December 31, 2010, respectively, based on the deemed carrying amounts representing<br />
the unproved properties balance as determined under previous GAAP.<br />
Additionally, under IFRS, costs incurred prior to obtaining the legal rights to explore are expensed whereas under previous GAAP these costs were<br />
capitalized as part of property, plant <strong>and</strong> equipment. Accordingly, the company recognized exploration <strong>and</strong> evaluation expense in net earnings (loss)<br />
of $964,000 in the year ended December 31, 2010 <strong>and</strong> recorded the corresponding decrease to the property, plant <strong>and</strong> equipment. This adjustment<br />
also resulted in an equivalent decrease in cash flow from operating activities under IFRS compared to the reported amounts under previous GAAP.<br />
The effect of the above adjustment on retained earnings (deficit) was a reduction of $722,000 after tax benefits of $242,000 for the year ended<br />
December 31, 2010.
AR <strong>2011</strong><br />
PG 84<br />
27.2 Depletion, Depreciation <strong>and</strong> Amortization (“DD&A”) <strong>and</strong> Impairment<br />
Depletion, depreciation <strong>and</strong> amortization<br />
As explained above under “Deemed cost election for petroleum <strong>and</strong> natural gas properties”, petroleum <strong>and</strong> natural gas properties at January 1, 2010<br />
were deemed to be $1,029 million, representing the upstream full cost pool balance under previous GAAP <strong>and</strong> were presented as property, plant<br />
<strong>and</strong> equipment.<br />
Under previous GAAP, petroleum <strong>and</strong> natural gas properties were depleted using the unit–of–production method calculated for one Canada cost<br />
centre. Under IFRS, petroleum <strong>and</strong> natural gas properties are depleted using the unit–of–production method based on estimated proved <strong>and</strong> probable<br />
reserves determined using estimated future prices <strong>and</strong> costs calculated at the established area level. Further, as permitted under IFRS, the company<br />
elected to amortize certain exploration <strong>and</strong> evaluation assets (undeveloped l<strong>and</strong>) over the lease term. Under previous GAAP, undeveloped l<strong>and</strong> was<br />
tested for impairment <strong>and</strong> any resulting impairment was included in the full cost pool for depletion purposes. As a result, DD&A decreased by $1.3<br />
million in the year ended December 31, 2010 with a corresponding change to exploration <strong>and</strong> evaluation assets <strong>and</strong> property, plant <strong>and</strong> equipment.<br />
The effect of the above adjustment on deficit was a decrease of $1.0 million after tax benefits of $0.3 million for the year ended December 31, 2010.<br />
Impairment<br />
Under previous GAAP, capitalized costs of petroleum <strong>and</strong> natural gas properties <strong>and</strong> goodwill were tested for impairment separately whereas<br />
under IFRS, capitalized costs of petroleum <strong>and</strong> natural gas properties <strong>and</strong> goodwill are allocated to cash–generating units (“CGU’s) for impairment<br />
testing purposes.<br />
Under previous GAAP, impairment of petroleum <strong>and</strong> natural gas properties was recognized if the carrying amount exceeded the undiscounted cash<br />
flows from proved reserves for a country cost centre. Impairment was measured as the amount by which the carrying amount exceeded the sum<br />
of the fair value of proved <strong>and</strong> probable reserves <strong>and</strong> the costs of unproved properties. The company did not report any impairment under previous<br />
GAAP on December 31, 2009 <strong>and</strong> 2010.<br />
Under previous GAAP, goodwill was tested with reference to the reporting unit. All assets <strong>and</strong> liabilities, including goodwill were allocated to the<br />
company’s segments, referred to as reporting units. To initially test impairment, the fair value of each reporting unit was determined <strong>and</strong> compared<br />
to the carrying amount of the reporting unit. If the fair value of the reporting unit was less than the carrying amount, a second test was performed to<br />
determine the amount of the impairment. The amount of the impairment was determined by deducting the fair value of the reporting unit’s assets <strong>and</strong><br />
liabilities from the fair value of the reporting unit to determine the implied fair value of goodwill <strong>and</strong> comparing that amount to the carrying amount of<br />
the reporting unit’s goodwill. Under previous GAAP, the goodwill was allocated to the upstream reporting unit <strong>and</strong> was not considered impaired.<br />
Under IFRS, impairment is recognized if the carrying amount for a CGU exceeds the recoverable amount. A CGU is defined as the smallest<br />
identifiable group of assets that generates cash inflows that are largely independent of the cash inflows from other assets or group of assets. If the<br />
carrying amount of the CGU exceeds the recoverable amount, the CGU is written down with the impairment recognized in net earnings (loss). The<br />
recoverable amount is determined as the higher of value in use <strong>and</strong> fair value less cost to sell where value in use is the present value of the future<br />
cash flows expected to be derived from continuing use of the CGU <strong>and</strong> fair value less cost to sell is the estimated amount obtainable from the sale of<br />
the CGU in an arm’s length transaction between knowledgeable <strong>and</strong> willing parties, less costs of disposal.<br />
IFRS requires the performance of a goodwill impairment test upon the transition date. The company performed an impairment test by allocating all<br />
capitalized costs of petroleum <strong>and</strong> natural gas properties, goodwill <strong>and</strong> directly related liabilities to applicable cash–generating units based on their<br />
ability to generate largely independent cash flows (a lower level than previous GAAP) <strong>and</strong> determined that an impairment charge of $113.9 million on<br />
January 1, 2010 was required. Of the total impairment charge, $103.7 million was allocated to goodwill <strong>and</strong> $10.2 million was allocated to petroleum<br />
<strong>and</strong> natural gas properties with the corresponding increase to deficit of $111.3 million, net of tax benefits of $2.6 million.<br />
The recoverable amount used in the impairment calculation was determined using the value in use, calculated using a discounted cash flow model.<br />
The company engaged an independent firm of reserve evaluators to estimate the company’s petroleum <strong>and</strong> natural gas reserves. The cash flows<br />
used in the valuation were derived from this report. The cash flow projections used by the company in the impairment assessment covered a period<br />
of 5 years which the company determined to be appropriate production profile for the assets in Northern Alberta CGU, which primarily contained dry<br />
natural gas.<br />
The key assumptions used included natural gas prices, production volumes, operating costs, future capital expenditure <strong>and</strong> the discount rate as<br />
follows: The AECO natural gas price assumption was an average of $5.96/mmBtu in 2010, $6.79/mmBtu in <strong>2011</strong>, $6.89/mmBtu in 2012, $6.95/<br />
mmBtu in 2013, $7.05/mmBtu in 2014. Production volumes were estimated taking into account existing natural gas reserves <strong>and</strong> well capability.<br />
Future capital expenditures were estimated based on the company’s budget allocated to the CGU <strong>and</strong> operating costs were estimated based on<br />
historical experience adjusted for inflation at a rate of 2%. The future cash flows were discounted using a discount rate of 14%.
AR <strong>2011</strong><br />
PG 85<br />
27.3 Asset <strong>and</strong> Liabilities Held For Sale (“AHFS”) <strong>and</strong> Disposition of Petroleum <strong>and</strong> Natural <strong>Gas</strong> Properties<br />
Under previous GAAP, the proceeds from disposition of petroleum <strong>and</strong> natural gas properties were deducted from the full cost pool without<br />
recognition of a gain or loss <strong>and</strong> the accounting st<strong>and</strong>ard for classification of assets <strong>and</strong> liabilities as held for sale was not applicable to the disposition<br />
of petroleum <strong>and</strong> natural gas properties, unless the impact of the disposition was expected to result in a change to the DD&A rate of 20 percent or<br />
greater, in which case a gain or loss was recorded <strong>and</strong> assets <strong>and</strong> liabilities were classified as held for sale.<br />
Under IFRS, gains or losses are recorded on dispositions <strong>and</strong> are calculated as the difference between the proceeds <strong>and</strong> the net book value of the asset<br />
disposed of, <strong>and</strong> the requirements of the classification of assets <strong>and</strong> liabilities as held for sale are applicable to all petroleum <strong>and</strong> natural gas properties.<br />
As explained in note 8.1, the company classified its assets <strong>and</strong> liabilities relating to certain petroleum <strong>and</strong> natural gas properties as held for sale<br />
on December 31, 2010 <strong>and</strong> recorded them at the lower of their carrying amount or fair value less costs to sell. The adjustment resulted in a<br />
reclassification of the carrying amount of property, plant <strong>and</strong> equipment totaling $54.3 million, exploration <strong>and</strong> evaluation assets totaling $5.7 million<br />
<strong>and</strong> asset retirement obligation/decommissioning liabilities totaling $10.9 million to assets <strong>and</strong> liabilities classified as held for sale as at December<br />
31, 2010. At December 31, 2010, an impairment charge of $4.5 million was recognized as depletion, depreciation, amortization <strong>and</strong> impairment based<br />
on the difference between the December 31, 2010 carrying amount of the assets prior to reclassification <strong>and</strong> the estimated recoverable amount.<br />
The recoverable amount was determined using fair value less costs to sell which was based on the the sale price subsequently agreed to under the<br />
binding sale agreements with the third party. See note 10.<br />
During the year ended December 31, 2010, the company recognized a loss of $0.8 million on the sale of minor petroleum <strong>and</strong> natural gas properties<br />
<strong>and</strong> exploration <strong>and</strong> evaluation assets.<br />
The effect of the above adjustments on deficit was a reduction of $3.9 million after tax benefits of $1.3 million for the year ended December 31, 2010.<br />
27.4 Foreign Currency<br />
In accordance with IFRS 1, the company has elected to deem all foreign currency translation differences that arose prior to the transition date in<br />
respect of foreign operations <strong>and</strong> the company’s share of associate’s translation differences to be nil <strong>and</strong> reclassified amounts recorded in other<br />
comprehensive loss as determined in accordance with previous GAAP to Retained Earnings (Deficit). As a result, accumulated other comprehensive<br />
loss was decreased by $16.2 million with a corresponding increase to deficit as at January 1, 2010.<br />
27.5 Compensation<br />
Share-based payments<br />
In accordance with IFRS 1, the company has elected to apply the requirements of IFRS 2 “Share–Based Payment” to those equity instruments<br />
that were issued after November 7, 2002 but that had not vested as of January 1, 2010. The company had two equity compensation plans on the<br />
transition date.<br />
Employee Stock Option Plan – previous GAAP allowed the company to choose an accounting policy of recording the estimate of forfeiture either<br />
on the date of the grant or by recording it in the period when forfeiture actually occurred. The company’s accounting policy had been to record<br />
forfeitures in the period when they occurred. IFRS requires entities to measure the estimate of forfeiture at the time of grant. As a result, share–based<br />
compensation expense <strong>and</strong> property, plant <strong>and</strong> equipment were decreased with a corresponding decrease to contributed surplus for the year ended<br />
December 31, 2010. The impact of the estimate of the forfeitures on the unvested options as of January 1, 2010 was not material <strong>and</strong> no adjustment<br />
was required on January 1, 2010.<br />
Share Award Incentive Plan – Under previous GAAP, awards issued under share award incentive plan were considered a liability award <strong>and</strong> were<br />
revalued at each reporting period end with changes recorded in net earnings (loss) <strong>and</strong> the corresponding amounts recorded in trade <strong>and</strong> accounts<br />
payable. Under IFRS 2, awards issued under the share award plan are equity–settled awards <strong>and</strong> recorded on the date of grant using the grant date<br />
fair value. The grant date fair value is determined based on the quoted market price of the company’s common shares on the date of grant. As a result,<br />
share–based compensation was decreased to reflect the removal of the impact of revaluation recorded under previous GAAP. Additionally the related<br />
share–based compensation which was reported as a part of trade <strong>and</strong> accounts payables under previous GAAP was reclassified to contributed<br />
surplus. On January 1, 2010, the company reclassified $816,000 from trade <strong>and</strong> accounts payables, removed prior revaluation from Retained<br />
Earnings (Deficit) totaling $336,000 <strong>and</strong> recorded the remaining amount of $480,000 to contributed surplus representing the value of outst<strong>and</strong>ing<br />
awards on the transition date.<br />
The effect of the above share based payments adjustments was an increase of $44,000 to deficit, a reduction to property, plant <strong>and</strong> equipment<br />
of $53,000, a reduction to trade <strong>and</strong> accounts payables of $516,000 <strong>and</strong> an increase to contributed surplus of $604,000 for the year ended<br />
December 31, 2010.<br />
Defined benefit plan<br />
The company elected to use the IFRS 1 exemption whereby the cumulative unamortized net actuarial gains <strong>and</strong> losses of the company’s defined<br />
benefit plan were charged to deficit on January 1, 2010. This resulted in a decrease of $722,000 to the accrued benefit obligation <strong>and</strong> a<br />
corresponding decrease to deficit.
AR <strong>2011</strong><br />
PG 86<br />
27.6 Asset Retirement Obligation (“ARO”) / Decommissioning liabilities<br />
Under previous GAAP, the asset retirement obligation was measured at estimated fair value determined using estimated future cash outflows<br />
discounted using a credit–adjusted risk free interest rate <strong>and</strong> the liability was not remeasured to reflect period end discount rates. Under IFRS, the<br />
asset retirement obligation has been named “decommissioning liabilities”, fair value is measured as the best estimate of the future expenditures to be<br />
incurred discounted at a risk free interest rate, <strong>and</strong> decommissioning liabilities are remeasured using the period end discount rate.<br />
In conjunction with the IFRS 1 exemption regarding petroleum <strong>and</strong> natural gas properties discussed above, the company was required to remeasure<br />
its decommissioning liabilities upon transition to IFRS <strong>and</strong> recognize the difference in Retained Earnings (Deficit). The application of this exemption<br />
resulted in a $20.9 million increase to decommissioning liabilities on the company’s consolidated balance sheet as at January 1, 2010 <strong>and</strong> a charge<br />
to Retained Earnings (Deficit) of $15.6 million net of tax benefits of $5.2 million. Subsequent IFRS remeasurements of decommissioning liabilities are<br />
recorded through property, plant <strong>and</strong> equipment with an offsetting adjustment to decommissioning liabilities. As at December 31, 2010, excluding the<br />
January 1, 2010 adjustment, the company’s decommissioning liabilities increased by $10.9 million which primarily reflects the remeasurement of the<br />
obligation using the company’s discount rate of 3.2 percent as at December 31, 2010. The use of the lower discount rate resulted in a decrease in<br />
the provision for unwinding of the discount totaling $812,000 for the year ended December 31, 2010.<br />
27.7 Investment in Associate<br />
As at January, 1, 2010 <strong>and</strong> December 31, 2010, the company owned 26.9 million Petrolifera common shares, representing 22 percent as at January<br />
1, 2010 <strong>and</strong> 18.5 percent as at December 31, 2010 of Petrolifera’s issued <strong>and</strong> outst<strong>and</strong>ing common shares, <strong>and</strong> 6.8 million Petrolifera share<br />
purchase warrants. Petrolifera was accounted for as an equity investment in associate. The following are the key differences in IFRS compared to<br />
previous GAAP.<br />
• Petrolifera was a public company <strong>and</strong> prepared 2010 <strong>and</strong> previous financial statements in accordance with Canadian generally accepted<br />
accounting principles similar to the company’s reporting in 2010 <strong>and</strong> previous years. Accordingly, the company’s share of loss, other<br />
comprehensive loss, dilution loss <strong>and</strong> associated deferred tax recorded in 2010 <strong>and</strong> previous years were based on previous GAAP amounts<br />
reported by Petrolifera. As a part of the company’s transition to IFRS, the company recorded the adjustments to its share of loss, other<br />
comprehensive loss <strong>and</strong> dilution loss with a corresponding effect on the investment account balance <strong>and</strong> Retained Earnings (Deficit) reflecting the<br />
adjustments to conform Petrolifera’s financial position <strong>and</strong> results of operations in accordance with IFRS <strong>and</strong> the accounting policies adopted by<br />
the company on the transition date.<br />
• In 2009, Petrolifera completed an equity financing under which Petrolifera issued 66.5 million common share units. Each unit was comprised of<br />
one Petrolifera common share <strong>and</strong> one–half Petrolifera share purchase warrant. <strong>Connacher</strong> subscribed for 13,556,000 units at a cost of $11.9<br />
million. Each full Petrolifera share purchase warrant entitled the holder to purchase one Petrolifera common share at a price of $1.20 per common<br />
share for a period of two years from issuance. These share purchase warrants were listed on Toronto Stock Exchange.<br />
Under previous GAAP, the total cost of $11.9 million was recorded as an investment in equity–accounted for investment on the consolidated balance<br />
sheet. Under IFRS, share purchase warrants meet the definition of a derivative asset that should be bifurcated from the host contract (investment in<br />
associate) <strong>and</strong> recorded at fair value on each reporting period end with changes recorded in net earnings (loss). As a result, the company recorded<br />
the fair value of share purchase warrants on January 1, 2010 by increasing other assets <strong>and</strong> decreasing deficit. In addition, the company recorded an<br />
unrealized loss of $2.2 million in 2010 representing the change in fair value of this derivative financial asset.<br />
• In April 2010, Petrolifera issued common shares as a part of equity financing <strong>and</strong> the company did not subscribe for shares in this financing.<br />
Accordingly, the company’s equity interest in Petrolifera was reduced to 18.5 percent from 22 percent. The reduction in the ownership interest<br />
resulted in a dilution loss which is required to be recorded under both under previous GAAP <strong>and</strong> IFRS in net earnings (loss). However, the amount<br />
of dilution loss under IFRS is different due to IFRS adjustments recorded in the investment account balance as discussed above. Further, IFRS<br />
requires the reclassification at the time of dilution of a proportionate amount of gain or loss previously recognized in other comprehensive loss to<br />
net earnings (loss). Accordingly, the company recorded a transfer of $422,000 in 2010 from other comprehensive loss to net earnings (loss) <strong>and</strong><br />
reported within share of interest in associate.<br />
• As explained in note 8.2, under IFRS, assets relating to the investment in Petrolifera were classified as assets held for sale on December 31,<br />
2010. Equity accounting ceased on December 31, 2010 <strong>and</strong> the carrying amount of the investment in associate was reclassified as assets<br />
held for sale <strong>and</strong> recorded at the lower of its carrying amount <strong>and</strong> fair value less costs to sell. Under previous GAAP, the accounting st<strong>and</strong>ard<br />
for classification of assets <strong>and</strong> liabilities as held for sale was not applicable to the disposition of an investment in associate <strong>and</strong> accordingly, no<br />
classification of asset held for sale was reported. However, under previous GAAP, the company recognized impairment to record the investment at<br />
its fair value.
AR <strong>2011</strong><br />
PG 87<br />
The following table summarizes the effect of transition to IFRS relating to investment in Petrolifera:<br />
(Canadian dollar in thous<strong>and</strong>s) January 1, 2010 December 31, 2010<br />
Balance sheet<br />
Amount reported under previous GAAP $ 50,379 $ 27,938<br />
Share of accumulated income (loss) (1,584) 4,873<br />
Share of accumulated other comprehensive loss (627) (4,492)<br />
Deferred tax 72 (636)<br />
Total Investment balance under IFRS 48,240 27,683<br />
Other asset – derivative financial asset 2,711 474<br />
Total investment in Petrolifera 50,951 28,157<br />
Less: Assets classified as held for sale $ – $ 28,157<br />
Net earnings (loss)<br />
Share of interest in associate $ – $ 5,377<br />
Finance charges – change in fair value of derivative – (2,237)<br />
Deferred tax – 228<br />
Effect to Retained Earnings (Deficit) excluding January, 1 2010 adjustments – 3,368<br />
Adjustments to Retained Earnings (Deficit) – January 1, 2010<br />
Share of loss (1,584) (1,584)<br />
Derivative financial asset 2,711 2,711<br />
1,127 1,127<br />
Total impact on Retained Earnings (Deficit) $ 1,127 $ 4,495<br />
27.8 Taxes<br />
The company recorded the following differences to the amounts reported for deferred tax under previous GAAP compared to IFRS.<br />
Flow–through shares – Under Canadian income tax legislation, a company is permitted to issue flow–through shares whereby the company is<br />
obligated to incur qualifying expenditures <strong>and</strong> renounce the related income tax deductions to the investors. Generally, due to transferring the benefit<br />
of tax deductions to the investors, common shares issued on a flow–through basis are offered at higher than the prevailing quoted prices of the<br />
company’s common shares.<br />
Under previous GAAP, the company recorded a deferred tax liability on renouncement of these qualifying expenditures with a corresponding reduction<br />
of share capital. Under IFRS, the proceeds from issuance of these shares are allocated between share capital <strong>and</strong> a liability to incur the qualifying<br />
expenditures. The amount allocated to share capital represents the quoted price of the existing shares whereas the liability represents the difference<br />
between the quoted price of the existing shares <strong>and</strong> the amount the investor pays for the shares. The liability is reversed when qualifying expenditures<br />
are renounced for tax purposes. As a result, share capital increased by $2.3 million <strong>and</strong> $7.6 million with a corresponding increase to deficit on<br />
January 1, 2010, <strong>and</strong> December 31, 2010, respectively.<br />
Discount on issue of long–term debt <strong>and</strong> capitalized stock–based compensation – Under IFRS deferred tax on temporary differences is not<br />
recorded for an item which is not a business combination <strong>and</strong> at the time of the transaction, neither affects accounting or taxable income. As a result,<br />
the company reversed previously recognized deferred income tax asset <strong>and</strong> liability with respect to the non-deductible portion of discount on issue of<br />
long-term debt <strong>and</strong> capitalized stock-based compensation with a corresponding reduction to Retained Earnings (Deficit).<br />
Inter–company capital losses <strong>and</strong> foreign exchange – An adjustment to recognize the deferred tax benefit on an intercompany capital loss was<br />
recorded under IFRS net of unrealized foreign exchange gain or losses on long–term debt. This was not permitted under previous GAAP.<br />
Current vs non–current classification – Under IFRS, all deferred taxes are classified as non–current, irrespective of the classification of the<br />
underlying assets or liabilities to which they relate, or the expected reversal of the temporary difference. The effect was to reclassify $2.3 million at<br />
January 1, 2010 <strong>and</strong> $4.5 million at December 31, 2010 from deferred tax assets (current) to deferred tax liabilities (non–current).
AR <strong>2011</strong><br />
PG 88<br />
The above adjustments changed the deferred tax liability as follows:<br />
As at<br />
January 1, 2010 December 31, 2010<br />
(Canadian dollar in thous<strong>and</strong>s)<br />
Flow–through shares $ 7,555 $ 6,943<br />
Capital loss on intercompany transaction (13,039) (12,653)<br />
Discount on long–term debt – (875)<br />
Foreign exchange impact on debt – 3,470<br />
Capitalized Stock–based compensation – (4,001)<br />
Reclassification (2,348) (4,497)<br />
Change in deferred tax liability $ (7,832) $ (11,613)<br />
Other items – In addition to the above items, the change in deferred tax liability on January 1, 2010 <strong>and</strong> as at <strong>and</strong> for the year ended December 31,<br />
2010 reflects the change in temporary differences resulting from the adjustments on transition to IFRS as described above.<br />
27.9 Debt<br />
Under previous GAAP, the convertible debentures were treated as a compound financial instrument with a debt <strong>and</strong> equity component. Under IFRS,<br />
the equity component is considered an embedded derivative. As permitted under IFRS, the company designated the convertible debentures as “fair<br />
value through profit <strong>and</strong> loss” <strong>and</strong> accordingly, recorded convertible debentures at fair value at each reporting end with changes reported within net<br />
earnings (loss). As a result, the equity portion of convertible debentures was reduced by $16.8 million with a corresponding increase to Retained<br />
Earnings (Deficit) on January 1, 2010 <strong>and</strong> December 31, 2010. In addition, the company recognized the effect of change in fair value by increasing<br />
the value of the convertible debentures by $3.6 million on January 1, 2010 with a corresponding increase to deficit. The adjustment also resulted in<br />
an increase of finance charges in 2010.<br />
27.10 Reclassifications<br />
In order to comply with the presentation of net earnings (loss) adopted by the company under IFRS, in the downstream segment, the company<br />
classified $3.9 million from operating expenses to general <strong>and</strong> administrative expenses in 2010.<br />
Further, under previous GAAP, the unwinding of the discount on decommissioning liabilities was included as a part of depletion, depreciation <strong>and</strong><br />
accretion expense in the consolidated statements of operations <strong>and</strong> comprehensive loss. Under IFRS this amount totaling $2.9 million in 2010 has<br />
been reclassified to finance charges.<br />
27.11 Changes to the Statement of Cash flow<br />
The following is a reconciliation of the company’s cash flow from operating, investing <strong>and</strong> financing activities reported in accordance with previous<br />
GAAP to IFRS for the year ended December 31, 2010:<br />
Year ended December 31<br />
2010<br />
(Canadian dollar in thous<strong>and</strong>s)<br />
Cash flow from operating activities under previous GAAP $ 10,785<br />
Exploration <strong>and</strong> evaluation expenses (964)<br />
Interest expense on long-term debt 55,637<br />
Change in working capital relating to interest expense on long-term debt 974<br />
Cash flow from operating activities under IFRS $ 66,432<br />
Cash flow used in investing activities under previous GAAP $ (269,763)<br />
Exploration <strong>and</strong> evaluation expenses 964<br />
Interest capitalized on long-term debt 35,408<br />
Cash flow used in investing activities under IFRS (233,391)<br />
Cash flow from financing activities under previous GAAP $ 25,793<br />
Interest expense paid (92,019)<br />
Cash flow used in financing activities under IFRS $ (66,226)<br />
Under previous GAAP, interest expense on long-term debt was reported as a part of operating activities. Under IFRS, the company has elected to<br />
present interest payments on long-term debt in financing activities.<br />
27.12 Loss per share<br />
Basic <strong>and</strong> diluted loss per share under IFRS were impacted by the IFRS adjustments discussed above.
CORPORATE INFORMATION<br />
Board of Directors<br />
D. Hugh Bessell (1)(2)(3)(5)<br />
Chairman, Audit Committee<br />
Retired Deputy Chairman,<br />
KPMG, LLP, Toronto<br />
Gregory A. Bol<strong>and</strong> (1)(5)<br />
President <strong>and</strong> Chief Executive Officer,<br />
West Face Capital Inc., Toronto<br />
Colin M. Evans<br />
Co-Managing Director,<br />
<strong>Connacher</strong> <strong>Oil</strong> <strong>and</strong> <strong>Gas</strong> Limited<br />
President, Evans & Co. Inc., Calgary<br />
Jennifer K. Kennedy (2)(4)<br />
Chairman, Governance Committee<br />
Partner, Norton Rose Canada LLP, Calgary<br />
Garry P. Mihaichuk (2)(3)<br />
Chairman, Human Resources Committee<br />
President, GWM Resources Ltd., Calgary<br />
Kelly J. Ogle (4)<br />
Chairman, HS&E Committee<br />
Co-Managing Director,<br />
<strong>Connacher</strong> <strong>Oil</strong> <strong>and</strong> <strong>Gas</strong> Limited<br />
President <strong>and</strong> Chief Executive Officer,<br />
Trafina Energy Ltd., Calgary<br />
W.C. (Mike) Seth (1)(3)(4)(5)<br />
Chairman, Reserves Committee<br />
President, Seth Consultants Ltd., Calgary<br />
(1) Audit Committee<br />
(2) Governance Committee<br />
(3) Human Resources Committee<br />
(4) Health, Safety <strong>and</strong> Environment Committee<br />
(5) Reserves Committee<br />
Abbreviations<br />
bbl/d<br />
boe<br />
boe/d<br />
mboe<br />
Mcf<br />
Mcf/d<br />
mmbtu<br />
MMcf<br />
NGL<br />
PV<br />
SAGD<br />
WTI<br />
barrels per day<br />
barrels of oil equivalent<br />
barrels of oil equivalent per day<br />
thous<strong>and</strong> barrels of oil equivalent<br />
thous<strong>and</strong> cubic feet<br />
thous<strong>and</strong> cubic feet per day<br />
million British thermal units<br />
million cubic feet<br />
natural gas liquids<br />
present value<br />
steam assisted gravity drainage<br />
West Texas Intermediate<br />
Officers<br />
Colin M. Evans<br />
Interim co-Managing Director<br />
Kelly J. Ogle<br />
Interim co-Managing Director<br />
Peter D. Sametz<br />
Interim Chief Executive Officer<br />
Brenda G. Hughes<br />
Chief Financial Officer<br />
Jesse J. Beaudry<br />
Vice President, Sustainability<br />
Merle D. Johnson<br />
Vice President, <strong>Oil</strong> S<strong>and</strong>s<br />
Stephen A. Marston<br />
Vice President, Exploration, L<strong>and</strong>, A & D<br />
TORONTO Stock ExCHANGE<br />
Trading symbol – CLL<br />
Head Office<br />
Suite 900<br />
332 – 6 Avenue SW<br />
Calgary, AB T2P 0B2<br />
Canada<br />
tel 403.538.6201 / fax 403.538.6225<br />
www.connacheroil.com<br />
inquiries@connacheroil.com<br />
Common SHARES<br />
CUSIP<br />
ISIN<br />
20588Y103<br />
CA20588Y1034<br />
Debt (U.S. RESIDENTS)<br />
8.75% Second Lien CUSIP 20588YAF0<br />
8.75% Second Lien ISIN CA20588YAF03<br />
8.5% Second Lien CUSIP 20588YAE3<br />
8.5% Second Lien ISIN US20588YAE32<br />
4.75% Convertible CUSIP 20588YAB9<br />
4.75% Convertible ISIN US20588YAB92<br />
Debt (Non U.S. RESIDENTS)<br />
8.75% Second Lien CUSIP C2627NAE3<br />
8.75% Second Lien ISIN CAC2627NAE53<br />
8.5% Second Lien CUSIP C2627NAC9<br />
8.5% Second Lien ISIN USC2627NAC95<br />
4.75% Convertible CUSIP 20588YAA1<br />
4.75% Convertible ISIN CA20588YAA16<br />
Subsidiaries<br />
Great Divide Holding Corporation<br />
Great Divide Pipeline Corporation<br />
Great Divide Pipeline Limited<br />
Montana Refining Company, Inc.<br />
AuDITORS<br />
Deloitte & Touche LLP, Calgary<br />
BankERS<br />
Royal Bank of Canada, Calgary<br />
Solicitors<br />
Norton Rose Canada LLP<br />
S.E.N.C.R.L., s.r.l. Calgary<br />
Reservoir Engineers<br />
GLJ Petroleum Consultants Ltd., Calgary<br />
RegISTRAR <strong>and</strong><br />
Transfer AgENT<br />
Valiant Trust Company, Calgary <strong>and</strong> Toronto<br />
Designed by bmir Bryan Mills Iradesso
Suite 900, 332 - 6 Avenue SW Calgary, AB Canada T2P 0B2<br />
T 403.538.6201 F 403.538.6225 E inquiries@connacheroil.com<br />
www.connacheroil.com