ANNUAL REPORT 2011 - Connacher Oil and Gas
ANNUAL REPORT 2011 - Connacher Oil and Gas
ANNUAL REPORT 2011 - Connacher Oil and Gas

You also want an ePaper? Increase the reach of your titles
YUMPU automatically turns print PDFs into web optimized ePapers that Google loves.
AR <strong>2011</strong><br />
PG 30<br />
ADJUSTED EBITDA, CASH FLOW AND NET LOSS<br />
<strong>Connacher</strong> realized improved operational performance in <strong>2011</strong> as a result of higher upstream <strong>and</strong> downstream sales volumes <strong>and</strong> higher product<br />
selling prices. This improved performance resulted in higher adjusted EBITDA. Adjusted EBITDA was $39.1 million in Q4 <strong>2011</strong> compared to $31.9<br />
million reported in Q4 2010; YTD <strong>2011</strong> was up 41 percent to $129.9 million, compared to $92.2 million in YTD 2010.<br />
Cash flow in Q4 <strong>2011</strong> of $19.3 million was 114 percent higher than the $9.0 million reported in Q4 2010. YTD <strong>2011</strong> cash flow of $45.1 million was<br />
26 percent higher than in YTD 2010 when it was $35.9 million. Increased cash flow in <strong>2011</strong> periods was primarily due to higher netbacks.<br />
The company realized net loss of $59.5 million in Q4 <strong>2011</strong> compared to a net loss of $25.6 million in Q4 2010 <strong>and</strong> incurred a net loss of $114.1<br />
million in YTD <strong>2011</strong> compared to a loss of $44.7 million in YTD 2010 primarily due to higher finance charges, the cost of refinancing long-term debt,<br />
higher depletion, depreciation, amortization <strong>and</strong> impairment charges <strong>and</strong> foreign exchange losses incurred in <strong>2011</strong>.<br />
CAPITAL EXPENDITURES<br />
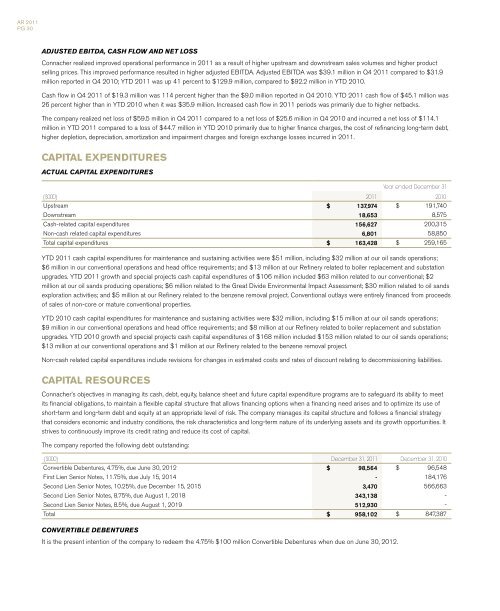
ACTUAL CAPITAL EXPENDITURES<br />
Year ended December 31<br />
($000) <strong>2011</strong> 2010<br />
Upstream $ 137,974 $ 191,740<br />
Downstream 18,653 8,575<br />
Cash-related capital expenditures 156,627 200,315<br />
Non-cash related capital expenditures 6,801 58,850<br />
Total capital expenditures $ 163,428 $ 259,165<br />
YTD <strong>2011</strong> cash capital expenditures for maintenance <strong>and</strong> sustaining activities were $51 million, including $32 million at our oil s<strong>and</strong>s operations;<br />
$6 million in our conventional operations <strong>and</strong> head office requirements; <strong>and</strong> $13 million at our Refinery related to boiler replacement <strong>and</strong> substation<br />
upgrades. YTD <strong>2011</strong> growth <strong>and</strong> special projects cash capital expenditures of $106 million included $63 million related to our conventional; $2<br />
million at our oil s<strong>and</strong>s producing operations; $6 million related to the Great Divide Environmental Impact Assessment; $30 million related to oil s<strong>and</strong>s<br />
exploration activities; <strong>and</strong> $5 million at our Refinery related to the benzene removal project. Conventional outlays were entirely financed from proceeds<br />
of sales of non-core or mature conventional properties.<br />
YTD 2010 cash capital expenditures for maintenance <strong>and</strong> sustaining activities were $32 million, including $15 million at our oil s<strong>and</strong>s operations;<br />
$9 million in our conventional operations <strong>and</strong> head office requirements; <strong>and</strong> $8 million at our Refinery related to boiler replacement <strong>and</strong> substation<br />
upgrades. YTD 2010 growth <strong>and</strong> special projects cash capital expenditures of $168 million included $153 million related to our oil s<strong>and</strong>s operations;<br />
$13 million at our conventional operations <strong>and</strong> $1 million at our Refinery related to the benzene removal project.<br />
Non-cash related capital expenditures include revisions for changes in estimated costs <strong>and</strong> rates of discount relating to decommissioning liabilities.<br />
CAPITAL RESOURCES<br />
<strong>Connacher</strong>’s objectives in managing its cash, debt, equity, balance sheet <strong>and</strong> future capital expenditure programs are to safeguard its ability to meet<br />
its financial obligations, to maintain a flexible capital structure that allows financing options when a financing need arises <strong>and</strong> to optimize its use of<br />
short-term <strong>and</strong> long-term debt <strong>and</strong> equity at an appropriate level of risk. The company manages its capital structure <strong>and</strong> follows a financial strategy<br />
that considers economic <strong>and</strong> industry conditions, the risk characteristics <strong>and</strong> long-term nature of its underlying assets <strong>and</strong> its growth opportunities. It<br />
strives to continuously improve its credit rating <strong>and</strong> reduce its cost of capital.<br />
The company reported the following debt outst<strong>and</strong>ing:<br />
($000) December 31, <strong>2011</strong> December 31, 2010<br />
Convertible Debentures, 4.75%, due June 30, 2012 $ 98,564 $ 96,548<br />
First Lien Senior Notes, 11.75%, due July 15, 2014 - 184,176<br />
Second Lien Senior Notes, 10.25%, due December 15, 2015 3,470 566,663<br />
Second Lien Senior Notes, 8.75%, due August 1, 2018 343,138 -<br />
Second Lien Senior Notes, 8.5%, due August 1, 2019 512,930 -<br />
Total $ 958,102 $ 847,387<br />
CONVERTIBLE DEBENTURES<br />
It is the present intention of the company to redeem the 4.75% $100 million Convertible Debentures when due on June 30, 2012.