ANNUAL REPORT 2011 - Connacher Oil and Gas
ANNUAL REPORT 2011 - Connacher Oil and Gas
ANNUAL REPORT 2011 - Connacher Oil and Gas

You also want an ePaper? Increase the reach of your titles
YUMPU automatically turns print PDFs into web optimized ePapers that Google loves.
AR <strong>2011</strong><br />
PG 73<br />
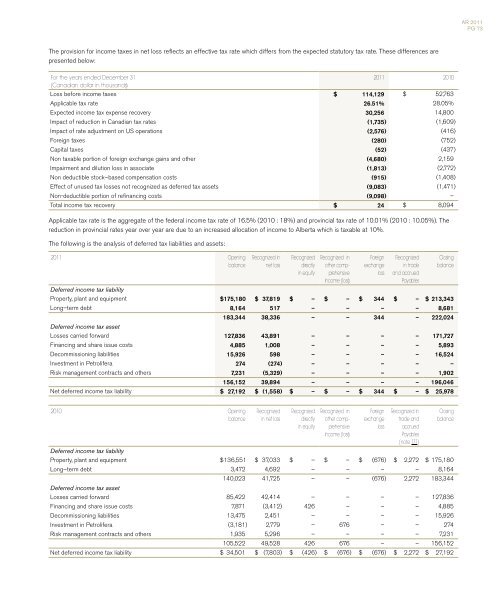
The provision for income taxes in net loss reflects an effective tax rate which differs from the expected statutory tax rate. These differences are<br />
presented below:<br />
For the years ended December 31<br />
<strong>2011</strong> 2010<br />
(Canadian dollar in thous<strong>and</strong>s)<br />
Loss before income taxes $ 114,129 $ 52,763<br />
Applicable tax rate 26.51% 28.05%<br />
Expected income tax expense recovery 30,256 14,800<br />
Impact of reduction in Canadian tax rates (1,735) (1,609)<br />
Impact of rate adjustment on US operations (2,576) (416)<br />
Foreign taxes (280) (752)<br />
Capital taxes (52) (437)<br />
Non taxable portion of foreign exchange gains <strong>and</strong> other (4,680) 2,159<br />
Impairment <strong>and</strong> dilution loss in associate (1,813) (2,772)<br />
Non deductible stock–based compensation costs (915) (1,408)<br />
Effect of unused tax losses not recognized as deferred tax assets (9,083) (1,471)<br />
Non-deductible portion of refinancing costs (9,098) –<br />
Total income tax recovery $ 24 $ 8,094<br />
Applicable tax rate is the aggregate of the federal income tax rate of 16.5% (2010 : 18%) <strong>and</strong> provincial tax rate of 10.01% (2010 : 10.05%). The<br />
reduction in provincial rates year over year are due to an increased allocation of income to Alberta which is taxable at 10%.<br />
The following is the analysis of deferred tax liabilities <strong>and</strong> assets:<br />
<strong>2011</strong> Opening<br />
balance<br />
Recognized in<br />
net loss<br />
Recognized<br />
directly<br />
in equity<br />
Recognized in<br />
other compprehensive<br />
Income (loss)<br />
Foreign<br />
exchange<br />
loss<br />
Recognized<br />
in trade<br />
<strong>and</strong> accrued<br />
Payables<br />
Deferred income tax liability<br />
Property, plant <strong>and</strong> equipment $ 175,180 $ 37,819 $ – $ – $ 344 $ – $ 213,343<br />
Long–term debt 8,164 517 – – – – 8,681<br />
183,344 38,336 – – 344 – 222,024<br />
Deferred income tax asset<br />
Losses carried forward 127,836 43,891 – – – – 171,727<br />
Financing <strong>and</strong> share issue costs 4,885 1,008 – – – – 5,893<br />
Decommissioning liabilities 15,926 598 – – – – 16,524<br />
Investment in Petrolifera 274 (274) – – – – –<br />
Risk management contracts <strong>and</strong> others 7,231 (5,329) – – – – 1,902<br />
156,152 39,894 – – – – 196,046<br />
Net deferred income tax liability $ 27,192 $ (1,558) $ – $ – $ 344 $ – $ 25,978<br />
Closing<br />
balance<br />
2010 Opening<br />
balance<br />
Recognized<br />
in net loss<br />
Recognized<br />
directly<br />
in equity<br />
Recognized in<br />
other compprehensive<br />
Income (loss)<br />
Foreign<br />
exchange<br />
loss<br />
Recognized in<br />
trade <strong>and</strong><br />
accrued<br />
Payables<br />
(note 17.1)<br />
Deferred income tax liability<br />
Property, plant <strong>and</strong> equipment $ 136,551 $ 37,033 $ – $ – $ (676) $ 2,272 $ 175,180<br />
Long–term debt 3,472 4,692 – – – – 8,164<br />
140,023 41,725 – – (676) 2,272 183,344<br />
Deferred income tax asset<br />
Losses carried forward 85,422 42,414 – – – – 127,836<br />
Financing <strong>and</strong> share issue costs 7,871 (3,412) 426 – – – 4,885<br />
Decommissioning liabilities 13,475 2,451 – – – – 15,926<br />
Investment in Petrolifera (3,181) 2,779 – 676 – – 274<br />
Risk management contracts <strong>and</strong> others 1,935 5,296 – – – – 7,231<br />
105,522 49,528 426 676 – – 156,152<br />
Net deferred income tax liability $ 34,501 $ (7,803) $ (426) $ (676) $ (676) $ 2,272 $ 27,192<br />
Closing<br />
balance