ANNUAL REPORT 2011 - Connacher Oil and Gas
ANNUAL REPORT 2011 - Connacher Oil and Gas
ANNUAL REPORT 2011 - Connacher Oil and Gas

Create successful ePaper yourself
Turn your PDF publications into a flip-book with our unique Google optimized e-Paper software.
AR <strong>2011</strong><br />
PG 24<br />
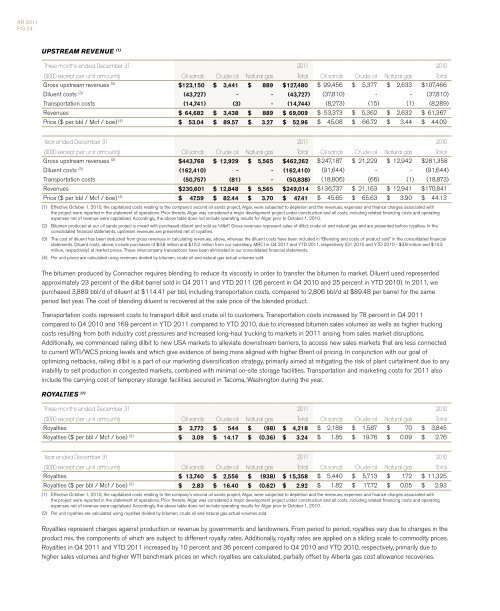
UPSTREAM REVENUE (1)<br />
Three months ended December 31 <strong>2011</strong> 2010<br />
($000 except per unit amounts) <strong>Oil</strong> s<strong>and</strong>s Crude oil Natural gas Total <strong>Oil</strong> s<strong>and</strong>s Crude oil Natural gas Total<br />
Gross upstream revenues (2) $ 123,150 $ 3,441 $ 889 $ 127,480 $ 99,456 $ 5,377 $ 2,633 $ 107,466<br />
Diluent costs (3) (43,727) - - (43,727) (37,810) - - (37,810)<br />
Transportation costs (14,741) (3) - (14,744) (8,273) (15) (1) (8,289)<br />
Revenues $ 64,682 $ 3,438 $ 889 $ 69,009 $ 53,373 $ 5,362 $ 2,632 $ 61,367<br />
Price ($ per bbl / Mcf / boe) (4) $ 53.04 $ 89.57 $ 3.27 $ 52.96 $ 45.08 $ 66.72 $ 3.44 $ 44.09<br />
Year ended December 31 <strong>2011</strong> 2010<br />
($000 except per unit amounts) <strong>Oil</strong> s<strong>and</strong>s Crude oil Natural gas Total <strong>Oil</strong> s<strong>and</strong>s Crude oil Natural gas Total<br />
Gross upstream revenues (2) $ 443,768 $ 12,929 $ 5,565 $ 462,262 $ 247,187 $ 21,229 $ 12,942 $ 281,358<br />
Diluent costs (3) (162,410) - - (162,410) (91,644) - - (91,644)<br />
Transportation costs (50,757) (81) - (50,838) (18,806) (66) (1) (18,873)<br />
Revenues $ 230,601 $ 12,848 $ 5,565 $ 249,014 $ 136,737 $ 21,163 $ 12,941 $ 170,841<br />
Price ($ per bbl / Mcf / boe) (4) $ 47.59 $ 82.44 $ 3.70 $ 47.41 $ 45.65 $ 65.63 $ 3.90 $ 44.13<br />
(1) Effective October 1, 2010, the capitalized costs relating to the company’s second oil s<strong>and</strong>s project, Algar, were subjected to depletion <strong>and</strong> the revenues, expenses <strong>and</strong> finance charges associated with<br />
the project were reported in the statement of operations. Prior thereto, Algar was considered a major development project under construction <strong>and</strong> all costs, including related financing costs <strong>and</strong> operating<br />
expenses net of revenue were capitalized. Accordingly, the above table does not include operating results for Algar prior to October 1, 2010.<br />
(2) Bitumen produced at our oil s<strong>and</strong>s project is mixed with purchased diluent <strong>and</strong> sold as “dilbit”. Gross revenues represent sales of dilbit, crude oil <strong>and</strong> natural gas <strong>and</strong> are presented before royalties. In the<br />
consolidated financial statements, upstream revenues are presented net of royalties.<br />
(3) The cost of diluent has been deducted from gross revenues in calculating revenues, above, whereas the diluent costs have been included in “Blending <strong>and</strong> costs of product sold” in the consolidated financial<br />
statements. Diluent costs, above, include purchases of $3.8 million <strong>and</strong> $15.2 million from our subsidiary, MRCI in Q4 <strong>2011</strong> <strong>and</strong> YTD <strong>2011</strong>, respectively (Q1 2010 <strong>and</strong> YTD 2010 - $3.8 million <strong>and</strong> $14.3<br />
million, respectively) at market prices. These intercompany transactions have been eliminated in our consolidated financial statements.<br />
(4) Per unit prices are calculated using revenues divided by bitumen, crude oil <strong>and</strong> natural gas actual volumes sold.<br />
The bitumen produced by <strong>Connacher</strong> requires blending to reduce its viscosity in order to transfer the bitumen to market. Diluent used represented<br />
approximately 23 percent of the dilbit barrel sold in Q4 <strong>2011</strong> <strong>and</strong> YTD <strong>2011</strong> (26 percent in Q4 2010 <strong>and</strong> 25 percent in YTD 2010). In <strong>2011</strong>, we<br />
purchased 3,889 bbl/d of diluent at $114.41 per bbl, including transportation costs, compared to 2,806 bbl/d at $89.48 per barrel for the same<br />
period last year. The cost of blending diluent is recovered at the sale price of the blended product.<br />
Transportation costs represent costs to transport dilbit <strong>and</strong> crude oil to customers. Transportation costs increased by 78 percent in Q4 <strong>2011</strong><br />
compared to Q4 2010 <strong>and</strong> 169 percent in YTD <strong>2011</strong> compared to YTD 2010, due to increased bitumen sales volumes as wells as higher trucking<br />
costs resulting from both industry cost pressures <strong>and</strong> increased long-haul trucking to markets in <strong>2011</strong> arising from sales market disruptions.<br />
Additionally, we commenced railing dilbit to new USA markets to alleviate downstream barriers, to access new sales markets that are less connected<br />
to current WTI/WCS pricing levels <strong>and</strong> which give evidence of being more aligned with higher Brent oil pricing. In conjunction with our goal of<br />
optimizing netbacks, railing dilbit is a part of our marketing diversification strategy, primarily aimed at mitigating the risk of plant curtailment due to any<br />
inability to sell production in congested markets, combined with minimal on-site storage facilities. Transportation <strong>and</strong> marketing costs for <strong>2011</strong> also<br />
include the carrying cost of temporary storage facilities secured in Tacoma, Washington during the year.<br />
ROYALTIES (1)<br />
Three months ended December 31 <strong>2011</strong> 2010<br />
($000 except per unit amounts) <strong>Oil</strong> s<strong>and</strong>s Crude oil Natural gas Total <strong>Oil</strong> s<strong>and</strong>s Crude oil Natural gas Total<br />
Royalties $ 3,772 $ 544 $ (98) $ 4,218 $ 2,188 $ 1,587 $ 70 $ 3,845<br />
Royalties ($ per bbl / Mcf / boe) (2) $ 3.09 $ 14.17 $ (0.36) $ 3.24 $ 1.85 $ 19.76 $ 0.09 $ 2.76<br />
Year ended December 31 <strong>2011</strong> 2010<br />
($000 except per unit amounts) <strong>Oil</strong> s<strong>and</strong>s Crude oil Natural gas Total <strong>Oil</strong> s<strong>and</strong>s Crude oil Natural gas Total<br />
Royalties $ 13,740 $ 2,556 $ (938) $ 15,358 $ 5,440 $ 5,713 $ 172 $ 11,325<br />
Royalties ($ per bbl / Mcf / boe) (2) $ 2.83 $ 16.40 $ (0.62) $ 2.92 $ 1.82 $ 17.72 $ 0.05 $ 2.93<br />
(1) Effective October 1, 2010, the capitalized costs relating to the company’s second oil s<strong>and</strong>s project, Algar, were subjected to depletion <strong>and</strong> the revenues, expenses <strong>and</strong> finance charges associated with<br />
the project were reported in the statement of operations. Prior thereto, Algar was considered a major development project under construction <strong>and</strong> all costs, including related financing costs <strong>and</strong> operating<br />
expenses net of revenue were capitalized. Accordingly, the above table does not include operating results for Algar prior to October 1, 2010.<br />
(2) Per unit royalties are calculated using royalties divided by bitumen, crude oil <strong>and</strong> natural gas actual volumes sold.<br />
Royalties represent charges against production or revenue by governments <strong>and</strong> l<strong>and</strong>owners. From period to period, royalties vary due to changes in the<br />
product mix, the components of which are subject to different royalty rates. Additionally, royalty rates are applied on a sliding scale to commodity prices.<br />
Royalties in Q4 <strong>2011</strong> <strong>and</strong> YTD <strong>2011</strong> increased by 10 percent <strong>and</strong> 36 percent compared to Q4 2010 <strong>and</strong> YTD 2010, respectively, primarily due to<br />
higher sales volumes <strong>and</strong> higher WTI benchmark prices on which royalties are calculated, partially offset by Alberta gas cost allowance recoveries.