ANNUAL REPORT 2011 - Connacher Oil and Gas
ANNUAL REPORT 2011 - Connacher Oil and Gas
ANNUAL REPORT 2011 - Connacher Oil and Gas

You also want an ePaper? Increase the reach of your titles
YUMPU automatically turns print PDFs into web optimized ePapers that Google loves.
AR <strong>2011</strong><br />
PG 26<br />
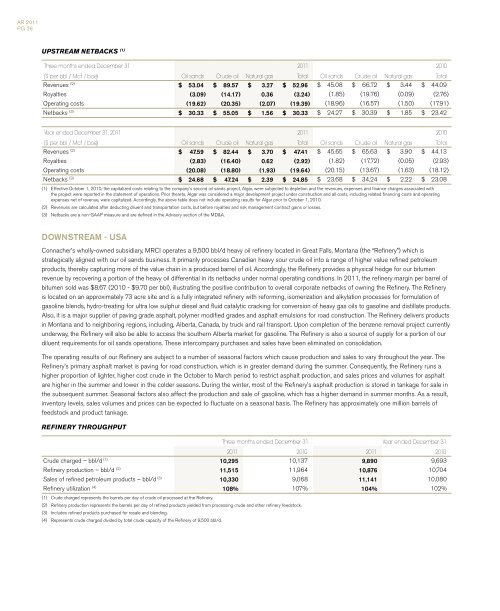
UPSTREAM NETBACKS (1)<br />
Three months ended December 31 <strong>2011</strong> 2010<br />
($ per bbl / Mcf / boe) <strong>Oil</strong> s<strong>and</strong>s Crude oil Natural gas Total <strong>Oil</strong> s<strong>and</strong>s Crude oil Natural gas Total<br />
Revenues (2) $ 53.04 $ 89.57 $ 3.27 $ 52.96 $ 45.08 $ 66.72 $ 3.44 $ 44.09<br />
Royalties (3.09) (14.17) 0.36 (3.24) (1.85) (19.76) (0.09) (2.76)<br />
Operating costs (19.62) (20.35) (2.07) (19.39) (18.96) (16.57) (1.50) (17.91)<br />
Netbacks (3) $ 30.33 $ 55.05 $ 1.56 $ 30.33 $ 24.27 $ 30.39 $ 1.85 $ 23.42<br />
Year ended December 31, <strong>2011</strong> <strong>2011</strong> 2010<br />
($ per bbl / Mcf / boe) <strong>Oil</strong> s<strong>and</strong>s Crude oil Natural gas Total <strong>Oil</strong> s<strong>and</strong>s Crude oil Natural gas Total<br />
Revenues (2) $ 47.59 $ 82.44 $ 3.70 $ 47.41 $ 45.65 $ 65.63 $ 3.90 $ 44.13<br />
Royalties (2.83) (16.40) 0.62 (2.92) (1.82) (17.72) (0.05) (2.93)<br />
Operating costs (20.08) (18.80) (1.93) (19.64) (20.15) (13.67) (1.63) (18.12)<br />
Netbacks (3) $ 24.68 $ 47.24 $ 2.39 $ 24.85 $ 23.68 $ 34.24 $ 2.22 $ 23.08<br />
(1) Effective October 1, 2010, the capitalized costs relating to the company’s second oil s<strong>and</strong>s project, Algar, were subjected to depletion <strong>and</strong> the revenues, expenses <strong>and</strong> finance charges associated with<br />
the project were reported in the statement of operations. Prior thereto, Algar was considered a major development project under construction <strong>and</strong> all costs, including related financing costs <strong>and</strong> operating<br />
expenses net of revenue, were capitalized. Accordingly, the above table does not include operating results for Algar prior to October 1, 2010.<br />
(2) Revenues are calculated after deducting diluent <strong>and</strong> transportation costs, but before royalties <strong>and</strong> risk management contract gains or losses.<br />
(3) Netbacks are a non-GAAP measure <strong>and</strong> are defined in the Advisory section of the MD&A.<br />
DOWNSTREAM - USA<br />
<strong>Connacher</strong>’s wholly-owned subsidiary, MRCI operates a 9,500 bbl/d heavy oil refinery located in Great Falls, Montana (the “Refinery”) which is<br />
strategically aligned with our oil s<strong>and</strong>s business. It primarily processes Canadian heavy sour crude oil into a range of higher value refined petroleum<br />
products, thereby capturing more of the value chain in a produced barrel of oil. Accordingly, the Refinery provides a physical hedge for our bitumen<br />
revenue by recovering a portion of the heavy oil differential in its netbacks under normal operating conditions. In <strong>2011</strong>, the refinery margin per barrel of<br />
bitumen sold was $8.67 (2010 - $9.70 per bbl), illustrating the positive contribution to overall corporate netbacks of owning the Refinery. The Refinery<br />
is located on an approximately 73 acre site <strong>and</strong> is a fully integrated refinery with reforming, isomerization <strong>and</strong> alkylation processes for formulation of<br />
gasoline blends, hydro-treating for ultra low sulphur diesel <strong>and</strong> fluid catalytic cracking for conversion of heavy gas oils to gasoline <strong>and</strong> distillate products.<br />
Also, it is a major supplier of paving grade asphalt, polymer modified grades <strong>and</strong> asphalt emulsions for road construction. The Refinery delivers products<br />
in Montana <strong>and</strong> to neighboring regions, including, Alberta, Canada, by truck <strong>and</strong> rail transport. Upon completion of the benzene removal project currently<br />
underway, the Refinery will also be able to access the southern Alberta market for gasoline. The Refinery is also a source of supply for a portion of our<br />
diluent requirements for oil s<strong>and</strong>s operations. These intercompany purchases <strong>and</strong> sales have been eliminated on consolidation.<br />
The operating results of our Refinery are subject to a number of seasonal factors which cause production <strong>and</strong> sales to vary throughout the year. The<br />
Refinery’s primary asphalt market is paving for road construction, which is in greater dem<strong>and</strong> during the summer. Consequently, the Refinery runs a<br />
higher proportion of lighter, higher cost crude in the October to March period to restrict asphalt production, <strong>and</strong> sales prices <strong>and</strong> volumes for asphalt<br />
are higher in the summer <strong>and</strong> lower in the colder seasons. During the winter, most of the Refinery’s asphalt production is stored in tankage for sale in<br />
the subsequent summer. Seasonal factors also affect the production <strong>and</strong> sale of gasoline, which has a higher dem<strong>and</strong> in summer months. As a result,<br />
inventory levels, sales volumes <strong>and</strong> prices can be expected to fluctuate on a seasonal basis. The Refinery has approximately one million barrels of<br />
feedstock <strong>and</strong> product tankage.<br />
REFINERY THROUGHPUT<br />
Three months ended December 31 Year ended December 31<br />
<strong>2011</strong> 2010 <strong>2011</strong> 2010<br />
Crude charged – bbl/d (1) 10,295 10,137 9,890 9,693<br />
Refinery production – bbl/d (2) 11,515 11,964 10,876 10,704<br />
Sales of refined petroleum products – bbl/d (3) 10,330 9,068 11,141 10,080<br />
Refinery utilization (4) 108% 107% 104% 102%<br />
(1) Crude charged represents the barrels per day of crude oil processed at the Refinery.<br />
(2) Refinery production represents the barrels per day of refined products yielded from processing crude <strong>and</strong> other refinery feedstock.<br />
(3) Includes refined products purchased for resale <strong>and</strong> blending.<br />
(4) Represents crude charged divided by total crude capacity of the Refinery of 9,500 bbl/d.